

Abstract
A universal goal in studying the structures of macromolecules and macromolecular complexes by means of electron cryo-microscopy (cryo-TEM) and three-dimensional (3D) image reconstruction is the derivation of a reliable atomic or pseudoatomic model. Such a model provides the foundation for exploring in detail the mechanisms by which biomolecules function. Though a variety of highly ordered, symmetric specimens such as 2D crystals, helices, and icosahedral virus capsids have been studied by these methods at near-atomic resolution, until recently, numerous challenges have made it difficult to achieve sub-nanometer resolution with large (≥~500 Å), asymmetric molecules such as the tailed bacteriophages.
After briefly reviewing some of the history behind the development of asymmetric virus reconstructions, we use recent structural studies of the prolate phage φ29 as an example to illustrate the step-by-step procedures used to compute an asymmetric reconstruction at sub-nanometer resolution. In contrast to methods that have been employed to study other asymmetric complexes, we demonstrate how symmetries in the head and tail components of the phage can be exploited to obtain the structure of the entire phage in an expedited, stepwise process. Prospects for future enhancements to the procedures currently employed are noted in the concluding section.
1. Introduction: 3D Asymmetric Reconstruction of Tailed Bacteriophage
Electron microscopy and three-dimensional (3D) image reconstruction have been the preferred tools for more than 40 years for studying large macromolecular structures that resist crystallization. Even for those viruses that can be crystallized, an advantage of electron microscopy is that it can be used to capture more transient, intermediate stages in the viral life cycle (e.g., Steven et al., 2005) or to visualize the virus complexed with antibodies, receptors, or other molecules and ligands (e.g., Smith, 2003; Stewart et al., 2003). These techniques were first applied to images of negatively stained samples of the helical, contractile tail of bacteriophage T4 (DeRosier and Klug, 1968; see DeRosier’s Personal Account in this volume) and to the icosahedral tomato bushy stunt and human papilloma viruses (Crowther et al., 1970), and they have since been used to solve the structures of a rapidly expanding universe of macromolecules and macromolecular complexes imaged by means of electron cryo-microscopy (cryo-TEM) (Cheng and Walz, 2009; Jonic et al., 2008; also, see other chapters in this volume).
Whenever possible, advantage is taken of the inherent symmetry of the particles since this generally allows one to reach higher resolutions and maximize the signal-to-noise ratio in the final reconstructed map. One of the best examples of exploiting symmetry is found in the study of icosahedral viruses, where each image contains information from 60 equivalent views (Baker et al., 1999; Crowther et al., 1970). Recent advances in both the microscopy and image processing methods have enabled cryo-reconstructions of icosahedral viruses to approach atomic resolution (Chen et al., 2009; Wolf et al., 2010; Zhang et al., 2008, 2010; Zhou, 2008).
1.1. Symmetry mismatch in phage structure
Many bacteriophage contain a multi-subunit, multicomponent tail connected to a unique vertex of the capsid, and it is through this vertex that the genome is packaged during assembly and released during infection. The heads of tailed phages have either a prolate (e.g., T4 and φ29) or an isometric (e.g., P22, T7, λ, and ε15) morphology, but all heads possess a fivefold rotational symmetry about an axis that passes through the tail and opposing vertex. The tail complex generally has 6- or 12-fold redundancy in the constituent viral proteins, which results in a symmetry mismatch at the junction between the head and tail (Jiang et al., 2006; Lander et al., 2006; Xiang et al., 2006). The DNA genome is a molecule with a unique sequence and hence cannot adopt a structure that matches any of the local symmetries in the capsid or tail components. Given that there is just one copy of the genome and at least one prominent, symmetry mismatch between the capsid and tail, the phage as a whole must be asymmetric.
Symmetry averaging is often used as part of the reconstruction process, and whether applied to viruses with full icosahedral symmetry or to tailed phages with fivefold symmetric heads, comes at a cost. Only those components that possess the imposed symmetry will be accurately represented in the averaged final map. Other features of the virus structure, such as the packaged genome or unique tail, will be smeared out since they do not share the imposed symmetry. Reconstructions of these viruses could, in principle, be carried out from start to finish without applying any symmetry using techniques similar to those used to study ribosomes (Frank, 2009), in which no symmetry is imposed. But the tailed phages provide a unique set of challenges since intrinsic local symmetries in parts of the phage can complicate the reconstruction process. For example, an attempt to process images of P22 phage, in which only C1 symmetry was assumed from the start, failed to lead directly to a valid reconstruction (Chang et al., 2006). Thus, it can be beneficial to exploit the inherent local symmetry in components of the phage when designing a reconstruction strategy that will yield a reliable density map from images of particles whose global structure is asymmetric.
1.2. History of asymmetric virus reconstructions by single-particle cryo-TEM
The widespread success with icosahedral virus reconstructions has also stimulated the development of techniques to study nonicosahedral viruses (Johnson and Chiu, 2007). After generalizing our polar Fourier transform method (Baker and Cheng, 1996) to handle cyclic symmetries, we obtained the first reconstruction of a tailed bacteriophage with a prolate head (Tao et al., 1998). In that study of φ29, fivefold symmetry was imposed to enhance features in the head structure. However, since the φ29 tail is not fivefold symmetric, its structure was smeared out in the reconstruction. Later, a two-step processing scheme was developed to preserve symmetry mismatched components in the entire phage (Morais et al., 2001). In step one, a fivefold-averaged reconstruction was computed in which the head but not tail was symmetrized. Then, the fivefold symmetry constraint of the head was removed and each particle image was compared to five separate, related projections of the model. The projection with the highest correlation to each particle image was used to assign the view orientation for that particle. This new set of particle orientations provided the necessary information needed to combine the images and compute a new reconstruction in which no symmetry was enforced. The second step of the procedure was repeated and led to the first asymmetric reconstruction of the complete φ29 phage at 33-Å resolution (Morais et al., 2001).
Since this initial φ29 asymmetric reconstruction, several other 3D density maps of entire tailed phages have been determined at progressively higher resolutions (Table 7.1). In all these studies, even those at lower resolutions (~20 Å), the head and tail structures were clearly resolved. Our studies of φ29 have led to two, sub-nanometer resolution, asymmetric reconstructions that have made it possible to resolve features corresponding to helices in the head–tail connector as well as a highly condensed, toroid-like DNA structure embedded within a cavity at the connector–tail junction (Tang et al., 2008b).
Table 7.1.
Chronological history of asymmetric cryo-reconstructions of entire tailed bacteriophage
| Phage | Head shape | Softwarea | Resolution (Å) | Reference |
|---|---|---|---|---|
| φ29 | Prolate | PFT | 33 | Morais et al., 2001 |
| T7 | Isometric | XMIPP | 24 | Agirrezabala, 2005 |
| ε15 | Isometric | EMAN | 20 | Jiang et al., 2006 |
| P22 | Isometric | EMAN | 20 | Chang et al., 2006 |
| P22 | Isometric | SPIDER | 17 | Lander et al., 2006 |
| φ29 | Prolate | EMAN | 16 | Xiang et al., 2006 |
| φ29 | Prolate | EMAN, FREALIGN, AUTO3DEM | 7.8 | Tang et al., 2008b |
| N4 | Isometric | EMAN | 29 | Choi et al., 2008 |
Software indicates main program(s) used to perform reconstruction. It is assumed that, in all or most cases, additional scripts were required for image preprocessing, data manipulation, file format conversions, and other tasks.
1.3. Alternative strategies to determine the structures of asymmetric viruses
Not all phages or asymmetric complexes can be readily solved using the strategy we have outlined above. For example, T4 phage with its long, contractile tail, remains a significant challenge for single particle, asymmetric reconstruction methods. For T4, a concerted, “divide and conquer” approach was used to solve the head (Fokine et al., 2004) and tail (Kostyuchenko et al., 2005) structures separately. Asymmetric reconstruction techniques have also been used to examine virus–host interactions at limited resolution. Studies of polio and Semliki Forest virus attachment to liposomes were aided by manually adding high intensity dots in the images at points in the membrane where virus particles attached (Bubeck et al., 2008). These dots served as fiducial markers to help in determining the relative orientations of individual virus particles and to compute from those images a reconstruction that indicated a unique vertex is involved in the delivery of the genome in both types of virus.
1.4. Cryo-TEM of φ29
The sample preparation and microscopy steps required to produce a set of images from which the reconstructed structure of an asymmetric virus can be obtained are identical to those used to study icosahedral particles (e.g., Baker et al., 1999). We recently computed asymmetric reconstructions of two different φ29 particles (Tang et al., 2008b). These included fiberless (gp8.5-) virions and fiberless “ghosts,” which are particles formed by inducing virions in vitro to lose their dsDNA genome and the two molecules of viral gene product 3 (gp3) that are covalently linked to the ends of the linear genome. The same procedures were used to determine the 3D structures of both types of particles (to 7.8 and 9.3 Å, respectively), and we limit our discussion here to the procedures used to study the virion. Briefly, the microscopy involved first taking purified samples of fiberless φ29 virions and vitrifing them over holey, carbon-coated grids (Chapter 3, Vol. 481). Images of these samples were then recorded on Kodak SO163 electron image film at a nominal magnification of 38,000× and an electron dose of ~20e−/Å2 in an FEI CM200 FEG microscope operated at 200 keV. Micrographs that exhibited minimal astigmatism and specimen drift, and with the objective lens under-focused by 1–5 μm, were digitized at 7 μm intervals on a Zeiss PHODIS scanner and bin-averaged to yield an effective pixel size of 3.68 Å. A total of 12,682 particle images were selected from 74 micrographs for further processing.
1.5. Strategy for determining the φ29 structure
The general image reconstruction scheme we used followed a model-based refinement procedure. This entailed aligning raw particle images relative to a series of projections of an existing 3D model to estimate the origin and orientation of each particle. The particle origin is defined by the (x,y) pixel coordinates of the position of the center of the particle in the image, and the particle orientation is defined by three angles (θ, φ, ω) that specify the direction from which the particle is viewed in the image (See Baker et al., 1999 for definition of these angles.). With this set of five particle parameters, a new 3D reconstruction can be computed and used as the model for the next iteration of the process.
The specific reconstruction strategy that we adopted in our φ29 study involved two major branches as shown schematically in Fig. 7.1. This strategy took into account that fact that φ29 has a prolate head (~480 × 600 Å) and a tail of comparable length (~400 Å). The first branch of the processing scheme constructs a reliable starting model and achieves optimal particle boxing. This includes calculating separate head and tail models and then combining them into a single, hybrid model. The second branch takes this hybrid model, computes projections, and compares these to each raw image to assign to it an origin and orientation. The images are used to compute a new reconstruction and several cycles of alignment and image screening (to weed out “bad” particles) are carried out until no further improvement in resolution is achieved.
Figure 7.1.

φ29 image reconstruction flowchart. Left hand side of flowchart shows steps taken to generate hybrid-starting model built from fivefold symmetric phage head and 12-fold symmetric tail. Right hand side illustrates steps in fully asymmetric reconstruction. Numbers next to loops indicate the number of iterations used in stages of the φ29 reconstruction and will likely vary for other phage species.
1.6. Image reconstruction software
Owing to the complexity of performing asymmetric reconstructions, we found it necessary to use different image reconstruction packages at various stages of the process. In the φ29 project and as described below, we used EMAN (Ludtke et al., 1999), FREALIGN (Grigorieff, 2007), AUTO3-DEM (Yan et al., 2007b), and BSOFT (Heymann, 2001) to ultimately reach sub-nanometer resolution. It is important to stress that our choice of programs more reflects our familiarity with the capabilities of the software than it does with providing an optimized strategy. These packages and others such as SPIDER (Frank et al., 1996) and XMIPP (Sorzano et al., 2004) contain many useful features that require significant expertise in order to use to their full potential (see also Chapter 15 in this volume).
2. Particle Boxing
The purpose of boxing is to window out individual particles from their surroundings and to minimize the contribution of extraneous noise in the images to the final 3D reconstruction. Ideally, the boxing procedure centers each particle in its own box and excludes all neighboring particles. The defocus used in generating phase contrast during microscopy causes particle details to spread outside the particle boundary (Rosenthal and Henderson, 2003), and hence the pixel dimensions of the box need to extend well enough beyond this boundary to preserve structural information. The choice of the box size depends on resolution and amount of defocus. For the φ29 image data, we chose a box size approximately 50% larger than the width of the prolate head (Fig. 7.2, red circles).
Figure 7.2.

Progressive boxing of phage particles. The small blue circles indicate the initial boxing of the particles, with box size chosen to capture head and proximal portion of tail. As the reconstruction progresses, the box size is gradually expanded to include more of the tail (large red circles). Note that the red and blue circles are not concentric and that the top of the phage head remains a constant distance from the edge of the circle.
The type of boxing employed depends on the shape of the phage head and the length of the tail. If the head is isometric and the tail is short relative to the size of the capsid, which is true for some phage like P22 (Lander et al., 2006), the particle can simply be boxed so that the head center coincides with the center of the box. Alternatively, if the tail dimension is comparable to that of the head, then the center of the box should coincide with the center of the whole particle to avoid having to make the box size excessively large.
2.1. Initial tight boxing of the phage head
Given that we did not have a starting model of the entire φ29 virion, we decided to adopt a systematic, stepwise approach to solving its structure. This involved first constructing a model just for the head from a subset of ~1000 images masked tightly to include primarily the phage heads. Subsequently, we incrementally increased the size of the box to include more and more of the tail with the eventual goal of including the entire image of each phage particle in the final reconstruction as described below (Section 3). Hence, we started by boxing out just the particle heads and thereby excluded most of the tail and most of the neighboring particles (Fig. 7.2, blue circles). This tight boxing strategy helped to enhance the reliability with which initial particle origin and orientation parameters could be determined. Such a procedure is unnecessary with icosahedral particles since the origin of spherically symmetric objects is generally fairly easy to define quite accurately. The procedure does limit the resolution of the initial 3D reconstruction, but the overriding concern at this point is to obtain a reliable starting model. All boxing was carried out with the program RobEM (http://cryoem.ucsd.edu/programs.shtml) and images were converted from PIF to IMAGIC format using BSOFT (Heymann, 2001) before the next step of processing was performed using EMAN (Ludtke et al., 1999).
2.2. Reboxing to center the particle
Whether particle boxing is performed manually or automatically, it is difficult to assure that each particle will be centered to 1 pixel accuracy in its box. Experience shows that reconstruction quality can be improved by periodically reboxing the particles using the latest set of origin positions obtained during the iterative refinement process (Gurda et al., 2010). More significantly, with asymmetric particles it is important to make sure that the origin of each boxed particle correlates with the defined origin of the most current reconstructed model. Hence, after each cycle of EMAN as described later (Section 3.1), the identified origin of the particle within the box is used to reextract without interpolation the particle image from the micrograph such that this origin lies within 1 pixel of the center of the new box.
2.3. Expanding the box to include the tail
After a reliable head map was obtained (i.e., one in which pentameric and hexameric gp8 capsomers were clearly resolved), all particles were boxed anew from the raw micrographs using a circular mask, typically larger by 10–15 pixels in radius, to include more of the tail structure in each image. This necessitated that the density map of the head just calculated be padded with voxels set to the background density to match the size of the newly boxed particles and used as the model to align the images. Padding entailed adding voxels to expand all three dimensions of the cubic density map by equal amounts. The long axis of the phage was kept centered in the map but voxels in the axial direction were primarily added toward the tail side. This procedure assured that the particle (head + currently included portion of tail) was centered within the box containing the reconstructed 3D map.
The padded density map was used to generate a new set of projected images from which the origin and orientation parameters for each image could be redetermined. These were then used to compute a new reconstruction and to recenter and rebox the particles. At this point the mask was expanded, the map repadded with the background density, and the origins and orientations redetermined. This cycle of steps was repeated four additional times, at the end of which the entire phage particle was included in the density map.
2.4. Additional considerations about boxing
Typically, the early stages of the reconstruction process are accelerated significantly by making use of images that are two- or fourfold, bin-averaged. This is feasible because the primary goal at this stage is to obtain a low-resolution starting model whose size and shape are approximately correct. Hence, it is not necessary to use data at full pixel resolution. It is worth noting that, though automatic boxing routines can be used to speed up the boxing process, it was helpful with φ29 to take the extra time to manually screen the entire data set of images and select the best ones to include in the processing. Ultimately, even the most sophisticated alignment algorithms cannot compensate for poor particle selection. Finally, though our reboxing strategy added additional steps to the entire image processing procedure, it proved to be quite effective in assuring that the particles were optimally centered in the boxes.
3. Generating a Starting Model of the Complete φ29 Phage
Considerable effort is often required at the onset of a new project to generate a reliable, nonbiased model for initiating refinement of particle origin and orientation parameters. If the head essentially has icosahedral symmetry (i.e., neglecting the presence of the tail), the random model method (Yan et al., 2007a) provides a relatively straightforward means to obtain a suitable starting model. To this then, one can either graft to one vertex of the icosahedral reconstruction an available reconstructed density map of the tail (Lander et al., 2006) or a very simple, cylindrically averaged 3D model constructed from the image of a single, clearly visible tail (Jiang et al., 2006). Even though the tail in the latter instance would not have the correct rotational symmetry, it is good enough to jump start refinement.
Because the φ29 head has a prolate rather than isometric shape, the random model method could not be used to generate a starting model for the reconstruction process. However, we were able to use the φ29 prohead structure (Morais et al., 2005) as a starting model for the head of the mature phage since the two are similar in size and shape and both have fivefold axial symmetry (Fig. 7.3A).
Figure 7.3.
Starting model for phage head and connector. (A) Shaded surface representation of φ29 prohead map used as the starting point for the reconstruction of the complete phage. (B) Initial, fivefold averaged phage reconstruction obtained with tightly boxed particle images (blue circles, Fig. 7.2). Fivefold averaging yields clearly defined features in the head but features of the connector and tail are smeared out.
3.1. Fivefold, symmetrized model of φ29 head
The first 3D reconstruction of the head and truncated tail was obtained by combining all the tightly boxed particle images (Section 2.1) and imposing fivefold axial symmetry in EMAN. Then, as described in Sections 2.1 and 2.2, we obtained a series of four phage reconstructions that progressively encompassed more of the tail (Fig. 7.3B) and ultimately included the entire phage (Fig. 7.4A).
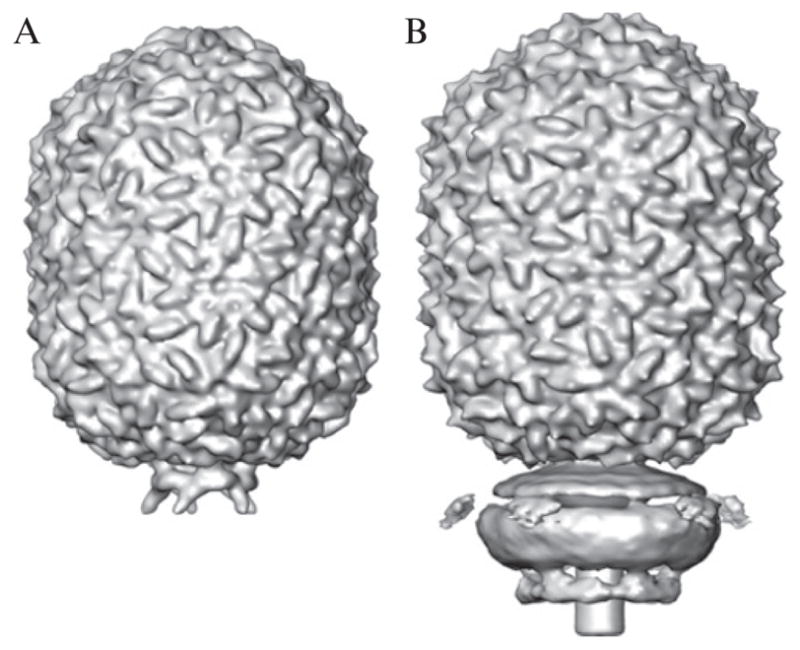
Figure 7.4.

Construction of asymmetric, hybrid model. (A) Shaded surface representation of complete phage reconstruction with fivefold symmetry enforced during processing. (B) Same as (A) for phage with 12-fold symmetry. Since the head and tail do not share the same symmetry, these reconstructions smear out the tail and head densities in panels (A) and (B), respectively. (C) Hybrid model obtained by combining head from fivefold reconstruction and tail from 12-fold reconstruction. Colors in the hybrid map highlight contributions from the two symmetrized maps. At this point the symmetry mismatch between the head and tail was unknown and no effort was made to impose a particular rotational alignment between the two segments.
3.2. Hybrid head–tail model of φ29
Given that the capsid portion of the φ29 head has fivefold rotational symmetry, its structure was preserved in all of the fivefold averaged reconstructions generated as just described (Section 3.1). There is ample evidence that the connectors and tail portions of all tailed bacteriophage, including φ29, do not possess fivefold symmetry like the capsids (Jiang et al., 2006; Lander et al., 2006; Xiang et al., 2006). The presence of a head–tail symmetry mismatch was also evident in the fivefold averaged φ29 reconstruction since features in the head were more distinct and not smeared as in the tail (Fig. 7.4A). The entire neck and tail of φ29 was shown to have quasi-six-fold symmetry (Peterson et al., 2001) and the existence of 12 distinct appendages was revealed in some of the very earliest electron micrographs of negatively stained phage (Anderson et al., 1966). Hence, to establish the rotational symmetry, if any, in the structure of the φ29 tail, we used EMAN to recompute the phage reconstruction with imposed three-, six-, and 12-fold symmetries instead of fivefold. Inspection of these three reconstructions showed, as expected, a smeared capsid structure but tails with features more distinct than in the fivefold averaged map. This strategy works since the head portions of the images have an equally poor agreement with all projections of the model and the assignment of particle orientations becomes influenced most by the tail structure. In addition, the ring of appendages near the head–tail junction appeared most distinct in the 12-fold symmetrized map (Fig. 7.4B).
At this point we constructed a hybrid model in the following way. We used the subregion selection tool in Chimera (Pettersen et al., 2004) to segment out the fivefold symmetrized head portion of the first reconstruction (Fig. 7.4A) and the 12-fold symmetrized tail portion of the second reconstruction (Fig. 7.4B). These separately segmented volumes were then combined into a single, hybrid density map (Fig. 7.4C). No attempt was made to impose any particular rotational alignment of the tail and head segmented maps in constructing the hybrid model. Regardless, the exact same hybrid model was used to produce the final virion and ghost φ29 reconstructions, which have tail structures that differ in several ways including the asymmetric arrangements of appendage conformations that break the 12-fold axial symmetry present in the hybrid model (Tang et al., 2008b).
4. Asymmetric Reconstruction of the Entire φ29 Phage
A hybrid density map generated from full resolution image data was used as input to the second branch of the reconstruction scheme (Fig. 7.1), which began with two cycles of refinement carried out in EMAN. This produced an asymmetric reconstruction of the virion at ~30-Å resolution. At this point, the use of unbinned data and the abandonment of symmetry averaging led to no further improvement in resolution and resulted in significant computational overhead. This failure to reach higher resolutions does not imply there are limitations in the capabilities of EMAN, but more likely reflects our own lack of expertise with the software.
Our group has developed a set of programs as part of AUTO3DEM that can be run efficiently on computer clusters and other parallel computers (Yan et al., 2007b). Most of the underlying programs were designed to handle cyclic, dihedral, and cubic point group symmetries, but the global search procedure implemented in PPFT is strictly only applicable to spherical particles since it requires particle images and projections of the maps to be reinterpolated into a series of concentric, circular annuli. We then turned to FREALIGN (Grigorieff, 2007) to initiate a refinement process that could be transitioned relatively easily to AUTO3DEM.
4.1. Origin and orientation determination and refinement with FREALIGN
The version of FREALIGN available at the time this work on φ29 was being performed required that the particle images be combined in a single stack file. Hence, particle images were first converted from IMAGIC to MRC format using the EMAN proc2d command. Also, to accommodate FREALIGN requirements, the MRC image file header was converted with the MRC program image_convert.exe.
The final map generated from EMAN was used as input to FREALIGN, which provides several modes of operation. We used its global search procedure (Mode 3) to assign initial origin and orientation parameters for each particle image. Also, the matching projection function was enabled to produce side-by-side comparisons of particle images and corresponding projections of the current reconstruction. This was carried out for the entire data set of images and, though somewhat tedious, gave a useful way to validate the assigned orientation parameters and to detect and screen out potentially “bad” particles that failed to align properly to the model.
The accuracy of the particle origins and orientations was further verified because the resultant cryo-reconstruction computed from the particle images with these assigned parameters had distinct, easily interpretable features. This was followed by standard refinement and map calculation in FREALIGN (Mode 1) for several more cycles (Fig. 7.1). The asymmetric reconstruction of the entire phage that emerged from this procedure reached a resolution of ~25 Å. Here, we had ample confidence in the current set of assigned origin and orientation parameters to carry out further processing steps with AUTO3DEM.
4.2. Origin and orientation refinement in AUTO3DEM
After obtaining estimates of the origins and orientations of all particles and a reliable 3D model of the entire phage with FREALIGN, we switched to AUTO3DEM for subsequent processing. AUTO3DEM runs in either serial or distributed-memory parallel mode and hence, access to a computer cluster can lead to a dramatic improvement in algorithm performance and significantly reduced computation time. The program PO2R (Ji et al., 2006) in AUTO3DEM carries out the Fourier-based origin and orientation refinement process, and program P3DR (Marinescu and Ji, 2003) computes the 3D density map from a selected (“best”) set of particle images. Both programs can be run with or without symmetry constraints and hence are suitable for analysis of asymmetric particles like φ29.
FREALIGN uses an Euler angle convention (θe, φe, ψe) to specify particle orientation, whereas AUTO3DEM uses the (θa, φa, ωa) convention first described by Finch and Klug (Finch and Klug, 1965) and implemented in the original icosahedral processing programs developed by Crowther (Crowther et al., 1970). We employed the following relationships to convert orientation parameters from the FREALIGN convention to that used in AUTO3DEM:
Once the above conversions were made, we employed the full capabilities of AUTO3DEM refinement to help improve the asymmetric reconstruction of φ29 as much as possible with the set of images that were available. AUTO3DEM works to progressively improve the resolution of any reconstruction by automatically optimizing numerous refinement parameters. For example, the images are typically band-pass filtered in Fourier space to limit the data used in comparing images to model projections. The upper Fourier limit (i.e., highest spatial frequency) included in the next cycle of refinement calculations is slowly increased as long as the resulting reconstruction shows improvement over the previous one. Improvement can be monitored in a variety of ways, but typically includes conventional Fourier shell correlation procedures (van Heel and Schatz, 2005). Other important parameters adjusted automatically by AUTO3DEM or manually by the user include the step sizes used to define the range of origin and orientation parameters to be tested. Typically, the origin and orientation intervals start out at about 1.0 pixel and 1–2°, respectively, and these are generally reduced when refinement stalls (i.e., no longer yields improvement in reconstruction resolution). At the end of refinement the origin and orientation step sizes might drop to 0.1 pixel and 0.1°, respectively. At even smaller step sizes, the process can lead to over-refinement and unreliable resolution estimates, as the noise in the data can drive refinement (Stewart and Grigorieff, 2004).
Another empirical parameter that we employed with some success is use of the inverse temperature factor (Fernandez et al., 2008; Havelka et al., 1995) to enhance high spatial frequency details in the reconstruction and during particle refinement (Tang et al., 2008a). We generally did not make use of this strategy until the reconstructed density map reached about 10–12 Å resolution, at which point an initial inverse temperature factor of 1/100 Å−2 would be employed during refinement. As refinement progressed and the resolution improved, the sharpening factor would be increased progressively to about 1/400 Å−2. It proved important, if not essential, to carefully inspect the 3D density map calculated at the end of each refinement cycle to ensure that the signal-to-noise of reliably represented features (e.g., tubes of density ascribed to α-helices) did not decrease as this would signify the refinement was being driven by the dominant, high frequency noise in the data. A carefully monitored, trial and error approach and inverse temperature factors even as low as 1/1200 Å −2 were used during the φ29 asymmetric refinement.
An additional strategy we used in the φ29 asymmetric reconstruction study was to mask out the genome density in the reconstructed density map, which is a method that typically improves the refinement of icosahedral viruses (Chen et al., 2009; Yan et al., 2007b; Zhang et al., 2008). This procedure leads to enhancement of reliably represented features in the projected images of the model and improves the accuracy in determining particle parameters. In a similar manner, we used with some success a density threshold procedure to remove some of the more obvious, random noise in the reconstructed φ29 density map. In density maps of icosahedral viruses computed from thousands or more particle images, the noise level outside the particle is generally quite low owing to the benefits of the 60-fold symmetry averaging that is an inherent part of the 3D reconstruction process. Hence, in an asymmetric reconstruction computed from a comparable number of particle images, the average noise level is significantly higher throughout the map. We tried a number of different masking and threshold procedures to zero noise outside the outer envelope of the phage particle. These are akin to solvent flattening used during the phase extension step in X-ray crystallographic studies (Wang, 1985). The technique that worked best in this instance involved the following steps. A second map was first recalculated at a lower resolution, typically about 20 Å. The two maps were then read into Chimera, which could take the low-resolution map and define a surface that enclosed the final, sub-nanometer resolution map. The Chimera mask tool was used to set values of all voxels that lie outside the defined surface to zero. This provided an additional enhancement of the signal-to-noise in the projections of the model used to correlate with the raw particle images for refinement of their parameters.
5. Analysis and Interpretation of φ29 Reconstruction
Careful analysis and interpretation of a reconstruction are critical for understanding the biology of the viral system, and these also help guide the refinement process by distinguishing genuine structural features from the noise. The availability of X-ray crystallographic data for individual components is particularly valuable as it helps in validating the reliability of the cryo-reconstruction, determining the significance of various structural features, and defining the boundaries between individual viral components.
5.1. Model docking
Fitting X-ray crystal structures into cryo-TEM reconstructions to produce pseudoatomic models of macromolecular complexes has become a powerful tool in the arsenal of analysis procedures ever since it was first introduced in studies of viruses (Stewart et al., 1993), virus–antibody (Smith et al., 1993; Wang et al., 1992) and virus–receptor (Olson et al., 1993) complexes, and acto-myosin filaments (Rayment et al., 1993). While useful for a wide variety of macromolecular systems, the combination of cryo-TEM and X-ray crystallographic structures can have a particularly profound impact on the study of tailed phages for two main reasons. First, owing to their shape and size, intact tailed phages resist crystallization and this will likely continue to thwart attempts at obtaining diffraction quality single crystals of a complete asymmetric phage. Second, the head–tail symmetry mismatch precludes the imposition of any symmetry and hence limits the resolutions that can be achieved. The docking of X-ray models of individual phage components into cryo-reconstructions currently offers the best means for obtaining a pseudoatomic model of the complete phage.
If an X-ray structure of a viral component is available, it is generally a relatively straightforward procedure to dock the atomic model manually into the reconstructed density map using a variety of interactive programs such as O (Jones et al., 1991), COOT (Emsley and Cowtan, 2004), and Chimera (Pettersen et al., 2004). After obtaining a reasonable fit of model to density via manual procedures, one can then quantitatively refine the fit by translating and rotating the atomic model as a rigid body until the correlation coefficient between the model and density map is maximized. This can be accomplished in numerous programs such as RSREF (Chapman, 1995), SITUS (Wriggers and Birmanns, 2001), EMfit (Rossmann et al., 2001), CoAn (Volkmann and Hanein, 2003), and Chimera (Pettersen et al., 2004).
Rigid body docking of the φ29 connector (gp10) crystal structure (Guasch et al., 2002) into reconstructions of the prohead, ghost, and mature virion shows that the top of the connector fits well into the cryo-TEM density in all three cases, but the lower portion of the connector only fits well into the prohead (Fig. 7.5). Ghosts and virions both contain additional proteins that were added sequentially during assembly onto the bottom of the connector to create a functional tail, and it is clear from the rigid body fits that the attachment of the tail and packaging of the genome induce conformational changes in the connector. At the time of this study (Tang et al., 2008b), the existing software was not capable of modifying the crystal structure to better fit the density.
Figure 7.5.
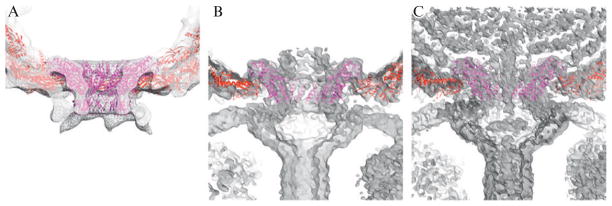
Rigid body fit of gp10 connector crystal structure (magenta ribbon model) and gp8 capsid subunit homology model (red), into φ29 density maps (gray). The top portion of the connector fits well into the prohead (A), ghost (B), and virion (C) reconstructions, whereas the lower portion only fits well into the prohead.
Flexible fitting methods have been developed to permit models to be modified in various ways to achieve better fits to the cryo-TEM density. Several software packages such as NMFF (normal mode flexible fitting; Tama et al., 2004), DireX (Schroder et al., 2007), and Flex-EM (Topf et al., 2008) sample the conformational space of the crystal structure to improve the fit. Molecular dynamics based packages such as MDFF (molecular dynamics flexible fitting; Trabuco et al., 2008) adjust the crystal structure in a physically reasonable way and even show a potential trajectory between conformations.
All fitting methods are particularly powerful when models are available for the entire reconstructed density, but become problematic when the densities from multiple components overlap to form a larger, more complex shape. This situation occurs in φ29 where gp10 interacts with the capsid protein (gp8), the lower collar (gp11), and the appendages (gp12☆) as well as the genome.
5.2. Map segmentation
An important step in correctly interpreting a reconstructed density map is to identify the individual components and understand their interactions in the context of the macromolecular complex (Chapter 1, Vol. 483). Segmentation is the process by which the boundaries between components are defined (Chapter 2, Vol. 483) and success here directly depends on the quality and resolution of the map. Substructures with large, solvent accessible surfaces, and hence clear boundaries, are relatively easy to segment, whereas components with extensive interactions present a greater challenge. As described below, we employed three different techniques to isolate major components of the phage. These included (1) using X-ray structures to mask out regions of the density map, (2) using difference map calculations to identify particular viral components, and (3) manually segmenting out portions of the density map.
In our φ29 study, the connector crystal structure was first docked into the phage reconstruction and the Chimera mask operation was then used to segment out the connector portion of the density map. A crystal structure of the φ29 capsid protein was not available, but a pseudoatomic homology model derived from the X-ray structure of the capsid protein of HK97 phage (Wikoff et al., 2000) was used to segment the head density.
In instances where no molecular model is available, reliable segmentation of the components can sometimes be achieved by difference map analysis. For example, by subtracting the φ29 ghost density from the virion density we achieved a relatively unambiguous segmentation of the packaged DNA genome. Indeed, the difference map revealed the bulk DNA in the phage head and also highly organized, linear stretches of DNA above and inside the connector complex and inside the lower collar, and a unique, toroid-like DNA structure inside the cavity between the connector and collar (Tang et al., 2008b; Fig. 7.6). It is important to note that this segmentation technique only works if the two structures being compared by means of difference map analysis are essentially identical except for the absence or presence of the component of interest. If any conformational changes to the capsid had occurred as a consequence of genome release, these would also have appeared in the difference map and may have complicated the identification of the genome boundaries.
Figure 7.6.
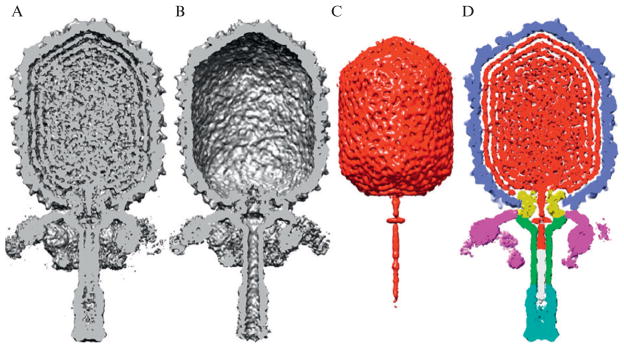
Segmentation of viral components in reconstructed phage density map. (A) Shaded surface representation of virion reconstruction with front half of map removed to reveal internal structure. (B) Same as (A) for ghost reconstruction. (C) Difference map obtained by subtracting ghost from virion contains density (red) attributed to dsDNA genome plus the terminal protein, gp3. (D) Segmented map of φ29 virion with components distinguished by color: capsid (gp8), light blue; connector (gp10), yellow; lower collar and tube (gp11), green; knob (gp9), cyan; appendages (gp12☆), magenta; terminal protein (gp3) covalently attached to right end of DNA, white; and DNA, red.
With the aid of an X-ray model for gp10 and a homology model for gp8, we were able to isolate the connector and capsid, and using difference maps we could clearly identify the bulk genome density. However, segmentation of other components proved to be a more challenging task. Computer algorithms have been developed to aid in the identification of secondary structural elements and automate feature-guided segmentation (Baker et al., 2006), but we were not successful in applying them to φ29. Certainly, limited resolution, noise, and the close proximity of multiple components could individually or collectively thwart attempts to segment the entire map in a definitive manner.
Based on knowledge of the φ29 tail structure from previous studies (Xiang et al., 2006), we were able to easily identify and manually segment those portions belonging to the 12 appendages (magenta in Fig. 7.6D). This was accomplished using the Chimera volume eraser tool to remove density defined by the user to be part of other components. After subtracting density corresponding to all of the components already identified and using an estimate of the molecular volume of the lower collar (gp11), we were able to define a plausible boundary between gp11 and the gp9 tail knob (green and cyan, respectively in Fig. 7.6D). Similarly, we defined an approximate boundary between the right end of the dsDNA and terminal protein (gp3) (red and white, respectively in Fig. 7.6D). Our application of three separate segmentation techniques as described above provided a complete picture of the overall organization of the phage components.
6. Summary and Future Prospects
The asymmetric tailed phages present a number of unique challenges for 3D image reconstruction. The reconstruction process is not nearly as straightforward as that employed for solving the structures of totally asymmetric particles or of highly symmetric particles. Although the entire phage lacks global symmetry, strategies that exploit the symmetries of the head and tail at an early stage of the reconstruction process, before transitioning to a fully asymmetric reconstruction, can improve the likelihood of success, expedite the process, and lead to a higher resolution final map. In our studies of φ29, the lower symmetry (fivefold) and nonspherical shape of the prolate head made it crucial that extra care be taken both in construction of a reliable head model and boxing of the particles from the micrographs. In our processing strategy, boxing was performed not just at the start of the project, but rather became an integral part of the reconstruction process and the particle images and phage map were gradually expanded and improved. Owing to the low signal-to-noise ratio from the lack of symmetry averaging, the particle refinement process became more intensive and the interpretation of the reconstruction also required more attention.
6.1. Streamlined processing
Our approach to solving the asymmetric structure at sub-nanometer resolution necessitated the use of multiple software packages. The choice of program at each step was based on our level of understanding of the various packages and their relative strengths and weaknesses. We found EMAN to be very good at starting a new project when faced with limited knowledge of the final structure. FREALIGN contains a valuable feature to validate the initial assignment of particle orientations. The computational speed of AUTO3DEM enabled us to rapidly test a large number of reconstruction parameters and finish the refinement in a timely fashion. The drawback in employing multiple software packages was that extreme care had to be taken when transitioning between programs, particularly with respect to file formats and image orientation conventions.
AUTO3DEM is currently being enhanced so it can be used for all steps of the asymmetric reconstruction process. Recent releases of this software have been modified so that a global orientation search can be performed entirely in reciprocal space, but this feature has been used primarily to improve icosahedral reconstructions and remains untested for analysis of images of asymmetric particles. We have also added the capability to compare the 60 equivalent orientations related by icosahedral symmetry. This functionality was originally implemented to study nonstoichiometric binding of antibodies to icosahedral capsids, but could also be used to identify the unique vertices of otherwise isometric particles such as P22 (Lander et al., 2006) and PBCV-1 (Cherrier et al., 2009). Our study of φ29 illustrated the importance of using an inverse temperature factor during the refinement process. Currently the choice of value is empirical and the resultant map must be visually inspected to determine whether the quality of the map increased or decreased. In the future, we hope to develop automated techniques for assessing map quality and allow AUTO3DEM to choose the optimal inverse temperature factor at each step of the reconstruction process.
6.2. Development of smart masking
Given the elongated shape of φ29, boxing out particles using a circular mask results in the inclusion of much unwanted background and often portions of neighboring particles. Elliptical or ovoid masks that more tightly follow the particle boundaries would help remedy some of the shortcomings of circular masks. Also, the technique used in EMAN, in which masks are individually tailored to the particles, seems a promising approach to adopt. In this scheme, initial boxing would still be performed with a circular mask, but particle images would then be reboxed using masks derived from the projections of the models that agree most closely with the images. Regardless of which advanced boxing method is employed, tighter masking should help enhance the signal-to-noise ratio that is inherently poor in asymmetric reconstructions. This also might, in turn, lead to higher resolution.
6.3. Future prospects
Tremendous progress has been made in the cryo-reconstruction of tailed phages in recent years. Indeed, the first report of a 3D reconstruction of a complete phage at sub-nanometer resolution followed less than a decade after the original one at 33-Å resolution was published (Table 7.1). Notwithstanding that considerably higher resolutions are now routinely achieved for icosahedral viruses (Zhou, 2008), the progress made in reconstructing the 3D asymmetric structures of whole phage like φ29 sets the stage for even greater achievements in the near future. These of course will enable mechanistic questions concerning phage structure to be answered that currently cannot be addressed at moderate resolutions in the 7–10 Å realm.
An obvious bottleneck is the large amount of data needed for asymmetric reconstructions. Assuming everything else is equivalent (e.g., specimen stability, microscope conditions, accuracy in determining particle parameters, etc.), at least 60 times more particle images are needed to achieve a resolution comparable to that obtained with images of icosahedral particles. Fortunately, tools for automatic data collection such as LEGINON (Suloway et al., 2005) and automatic data processing such as APPION (Lander et al., 2009) are being developed to record and handle large numbers of particle images and to determine microscopy conditions such as objective lens defocus and astigmatism. In addition, advances in microscopy and image processing that have recently led to near-atomic resolution icosahedral reconstructions will undoubtedly help pave the way to achieve higher resolutions in asymmetric virus reconstructions.
In this chapter, we described a set of techniques that we used to solve the structures of fiberless φ29 virions and ghosts to sub-nanometer resolutions (Tang et al., 2008b). These methods should be readily applicable to other tailed phages and, with relatively minor modifications, other asymmetric macromolecules that possess high degrees of local symmetry. This marks just one step in the quest to achieve atomic or near-atomic resolution cryo-reconstructions of asymmetric particles through a combination of improvements in sample preparation and microscopy, and in image processing, particle selection, interpretation, and visualization algorithms.
Acknowledgments
We thank D. Anderson, S. Grimes, and P. Jardine for their sustained enthusiasm about structure-function studies of φ29. We also thank numerous other colleagues for their inspiration and perspiration in helping to unravel the 3D structure of φ29 (N. Olson, W. Xu, W. Grochulski, Y. Tao, A. Simpson, M. Rossmann, M. Morais, and M. Sherman). The work reported in this chapter was supported in part by NIH grant R37 GM-033050, NSF shared instrument grant BIR-9112921, the University of California, San Diego, and a gift from the Agouron foundation (all to T.S.B.).
References
- Agirrezabala X, Martín-Benito J, Castón JR, Miranda R, Valpuesta JM, Carrascosa JL. Maturation of phage T7 involves structural modification of both shell and inner core components. EMBO J. 2005;24:3820–3829. doi: 10.1038/sj.emboj.7600840. [DOI] [PMC free article] [PubMed] [Google Scholar]
- Anderson DL, Hickman DD, Reilly BE. Structure of Bacillus subtilis bacteriophage φ29 and the length of φ29 deoxyribonucleic acid. J Bacteriol. 1966;91:2081–2089. doi: 10.1128/jb.91.5.2081-2089.1966. [DOI] [PMC free article] [PubMed] [Google Scholar]
- Baker ML, Yu Z, Chiu W, Bajaj C. Automated segmentation of molecular subunits in electron cryomicroscopy density maps. J Struct Biol. 2006;156:432–441. doi: 10.1016/j.jsb.2006.05.013. [DOI] [PubMed] [Google Scholar]
- Baker TS, Cheng RH. A model-based approach for determining orientations of biological macromolecules imaged by cryoelectron microscopy. J Struct Biol. 1996;116:120–130. doi: 10.1006/jsbi.1996.0020. [DOI] [PubMed] [Google Scholar]
- Baker TS, Olson NH, Fuller SD. Adding the third dimension to virus life cycles: Three-dimensional reconstruction of icosahedral viruses from cryo-electron micrographs. Microbiol Mol Biol Rev. 1999;63:862–922. doi: 10.1128/mmbr.63.4.862-922.1999. [DOI] [PMC free article] [PubMed] [Google Scholar]
- Bubeck D, Filman DJ, Kuzmin M, Fuller SD, Hogle JM. Post-imaging fiducial markers aid in the orientation determination of complexes with mixed or unknown symmetry. J Struct Biol. 2008;162:480–490. doi: 10.1016/j.jsb.2008.03.006. [DOI] [PMC free article] [PubMed] [Google Scholar]
- Chang J, Weigele P, King J, Chiu W, Jiang W. Cryo-EM asymmetric reconstruction of bacteriophage P22 reveals organization of its DNA packaging and infecting machinery. Structure. 2006;14:1073–1082. doi: 10.1016/j.str.2006.05.007. [DOI] [PubMed] [Google Scholar]
- Chapman MS. Restrained real-space macromolecular atomic refinement using a new resolution-dependent electron density function. Acta Crystallogr A. 1995;51:69–80. [Google Scholar]
- Chen JZ, Settembre EC, Aoki ST, Zhang X, Bellamy AR, Dormitzer PR, Harrison SC, Grigorieff N. Molecular interactions in rotavirus assembly and uncoating seen by high-resolution cryo-EM. Proc Natl Acad Sci USA. 2009;106:10644–10648. doi: 10.1073/pnas.0904024106. [DOI] [PMC free article] [PubMed] [Google Scholar]
- Cheng Y, Walz T. The advent of near-atomic resolution in single-particle electron microscopy. Annu Rev Biochem. 2009;78:723–742. doi: 10.1146/annurev.biochem.78.070507.140543. [DOI] [PubMed] [Google Scholar]
- Cherrier MV, Kostyuchenko VA, Xiao C, Bowman VD, Battisti AJ, Yan X, Chipman PR, Baker TS, Van Etten JL, Rossmann MG. An icosahedral algal virus has a complex unique vertex decorated by a spike. Proc Natl Acad Sci USA. 2009;106:11085–11089. doi: 10.1073/pnas.0904716106. [DOI] [PMC free article] [PubMed] [Google Scholar]
- Choi KH, McPartland J, Kaganman I, Bowman VD, Rothman-Denes LB, Rossmann MG. Insight into DNA and protein transport in double-stranded DNA viruses: the structure of bacteriophage N4. J Mol Biol. 2008;378:726–736. doi: 10.1016/j.jmb.2008.02.059. [DOI] [PMC free article] [PubMed] [Google Scholar]
- Crowther RA, Amos LA, Finch JT, De Rosier DJ, Klug A. Three dimensional reconstructions of spherical viruses by Fourier synthesis from electron micrographs. Nature. 1970;226:421–425. doi: 10.1038/226421a0. [DOI] [PubMed] [Google Scholar]
- DeRosier D, Klug A. Reconstruction of three dimensional structures from electron micrographs. Nature. 1968;217:130–134. doi: 10.1038/217130a0. [DOI] [PubMed] [Google Scholar]
- Emsley P, Cowtan K. Coot: Model-building tools for molecular graphics. Acta Crystallogr D Biol Crystallogr. 2004;60:2126–2132. doi: 10.1107/S0907444904019158. [DOI] [PubMed] [Google Scholar]
- Fernandez JJ, Luque D, Caston JR, Carrascosa JL. Sharpening high resolution information in single particle electron cryomicroscopy. J Struct Biol. 2008;164:170–175. doi: 10.1016/j.jsb.2008.05.010. [DOI] [PubMed] [Google Scholar]
- Finch JT, Klug A. The structure of viruses of the papilloma-polyoma type 3. Structure of rabbit papilloma virus, with an appendix on the topography of contrast in negative-staining for electron-microscopy. J Mol Biol. 1965;13:1–12. doi: 10.1016/s0022-2836(65)80075-4. [DOI] [PubMed] [Google Scholar]
- Fokine A, Chipman PR, Leiman PG, Mesyanzhinov VV, Rao VB, Rossmann MG. Molecular architecture of the prolate head of bacteriophage T4. Proc Natl Acad Sci USA. 2004;101:6003–6008. doi: 10.1073/pnas.0400444101. [DOI] [PMC free article] [PubMed] [Google Scholar]
- Frank J. Single-particle reconstruction of biological macromolecules in electron microscopy–30 years. Q Rev Biophys. 2009;42:139–158. doi: 10.1017/S0033583509990059. [DOI] [PMC free article] [PubMed] [Google Scholar]
- Frank J, Radermacher M, Penczek P, Zhu J, Li Y, Ladjadj M, Leith A. SPIDER and WEB: Processing and visualization of images in 3D electron microscopy and related fields. J Struct Biol. 1996;116:190–199. doi: 10.1006/jsbi.1996.0030. [DOI] [PubMed] [Google Scholar]
- Grigorieff N. FREALIGN: High-resolution refinement of single particle structures. J Struct Biol. 2007;157:117–125. doi: 10.1016/j.jsb.2006.05.004. [DOI] [PubMed] [Google Scholar]
- Guasch A, Pous J, Ibarra B, Gomis-Ruth FX, Valpuesta JM, Sousa N, Carrascosa JL, Coll M. Detailed architecture of a DNA translocating machine: the high-resolution structure of the bacteriophage φ29 connector particle. J Mol Biol. 2002;315:663–676. doi: 10.1006/jmbi.2001.5278. [DOI] [PubMed] [Google Scholar]
- Gurda BL, Parent KN, Bladek H, Sinkovits RS, Dimattia MA, Rence C, Castro A, McKenna R, Olson N, Brown K, Baker TS, Agbandje-McKenna M. Human bocavirus capsid structure: Insights into the structural repertoire of the parvoviridae. J Virol. 2010;84:5880–5889. doi: 10.1128/JVI.02719-09. [DOI] [PMC free article] [PubMed] [Google Scholar]
- Havelka WA, Henderson R, Oesterhelt D. Three-dimensional structure of halorhodopsin at 7 Å resolution. J Mol Biol. 1995;247:726–738. doi: 10.1006/jmbi.1995.0176. [DOI] [PubMed] [Google Scholar]
- Heymann JB. Bsoft: Image and molecular processing in electron microscopy. J Struct Biol. 2001;133:156–169. doi: 10.1006/jsbi.2001.4339. [DOI] [PubMed] [Google Scholar]
- Ji Y, Marinescu DC, Zhang W, Zhang X, Yan X, Baker TS. A model-based parallel origin and orientation refinement algorithm for cryoTEM and its application to the study of virus structures. J Struct Biol. 2006;154:1–19. doi: 10.1016/j.jsb.2005.06.009. [DOI] [PMC free article] [PubMed] [Google Scholar]
- Jiang W, Chang J, Jakana J, Weigele P, King J, Chiu W. Structure of epsilon15 bacteriophage reveals genome organization and DNA packaging/injection apparatus. Nature. 2006;439:612–616. doi: 10.1038/nature04487. [DOI] [PMC free article] [PubMed] [Google Scholar]
- Johnson JE, Chiu W. DNA packaging and delivery machines in tailed bacteriophages. Curr Opin Struct Biol. 2007;17:237–243. doi: 10.1016/j.sbi.2007.03.011. [DOI] [PubMed] [Google Scholar]
- Jones TA, Zou JY, Cowan SW, Kjeldgaard M. Improved methods for building protein models in electron density maps and the location of errors in these models. Acta Crystallogr A. 1991;47(Pt 2):110–119. doi: 10.1107/s0108767390010224. [DOI] [PubMed] [Google Scholar]
- Jonic S, Sorzano CO, Boisset N. Comparison of single-particle analysis and electron tomography approaches: An overview. J Microsc. 2008;232:562–579. doi: 10.1111/j.1365-2818.2008.02119.x. [DOI] [PubMed] [Google Scholar]
- Kostyuchenko VA, Chipman PR, Leiman PG, Arisaka F, Mesyanzhinov VV, Rossmann MG. The tail structure of bacteriophage T4 and its mechanism of contraction. Nat Struct Mol Biol. 2005;12:810–813. doi: 10.1038/nsmb975. [DOI] [PubMed] [Google Scholar]
- Lander GC, Stagg SM, Voss NR, Cheng A, Fellmann D, Pulokas J, Yoshioka C, Irving C, Mulder A, Lau PW, Lyumkis D, Potter CS, Carragher B. Appion: An integrated, database-driven pipeline to facilitate EM image processing. J Struct Biol. 2009;166:95–102. doi: 10.1016/j.jsb.2009.01.002. [DOI] [PMC free article] [PubMed] [Google Scholar]
- Lander GC, Tang L, Casjens SR, Gilcrease EB, Prevelige P, Poliakov A, Potter CS, Carragher B, Johnson JE. The structure of an infectious P22 virion shows the signal for headful DNA packaging. Science. 2006;312:1791–1795. doi: 10.1126/science.1127981. [DOI] [PubMed] [Google Scholar]
- Ludtke SJ, Baldwin PR, Chiu W. EMAN: Semiautomated software for high-resolution single-particle reconstructions. J Struct Biol. 1999;128:82–97. doi: 10.1006/jsbi.1999.4174. [DOI] [PubMed] [Google Scholar]
- Marinescu DC, Ji Y. A computational framework for the 3D structure determination of viruses with unknown symmetry. J Parallel Distrib Comput. 2003;63:738–758. [Google Scholar]
- Morais MC, Choi KH, Koti JS, Chipman PR, Anderson DL, Rossmann MG. Conservation of the capsid structure in tailed dsDNA bacteriophages: The pseudoatomic structure of φ29. Mol Cell. 2005;18:149–159. doi: 10.1016/j.molcel.2005.03.013. [DOI] [PubMed] [Google Scholar]
- Morais MC, Tao Y, Olson NH, Grimes S, Jardine PJ, Anderson DL, Baker TS, Rossmann MG. Cryoelectron-microscopy image reconstruction of symmetry mismatches in bacteriophage φ29. J Struct Biol. 2001;135:38–46. doi: 10.1006/jsbi.2001.4379. [DOI] [PMC free article] [PubMed] [Google Scholar]
- Olson NH, Kolatkar PR, Oliveira MA, Cheng RH, Greve JM, McClelland A, Baker TS, Rossmann MG. Structure of a human rhinovirus complexed with its receptor molecule. Proc Natl Acad Sci USA. 1993;90:507–511. doi: 10.1073/pnas.90.2.507. [DOI] [PMC free article] [PubMed] [Google Scholar]
- Peterson C, Simon M, Hodges J, Mertens P, Higgins L, Egelman E, Anderson D. Composition and mass of the bacteriophage φ29 prohead and virion. J Struct Biol. 2001;135:18–25. doi: 10.1006/jsbi.2001.4375. [DOI] [PubMed] [Google Scholar]
- Pettersen EF, Goddard TD, Huang CC, Couch GS, Greenblatt DM, Meng EC, Ferrin TE. UCSF Chimera–a visualization system for exploratory research and analysis. J Comput Chem. 2004;25:1605–1612. doi: 10.1002/jcc.20084. [DOI] [PubMed] [Google Scholar]
- Rayment I, Holden HM, Whittaker M, Yohn CB, Lorenz M, Holmes KC, Milligan RA. Structure of the actin-myosin complex and its implications for muscle contraction. Science. 1993;261:58–65. doi: 10.1126/science.8316858. [DOI] [PubMed] [Google Scholar]
- Rosenthal PB, Henderson R. Optimal determination of particle orientation, absolute hand, and contrast loss in single-particle electron cryomicroscopy. J Mol Biol. 2003;333:721–745. doi: 10.1016/j.jmb.2003.07.013. [DOI] [PubMed] [Google Scholar]
- Rossmann MG, Bernal R, Pletnev SV. Combining electron microscopic with X-ray crystallographic structures. J Struct Biol. 2001;136:190–200. doi: 10.1006/jsbi.2002.4435. [DOI] [PubMed] [Google Scholar]
- Schroder GF, Brunger AT, Levitt M. Combining efficient conformational sampling with a deformable elastic network model facilitates structure refinement at low resolution. Structure. 2007;15:1630–1641. doi: 10.1016/j.str.2007.09.021. [DOI] [PMC free article] [PubMed] [Google Scholar]
- Smith TJ. Structural studies on antibody–virus complexes. Adv Protein Chem. 2003;64:409–453. doi: 10.1016/s0065-3233(03)01012-x. [DOI] [PubMed] [Google Scholar]
- Smith TJ, Olson NH, Cheng RH, Chase ES, Baker TS. Structure of a human rhinovirus-bivalently bound antibody complex: Implications for viral neutralization and antibody flexibility. Proc Natl Acad Sci USA. 1993;90:7015–7018. doi: 10.1073/pnas.90.15.7015. [DOI] [PMC free article] [PubMed] [Google Scholar]
- Sorzano CO, Marabini R, Velazquez-Muriel J, Bilbao-Castro JR, Scheres SH, Carazo JM, Pascual-Montano A. XMIPP: A new generation of an open-source image processing package for electron microscopy. J Struct Biol. 2004;148:194–204. doi: 10.1016/j.jsb.2004.06.006. [DOI] [PubMed] [Google Scholar]
- Steven AC, Heymann JB, Cheng N, Trus BL, Conway JF. Virus maturation: Dynamics and mechanism of a stabilizing structural transition that leads to infectivity. Curr Opin Struct Biol. 2005;15:227–236. doi: 10.1016/j.sbi.2005.03.008. [DOI] [PMC free article] [PubMed] [Google Scholar]
- Stewart A, Grigorieff N. Noise bias in the refinement of structures derived from single particles. Ultramicroscopy. 2004;102:67–84. doi: 10.1016/j.ultramic.2004.08.008. [DOI] [PubMed] [Google Scholar]
- Stewart PL, Dermody TS, Nemerow GR. Structural basis of none-nveloped virus cell entry. Adv Protein Chem. 2003;64:455–491. doi: 10.1016/s0065-3233(03)01013-1. [DOI] [PubMed] [Google Scholar]
- Stewart PL, Fuller SD, Burnett RM. Difference imaging of adenovirus: Bridging the resolution gap between X-ray crystallography and electron microscopy. EMBO J. 1993;12:2589–2599. doi: 10.1002/j.1460-2075.1993.tb05919.x. [DOI] [PMC free article] [PubMed] [Google Scholar]
- Suloway C, Pulokas J, Fellmann D, Cheng A, Guerra F, Quispe J, Stagg S, Potter CS, Carragher B. Automated molecular microscopy: The new Leginon system. J Struct Biol. 2005;151:41–60. doi: 10.1016/j.jsb.2005.03.010. [DOI] [PubMed] [Google Scholar]
- Tama F, Miyashita O, Brooks CL., 3rd Normal mode based flexible fitting of high-resolution structure into low-resolution experimental data from cryo-EM. J Struct Biol. 2004;147:315–326. doi: 10.1016/j.jsb.2004.03.002. [DOI] [PubMed] [Google Scholar]
- Tang J, Ochoa WF, Sinkovits RS, Poulos BT, Ghabrial SA, Lightner DV, Baker TS, Nibert ML. Infectious myonecrosis virus has a totivirus-like, 120-subunit capsid, but with fiber complexes at the fivefold axes. Proc Natl Acad Sci USA. 2008a;105:17526–17531. doi: 10.1073/pnas.0806724105. [DOI] [PMC free article] [PubMed] [Google Scholar]
- Tang J, Olson N, Jardine PJ, Grimes S, Anderson DL, Baker TS. DNA poised for release in bacteriophage φ29. Structure. 2008b;16:935–943. doi: 10.1016/j.str.2008.02.024. [DOI] [PMC free article] [PubMed] [Google Scholar]
- Tao Y, Olson NH, Xu W, Anderson DL, Rossmann MG, Baker TS. Assembly of a tailed bacterial virus and its genome release studied in three dimensions. Cell. 1998;95:431–437. doi: 10.1016/s0092-8674(00)81773-0. [DOI] [PMC free article] [PubMed] [Google Scholar]
- Topf M, Lasker K, Webb B, Wolfson H, Chiu W, Sali A. Protein structure fitting and refinement guided by cryo-EM density. Structure. 2008;16:295–307. doi: 10.1016/j.str.2007.11.016. [DOI] [PMC free article] [PubMed] [Google Scholar]
- Trabuco LG, Villa E, Mitra K, Frank J, Schulten K. Flexible fitting of atomic structures into electron microscopy maps using molecular dynamics. Structure. 2008;16:673–683. doi: 10.1016/j.str.2008.03.005. [DOI] [PMC free article] [PubMed] [Google Scholar]
- van Heel M, Schatz M. Fourier shell correlation threshold criteria. J Struct Biol. 2005;151:250–262. doi: 10.1016/j.jsb.2005.05.009. [DOI] [PubMed] [Google Scholar]
- Volkmann N, Hanein D. Docking of atomic models into reconstructions from electron microscopy. Methods Enzymol. 2003;374:204–225. doi: 10.1016/S0076-6879(03)74010-5. [DOI] [PubMed] [Google Scholar]
- Wang BC. Resolution of phase ambiguity in macromolecular crystallography. Methods Enzymol. 1985;115:90–112. doi: 10.1016/0076-6879(85)15009-3. [DOI] [PubMed] [Google Scholar]
- Wang GJ, Porta C, Chen ZG, Baker TS, Johnson JE. Identification of a Fab interaction footprint site on an icosahedral virus by cryoelectron microscopy and X-ray crystallography. Nature. 1992;355:275–278. doi: 10.1038/355275a0. [DOI] [PMC free article] [PubMed] [Google Scholar]
- Wikoff WR, Liljas L, Duda RL, Tsuruta H, Hendrix RW, Johnson JE. Topologically linked protein rings in the bacteriophage HK97 capsid. Science. 2000;289:2129–2133. doi: 10.1126/science.289.5487.2129. [DOI] [PubMed] [Google Scholar]
- Wolf M, Garcea RL, Grigorieff N, Harrison SC. Subunit interactions in bovine papillomavirus. Proc Natl Acad Sci USA. 2010;107:6298–6303. doi: 10.1073/pnas.0914604107. [DOI] [PMC free article] [PubMed] [Google Scholar]
- Wriggers W, Birmanns S. Using situs for flexible and rigid-body fitting of multiresolution single-molecule data. J Struct Biol. 2001;133:193–202. doi: 10.1006/jsbi.2000.4350. [DOI] [PubMed] [Google Scholar]
- Xiang Y, Morais MC, Battisti AJ, Grimes S, Jardine PJ, Anderson DL, Rossmann MG. Structural changes of bacteriophage φ29 upon DNA packaging and release. EMBO J. 2006;25:5229–5239. doi: 10.1038/sj.emboj.7601386. [DOI] [PMC free article] [PubMed] [Google Scholar]
- Yan X, Dryden KA, Tang J, Baker TS. Ab initio random model method facilitates 3D reconstruction of icosahedral particles. J Struct Biol. 2007a;157:211–225. doi: 10.1016/j.jsb.2006.07.013. [DOI] [PMC free article] [PubMed] [Google Scholar]
- Yan X, Sinkovits RS, Baker TS. AUTO3DEM–an automated and high throughput program for image reconstruction of icosahedral particles. J Struct Biol. 2007b;157:73–82. doi: 10.1016/j.jsb.2006.08.007. [DOI] [PMC free article] [PubMed] [Google Scholar]
- Zhang X, Jin L, Fang Q, Hui WH, Zhou ZH. 3.3 Å cryo-EM structure of a nonenveloped virus reveals a priming mechanism for cell entry. Cell. 2010;141:472–482. doi: 10.1016/j.cell.2010.03.041. [DOI] [PMC free article] [PubMed] [Google Scholar]
- Zhang X, Settembre E, Xu C, Dormitzer PR, Bellamy R, Harrison SC, Grigorieff N. Near-atomic resolution using electron cryomicroscopy and single-particle reconstruction. Proc Natl Acad Sci USA. 2008;105:1867–1872. doi: 10.1073/pnas.0711623105. [DOI] [PMC free article] [PubMed] [Google Scholar]
- Zhou ZH. Towards atomic resolution structural determination by single-particle cryo-electron microscopy. Curr Opin Struct Biol. 2008;18:218–228. doi: 10.1016/j.sbi.2008.03.004. [DOI] [PMC free article] [PubMed] [Google Scholar]