

Abstract
Introduction
Seizures occur rarely during EEG-fMRI acquisitions of epilepsy patients, but can potentially offer a better estimation of the epileptogenic zone than interictal activity. Independent component analysis (ICA) is a data-driven method that imposes minimal constraints on the hemodynamic response function (HRF). In particular, the investigation of HRFs with clear peaks, but varying latency, may be used to differentiate the ictal focus from propagated activity.
Methods
ICA was applied on ictal EEG-fMRI data from 15 patients. Components related to seizures were identified by fitting an HRF to the component time courses at the time of the ictal EEG events. HRFs with a clear peak were used to derive maps of significant BOLD responses and their associated peak delay. The results were then compared with those obtained from a general linear model (GLM) method. Concordance with the presumed epileptogenic focus was also assessed.
Results
The ICA maps were significantly correlated with the GLM maps for each patient (Spearman’s test, p<0.05). The ictal BOLD responses identified by ICA always included the presumed epileptogenic zone, but were also more widespread, accounting for 20.3% of the brain volume on average. The method provided a classification of the components as a function of peak delay. BOLD response clusters associated with early HRF peaks were concordant with the suspected epileptogenic focus, while subsequent HRF peaks may correspond to ictal propagation.
Conclusion
ICA applied to EEG-fMRI can detect areas of significant BOLD response to ictal events without having to predefine an HRF. By estimating the HRF peak time in each identified region, the method could also potentially provide a dynamic analysis of ictal BOLD responses, distinguishing onset from propagated activity.
Keywords: Independent component analysis, EEG-fMRI, Epilepsy, Seizures, Hemodynamic response
Introduction
EEG-fMRI is a non-invasive technique which may be of particular interest in the presurgical evaluation of patients with intractable epilepsy (Zijlmans et al., 2007). In an attempt to delineate the irritative zone, initial studies have investigated BOLD responses to interictal epileptiform discharges (Aghakhani et al., 2006; Al Asmi et al., 2003; Federico et al., 2005a; Salek-Haddadi et al., 2006). However, the irritative zone is often widespread and does not always have a good correspondence with the epileptogenic zone, defined as the brain area whose resection can ensure a seizure-free outcome (Rosenow and Luders, 2001).
Recently, some EEG-fMRI studies have investigated the BOLD response to ictal discharges in patients with focal epilepsy (Di Bonaventura et al., 2006a; Kobayashi et al., 2006; Salek-Haddadi et al., 2002; Tyvaert et al., 2008). Due to the unpredictability of ictal events, patients are generally selected for an interictal investigation, with the occurrence of ictal events left to chance, although it is possible to target patients with frequent seizures (Di Bonaventura et al., 2006b; Federico et al., 2005b). Another difficulty with ictal investigations is the presence of motion often associated with seizures, as even minor movements may cause severe artifacts that may persist despite the application of motion correction algorithms (Lemieux et al., 2007). Therefore, ictal EEG-fMRI is only suitable for seizures that do not include any significant motion, although this requirement may be circumvented in studies that are only focused on pre-ictal fluctuations (Federico et al., 2005b).
Despite these difficulties, ictal EEG-fMRI provides a unique opportunity to track the electrical and hemodynamic spatio-temporal evolution of epileptic seizures. Previous studies have modeled the BOLD changes as a convolution of the EEG discharges with a canonical hemodynamic response function (HRF) in the general linear model (GLM) framework (Worsley et al., 2002; Worsley and Friston, 1995). However, it is unclear whether the canonical model is an appropriate representation of pathological epileptic discharges (Benar et al., 2002). Previous investigations have demonstrated a large degree of variability of the HRF across subjects, brain regions, and even time (Aguirre et al., 1998; Handwerker et al., 2004; Menz et al., 2006). Moreover, BOLD responses to deep, asynchronous, or very focal discharges may appear non-canonical with respect to the activity visible on the scalp. The observed BOLD response may even appear to precede the occurrence of the scalp discharge (Hawco et al., 2007; Jacobs et al., 2009; Moeller et al., 2008). In the case of seizures, an analysis allowing for variable HRF delay, with respect to the ictal onset on scalp EEG, may provide a dynamic representation of ictal propagation patterns.
In contrast to the model-driven GLM analysis, independent component analysis (ICA) is a data-driven method that can be used to detect relevant patterns of BOLD signal fluctuations without a prior hypothesis on the HRF shape (McKeown et al., 1998). It can identify regions showing a non-canonical HRF and also yield de-noised time courses of cerebral activity as a result of the separation of artifactual components (Thomas et al., 2002).
In patients with interictal epileptic spikes, it has been shown that ICA could identify similar brain regions as those identified by a GLM analysis, while separating components related to acquisition or physiological artifacts (Rodionov et al., 2007). However, it remains to be seen whether ICA methods could also reveal relevant brain regions not already identified by the GLM, or provide additional information on the identified areas. Simulations have demonstrated that the GLM could fail to detect activations with an HRF only slightly different from the canonical shape; in contrast, an ICA method independent of the HRF could not only detect the responses, but also explicitly estimate the HRF shape (LeVan and Gotman, 2009). Unlike interictal spikes, seizures are not instantaneous events and are characterized by a temporal evolution. The current study thus first investigates the ability of ICA to detect brain regions showing BOLD changes related to ictal discharges. A subsequent investigation of the estimated HRFs may then reveal additional dynamic information about the identified areas.
Methods
Data acquisition
Subjects were selected from a database of focal epilepsy patients who underwent simultaneous EEG-fMRI acquisitions between No-vember 2003 and June 2008. These patients showed frequent interictal discharges and the initial objective of the scanning sessions was to investigate this activity. Until May 2006, the acquisitions were performed in a 1.5 T Siemens Sonata Vision scanner (Siemens, Erlangen, Germany) with a CP head coil. After a standard anatomical scan (T1-weighted, TR=22 ms, TE=9.2 ms, flip angle of 30°, 1 mm isotropic voxel size, 256×256 matrix, 176 sagittal slices), functional BOLD-EPI data was acquired in several consecutive 6-minute scanning runs (TR=3 s, TE=50 ms, flip angle of 90°, 5 mm isotropic voxel size, 64×64 matrix, 25 transverse slices). Starting in May 2006, the imaging was performed in a 3 T Siemens Trio scanner with a CP head coil. The anatomical scans were acquired with the following parameters: TR=23 ms, TE=7.4 ms, flip angle of 30°, 1 mm isotropic voxel size, 256×256 matrix, 176 sagittal slices. As with the previous patients, the functional data was also acquired in 6-minute scanning runs (TR=1.75 s, TE=30 ms, flip angle of 90°, 5 mm isotropic voxel size, 64×64 matrix, 25 transverse slices).
Multiple scanning runs were performed up to 2 h, unless patients experienced discomfort or if they suffered from clinical events susceptible of causing injuries. Simultaneous EEG, low-pass filtered at 1 kHz and sampled at 5 kHz, was recorded using 25 MR-compatible Ag/AgCl electrodes and a BrainAmp amplifier (Brain Products, Gilching, Germany). The electrodes were positioned according to the 10–20 system (19 standard scalp locations), with additional electrodes at F9-T9-P9 and F10-T10-P10, and referenced to FCz. Two additional electrodes were placed on the back to record the electrocardiogram. The electrodes were adjusted until all impedances were below 5 kΩ. This was monitored throughout the scanning session, possibly requiring a readjustment between the scanning runs if the impedances went above 5 kΩ. After the scanning session, scanner gradient artifact was removed by an averaged subtraction method (Allen et al., 2000) implemented in BrainVision Analyzer software (Brain Products, Gilching, Germany). Ballistocardiographic artifact was eliminated by an ICA method (Benar et al., 2003; Srivastava et al., 2005).
A neurologist then visually reviewed the artifact-corrected EEG recording and marked epileptic events. In particular, seizures were carefully identified. These were defined as prolonged rhythmic activity, clearly differentiated from background and from interictal activity, and showing a propagation or evolution of the rhythmic component (Sperling and O’Connor, 1990). The identified ictal events did not necessarily include recognizable clinical symptoms, but it was verified that similar events had previously been observed on EEGs recorded outside the scanner. Patients whose recordings included such seizures were retained for further analysis. Only the 6-minute scanning runs containing the ictal events were analyzed.
Patient description
The review of the EEGs revealed that 15 patients had ictal events during their EEG-fMRI acquisition. The description of the patients, including habitual seizure semiology, MRI, interictal EEG findings, and hypothesized epileptogenic focus, is presented in Table 1. As described previously, not all patients were scanned in the same scanner. Patients #1 and #2 were scanned at 1.5 T, while the remaining 13 patients were scanned at 3 T. Patients #1–12 had clear MRI abnormalities, as well as focal EEG discharges concordant with those abnormalities, supporting the hypothesis of an epileptogenic focus around the lesions. The remaining 3 patients (#13–15) did not show MRI lesions, but had focal EEG findings. For the purpose of evaluating the regions of activations identified by the GLM and ICA, the presumed epileptogenic focus for these 3 patients was only defined at the lobar scale based on the electro-clinical findings. On the other hand, for the 12 lesional cases, the epileptogenic focus was presumed to be located in areas inside or immediately around the lesions, including overlying cortex. Moreover, four of these patients (#4, 5, 6, and 12) underwent an intracranial EEG investigation that allowed a more precise localization of the seizure onset zone.
Table 1.
Description of the patients, including habitual seizure semiology, MRI findings, interictal EEG, and presumed epileptogenic focus.
| Patient | Age/gender | Habitual seizure semiology | MRI | Interictal EEG | Presumed focus |
|---|---|---|---|---|---|
| 1 | 25/F | Epigastric aura, out-of-breath sensation, LOC | RTP nodular heterotopia, abnormal overlying cortex | RFT spike-and-waves | RTP lesion |
| 2 | 39/M | Flashing lights in L visual field, sometimes L eye deviation, LOC | RTO nodular heterotopia, abnormal overlying cortex | R posterior spikes and spike-and-waves | RTO lesion |
| 3 | 52/M | Visual and auditory distortions with language impairment | Bil nodular heterotopia, L anterior T resection | Independent LT and RT spikes | BilTO lesions |
| 4 | 23/M | Aura of déjà-vu, then LOC and motor automatisms | Bil nodular heterotopia | Independent LT and RT spikes | BilTO lesions |
| 5 | 20/F | Visual distortions with change of colors, confusion | RTPO nodular heterotopia, abnormal overlying cortex | RTP spikes/sharp waves | RTPO lesion |
| 6 | 11/M | Aura of fear, screaming, L head deviation | RF focal cortical dysplasia | RF spike-and-waves | RF lesion |
| 7 | 33/M | Somatosensory sensation in R elbow, non-tonic R arm elevation | LCP focal cortical dysplasia | LCP polyspikes | LCP lesion |
| 8 | 26/M | Chest pressure feeling, LOC, staring, chewing, sometimes R eye deviation | Band heterotopia TPO, predominantly R | BilTO spike and slow waves with R predominance | RTPO lesion |
| 9 | 23/F | Visual illusions, micropsia, blindness, or lights forming faces | Band heterotopia predominantly BilFPO | Synchronous and rhythmic sharp and slow wave discharges over posterior regions | BilO lesion |
| 10 | 68/M | L eyelid clonus, jerks of all 4 limbs | Metastasis, R posterior SMA | RF slow waves | RC lesion |
| 11 | 42/M | Nocturnal slow head/chest flexion, left arm extension, right head deviation | RF atrophy | RFC slow waves | RF lesion |
| 12 | 36/M | Either drop attacks or L head and eye deviation and L arm dystonic posturing | LFT atrophy | Generalized slow waves, R polysharp-slow waves, maximum over RFT region | FT, earlier R involvement |
| 13 | 28/F | Aura of déjà-vu, anxiety, palpitations, dysphasia, staring | Normal | L slowing, LT spikes | L mesial T |
| 14 | 22/F | GTCs or absences with staring and unresponsiveness | Normal | BilF sharp and slow waves during sleep, LT spikes, Bil fast activity predominantly L | BilF predominantly L |
| 15 | 19/F | L visual field distortions (sometimes also R), LOC, L eye deviation, tongue movements | Normal | RTPO spikes | RTPO |
Abbreviations: LOC: loss of consciousness, GTC: generalized tonic-clonic seizures, R: right, L: left, Bil: bilateral, F: frontal, C: central, T: temporal, P: parietal, O: occipital, SMA: supplementary motor area.
Data processing
The fMRI volumes were motion-corrected (Collins et al., 1994) and smoothed with a Gaussian kernel (full-width at half-maximum of 6 mm) using in-house software. Following these preprocessing steps, the 6-minute runs containing seizures were concatenated and analyzed first using a standard GLM method, and then using ICA. It was decided to only use the runs with seizures (rather than all runs) to ensure maximal sensitivity. Nevertheless, in 2 patients, an additional analysis using all runs was performed, yielding similar results.
GLM processing
The GLM analysis was performed using the FMRISTAT software package (Worsley et al., 2002). Baseline drifts were treated as confounding factors using a polynomial basis set, with separate regressors for each run. The 6 motion parameters (3 translations and 3 rotations) were also incorporated as confounds, since residual motion artifacts may contaminate the fMRI images even after motion correction (Friston et al., 1996). The BOLD changes related to the seizures were modeled as boxcar functions based on the timing and duration of the marked events, and convolved with four HRFs peaking at 3, 5, 7, and 9 s (Bagshaw et al., 2004). If the scanning session included interictal events, additional regressors were formed in the same way and treated as confounds in the model. Applying the GLM framework resulted in a statistical t-map for ictal regressors corresponding to each HRF. A combined map was then formed by taking the maximum t-value from each map at each voxel. This map was thresholded at |t|>3.1 with a minimum cluster spatial extent of 5 voxels, yielding a corrected family-wise error (FWE) p-value of 0.05 (Friston et al., 1994; Worsley et al., 2002).
ICA processing
The ICA was performed using the MELODIC toolbox (Beckmann and Smith, 2004) implemented in FSL (Smith et al., 2004). While the GLM is a massively univariate method treating each voxel separately, ICA is a multivariate method that assumes that the fMRI data can be represented as a linear mixture of spatially independent sources. It examines inter-voxel relationships to extract spatially independent patterns of activation with common time courses.
The method requires several steps and is outlined in Fig. 1. Briefly, the preprocessed images are first decomposed into spatially independent components. To identify which components are related to the seizures, arbitrary HRF shapes time-locked to the seizure onset are fitted to the component time courses. Finally, activation maps are generated based on the amplitude, sign, and time-to-peak of the fitted HRFs. The following will describe the analysis steps in more detail.
Fig. 1.
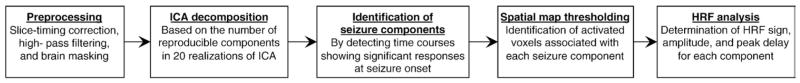
Steps involved in the ICA processing.
Preprocessing and ICA decomposition
The fMRI slices within each volume were temporally realigned using sinc interpolation with Hanning windowing, and high-pass filtered to remove drift effects, separately for each concatenated 6-minute run. Voxels outside the brain were removed using a mask created from the averaged EPI volume (Smith, 2002). The independent components were then computed by an iterative fixed-point method maximizing the non-Gaussianity of the sources, which has been shown to be equivalent to maximizing statistical independence (Hyvarinen and Oja, 2000). The number of extracted sources was determined by performing 20 repetitions of the ICA decomposition with random initialization, as true sources are likely to appear consistently in multiple ICA decompositions (Himberg et al., 2004; LeVan and Gotman, 2009). The reproducible components were then identified using the RAICAR algorithm (Yang et al., 2008), which matches components across ICA realizations based on their pairwise spatial cross-correlation coefficient.
Identification of ictal components
The application of ICA on fMRI data typically yields a large number of components, which include any source of fluctuation such as physiological artifacts, residual motion, and cerebral BOLD activity. While the ICA decomposition is purely data-driven, modeling assumptions are required to detect components relevant to the current study, namely the hemodynamic changes related to the ictal events. As in the GLM analysis, the seizures were modeled as boxcar functions. However, the HRF was not constrained to any particular shape, but was rather modeled by a windowed Fourier basis set spanning an interval from 10 s before to 20 s after the marked events. HRFs have been observed peaking as early as 3 s before or as late as 9 s after EEG events (Bagshaw et al., 2004; Moeller et al., 2008), so the selected time interval allows for a reasonable margin around the HRF peak. In the case of the canonical HRF, the onset is 5.4 s before the peak, and an undershoot occurs 5.4 s after the peak before resolving to baseline (Glover, 1999).
An HRF was thus deconvolved from the time course of each component extracted by ICA. If a patient had multiple seizures in the scanner, a single HRF was calculated using the constraint that its shape should be the same for each seizure. Components significantly related to the seizures were then identified by an F-test (p<0.05, corrected for the number of components), with the motion parameters used as confounds as in the GLM analysis. Noise was modeled as an autoregressive (AR) process estimated from the residuals using the Yule-Walker equations. The AR order was determined by performing the estimation using gradually increasing AR orders, until the residuals no longer contained significant autocorrelations (Ljung–Box test, p<0.01). The AR parameters were used to compute an adjusted F-statistic with appropriate effective degrees of freedom (Kruggel et al., 2002). Statistically significant F-values were then indicative of component time courses showing significant signal changes time-locked to the ictal onset.
As implemented in the MELODIC toolbox (Beckmann and Smith, 2004), the spatial topographies associated with the seizure-related components were thresholded to identify voxels involved in the seizures. After normalization by a noise amplitude estimated from the ICA residuals, the spatial maps were modeled by a mixture of Gaussian and two Gamma distributions, representing background noise, positive, and negative voxel intensities, respectively (Beckmann and Smith, 2004). A voxel was considered as activated if it had a 99.9% or greater probability of not belonging to background noise.
Generation of activation maps
There could be several components associated with an ictal event, particularly if the seizure involves a widespread brain area. To facilitate the interpretation of the results, a single summary map for each patient was formed by computing at each voxel the variance accounted for by all seizure-related components. This map was reviewed visually to assess the concordance of the identified voxels with the patient’s presumed epileptogenic focus, as determined by clinical history, EEG, and MRI abnormalities. Moreover, the similarity between the ICA variance map and the absolute GLM t-statistic map was quantified using Spearman’s correlation coefficient.
More elaborate maps were then generated to illustrate the BOLD changes in more detail. In particular, HRFs fitted to the ictal components were investigated to determine the sign and delay of the HRF peaks. This part of the analysis could thus only be performed on HRFs showing a clear peak, even though the HRF fitting method could support arbitrary shapes. The peak was defined as the maximum absolute value of the fitted HRF. Any data outside a window of ±5 s around the peak was then considered as baseline (Fig. 2). This window should accommodate the peak width; for example, the canonical HRF has a full-width at half-maximum of 5.2 s (Glover, 1999). The prominence of the peak was then quantified by dividing its amplitude by the standard deviation of the baseline. HRFs with a ratio inferior to 3 were excluded from further analysis. The value of 3 was determined from Monte-Carlo simulations using false, randomly determined seizure timings, and computing the threshold that would result in the rejection of 95% of the simulated HRFs.
Fig. 2.

Procedure to determine the prominence of the HRF peak. Any data more than 5 s before or after the peak (vertical dashed line) is considered as baseline (shaded area). The prominence of the peak is then quantified by the ratio of the peak amplitude to the standard deviation of the baseline. In the example shown, this ratio was equal to 4.0.
The sign of the peak was then used to distinguish BOLD activations (positive peak) from deactivations (negative peak). A new amplitude map was constructed from the signed peak amplitudes and compared with the GLM t-statistic map using Spearman’s correlation coefficient. A timing map was formed from the HRF peak delays, in which the color scale represented time delay instead of the usual representation of amplitude. If multiple components overlapped at a given voxel, then only the value corresponding to the earliest HRF peak was used. The timing map thus provided a temporal ordering of the BOLD changes, which were then compared with the location of the expected epileptogenic focus.
Results
GLM results
During the EEG-fMRI acquisitions, patients had between 1 and 31 ictal EEG events. The GLM results from patient #1 were presented previously in Kobayashi et al. (2006) and patients #2–4 and #6–9 were presented in Tyvaert et al. (2008). A description of the results for all patients is presented in Table 2. Significant BOLD responses were always present in the presumed epileptogenic focus, as defined previously.
Table 2.
Description of ictal EEG patterns and the locations of GLM activations and deactivations.
| Patient | # ictal events | Ictal EEG pattern | Duration (seconds, mean ± standard deviation) | GLM fMRI activation | GLM fMRI deactivation |
|---|---|---|---|---|---|
| 1 | 30 | RT high amplitude sharp slow wave followed by low amplitude polyspikes | 3.5±1.1 | Widespread RFTP, L cerebellum | BilO, scattered LFTP |
| 2 | 1 | R posterior T sharp rhythmic activity | 22.3±0 | BilTP, RF | BilF |
| 3 | 1 | RCT rhythmic activity | 65.4±0 | BilTO, BilF, Bil cerebellum | Bil insula, mesial F |
| 4 | 4 | LT rhythmic sharp waves | 2.6±1.0 | BilTO, BilF, Bil cerebellum | BilT, BilO, BilFP |
| 5 | 3 | R posterior spike and slow waves followed by Bil spikes predominantly R | 9.7±4.8 | RTPO (around the lesion) | BilFT, BilO |
| 6 | 10 | RF rhythmic spike and waves with secondary BilF involvement | 23.9±15.6 | BilTO, BilF, Bil cerebellum | BilT, BilF, BilPO |
| 7 | 1 | LCP rhythmic sharp fast activity | 9.1±0 | RT, BilO, LCP, Bil cerebellum | BilF, BilP |
| 8 | 11 | RTPO discharges propagating to L homologous regions | 4.5±3.2 | BilTPO, RFP, R cerebellum | LFTP, BilF, BilO, L cerebellum |
| 9 | 2 | BilO and RTPO discharges | 11.9±3.0 | Bil mesial F, BilTO | BilO, BilFC |
| 10 | 10 | BilFC sharp waves predominantly R becoming more diffuse | 10.6±5.1 | BilCP, RTP, Bil thalamus, Bil putamen, Bil cerebellum | BilF, RPO |
| 11 | 3 | RFC slow waves followed by BilF and parasagittal rhythmic activity and then R slow waves | 9.3±2.3 | BilFC, BilT, BilO | Bil inferior F, BilPO |
| 12 | 1 | RT spikes and later synchronous or asynchronous LT spikes | 44.3±0 | BilT, BilC | RF, RPO, L cerebellum |
| 13 | 31 | LT rhythmic sharp waves followed by rhythmic discharges and LT slow waves | 10.3±2.2 | Widespread L hemisphere, BilTP, Bil cerebellum | RFT, BilO, BilC |
| 14 | 12 | LFT spiking activity followed by BilF and LT rhythmic activity and then sharp and slow waves in the same areas | 14.6±3.9 | BilF, Bil cerebellum | BilTP, Bil inferior F, BilO |
| 15 | 1 | RTPO and LTO sharp wave discharges followed by rhythmic Bil spike and waves | 23.5±0 | BilT, RF, Bil cerebellum | BilPO, BilF |
Responses concordant with the presumed epileptogenic focus are indicated in bold type. Abbreviations: R: right, L: left, Bil: bilateral, F: frontal, C: central, T: temporal, P: parietal, O: occipital.
The patterns of activation and deactivation were quite widespread, on average accounting for 32.9% of the brain volume, and often included brain areas distant from the presumed epileptogenic focus. Such widespread responses lack specificity in the identification of the epileptogenic zone, as they are likely to include a large amount of propagated activity. The volume of significant BOLD responses was strongly correlated with the number of ictal events analyzed (Pearson’s r=0.75, p=0.001). In all 15 patients, the BOLD changes in the presumed epileptogenic zone were positive. These activations often extended farther, including remote brain regions. In 5 patients, negative BOLD responses were also present in the presumed focus.
The GLM findings thus suggest that ictal events are accompanied by significant BOLD changes in the epileptogenic zone. These responses may take the form of activations or deactivations. However, it is also clear that seizures may sometimes involve a large brain area beyond a presumed smaller epileptogenic focus.
ICA results
The ICA method decomposed the fMRI data into a number of reproducible components ranging from 37 to 292 for each patient. After fitting an HRF to the component time courses, there were between 4 and 135 components in which this HRF was statistically significant, indicating that these components were related to the ictal activity. All 15 patients thus had at least one component whose time course was significantly related to the seizures. Examples of such components are shown in Fig. 3. The number of identified components was strongly correlated with the volume of significant BOLD response previously found by the GLM method (Pearson’s r=0.92, p<0.001).
Fig. 3.

Examples of seizure-related components extracted by ICA. Spatial topographies and time courses of the components are shown, as well as the corresponding periods of ictal activity. BOLD changes that appear related to the seizures on the ICA time courses are indicated by red arrows. The HRFs deconvolved from the time courses are shown on the right.
The clusters identified by ICA were quite extensive, covering 20.3% of the brain volume on average. However, this is smaller than the responses found by the GLM, although this may be due to different thresholding procedures in the ICA maps. Nevertheless, the seizure-related BOLD changes identified by both methods were similar, as all 15 patients showed significant correlations (p<0.001) between the ICA and absolute GLM maps, with an average correlation coefficient of 0.23. On average, 40.6% of significant voxels identified by the GLM were also detected by the ICA method.
The results were investigated more thoroughly after partitioning the maps into activations and deactivations, as described in the Methods section. After identifying the peak of the fitted HRFs and rejecting HRFs whose ratio of peak amplitude to baseline standard deviation was less than 3, there was a single patient (#3) for whom there was no remaining HRF with a prominent peak. The other 14 patients had a number of remaining components ranging from 1 to 69. The locations of the activations and deactivations are detailed in Table 3. The EEG, GLM maps, and ICA maps of 5 illustrative cases are shown in Figs. 4, 5, 6, 7, and 8 and will be discussed in more detail below. The ICA maps from the remaining patients are shown in Supplementary Fig. 1. When taking into account the sign of the BOLD response, ICA maps were highly significantly correlated with GLM maps in 13 of 14 patients (p<0.05), with an average correlation coefficient of 0.27, a slight increase from before. On average, after the removal of clusters without prominent HRF peaks, 19.5% of significant voxels in the GLM maps were also present in the ICA maps. This percentage was below 10% in 5 patients (#3, 9, 10, 11, and 15).
Table 3.
Locations of activations and deactivations identified by the ICA method.
| Patient | Presumed focus | # seizure-related ICA components with a clear peak | ICA fMRI activation | ICA fMRI deactivation | Earliest activation |
|---|---|---|---|---|---|
| 1 | RTP lesion | 39 | Widespread RFTP, L cerebellum | BilO, scattered LFTP, R cerebellum | RFT |
| 2 | RTO lesion | 5 | Mesial F | BilF | Mesial F |
| 3 | BilTO lesions | 0 | None | None | None |
| 4 | BilTO lesions | 35 | BilT, BilTO, Bil cerebellum | BilFT, BilO | Brainstem |
| 5 | RTPO lesion | 3 | RTPO (around the lesion) | None | Cortex overlying lesion |
| 6 | RF lesion | 27 | RF, RT, Bil cerebellum | BilF, RT, BilPO | RF |
| 7 | LCP lesion | 12 | BilTO, LCP, Bil cerebellum | RF, BilF, RCP | BilO |
| 8 | RTPO lesion | 14 | RTO, RF, RP, LF | LFP, BilF, BilO | RTO |
| 9 | BilO lesion | 1 | None | RO | None |
| 10 | RC lesion | 6 | BilCP, RTO, LO, Bil cerebellum | LF, BilT | BilO |
| 11 | RF lesion | 12 | BilF, BilTP | BilF | BilF |
| 12 | FT, earlier R involvement | 2 | RFT | RF, RPO, L cerebellum | RFT |
| 13 | L mesial T | 69 | Widespread L hemisphere, BilTP, Bil cerebellum | RFT, BilO, BilC, Bil cerebellum | LF |
| 14 | BilF predominantly L | 25 | BilFT, Bil cerebellum | BilTP, BilO, Bil cerebellum | BilFT |
| 15 | RTPO | 1 | RP | None | RP |
The location of the presumed epileptogenic focus is repeated from Table 1 to facilitate comparisons; concordant responses are indicated in bold type. The last column shows the location of the earliest activation, as determined by the analysis of the HRF peak delays. Abbreviations: R: right, L: left, Bil: bilateral, F: frontal, C: central, T: temporal, P: parietal, O: occipital.
Fig. 4.

MRI, EEG, SEEG, and analysis results for patient #5. The heterotopia is circled in red on the MRI. SEEG electrode labels are numbered from the deepest (#1) to the most superficial contact (#9). The ictal onset time and location are indicated by green arrows on the SEEG trace and GLM map, with propagated activity shown in the red rectangle. Note that the color scale on the ICA delay map represents HRF peak timing, with the earliest activation also indicated by a green arrow.
Fig. 5.
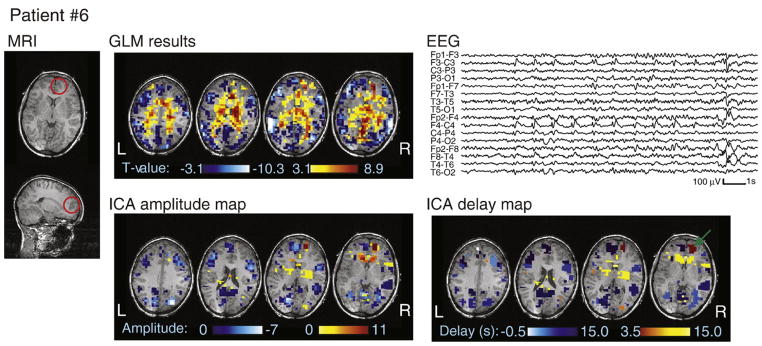
MRI, EEG, and analysis results for patient #6. The dysplasia is circled in red on the MRI. Note that the color scale on the ICA delay map represents HRF peak timing, with the earliest activation indicated by a green arrow.
Fig. 6.
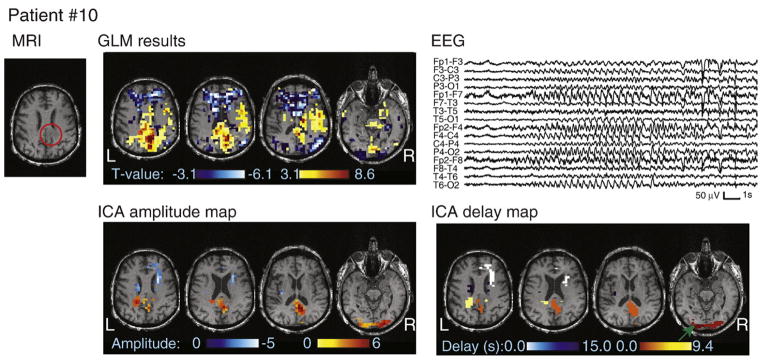
MRI, EEG, and analysis results for patient #10. The tumor is circled in red on the MRI. Note that the color scale on the ICA delay map represents HRF peak timing, with the earliest activation indicated by a green arrow.
Fig. 7.

MRI, EEG, and analysis results for patient #11. The atrophy is circled in red on the MRI. Note that the color scale on the ICA delay map represents HRF peak timing, with the earliest activation indicated by a green arrow. The spatial topography of a bilateral frontal component is also shown, with the fitted HRF peaking at −2 s. The GLM map only revealed a deactivation in this region.
Fig. 8.

MRI, EEG, and analysis results for patient #12. The atrophy is circled in red on the MRI. Note that the color scale on the ICA delay map represents HRF peak timing, with the earliest activation indicated by a green arrow. The spatial topography of a right frontal component is also shown, with the fitted HRF peaking at 0 s. The GLM map did not detect a significant BOLD response in this region.
Maps from 6 patients (#1, 4, 6, 8, 13, and 14) included components with negative HRF peaks in the so-called “default-mode” network, which is known to show activity anti-correlated with other functional regions (Raichle et al., 2001). These components had been visually identified with the help of a spatial mask of the default-mode regions (precuneus, posterior cingulate, inferior parietal lobes, and medial prefrontal cortex) generated from an anatomical atlas.
Ictal HRF patterns
While ICA and GLM methods identified widespread areas of significant BOLD changes related to the seizures, the data-driven nature of ICA allowed for a subsequent investigation of the HRF corresponding to each activation cluster. However, the patients’ motion parameters were first examined to account for the possibility that some of the activations, particularly those distant to the presumed epileptogenic focus, may be due to motion artifacts. Fig. 9 shows a scatterplot of the maximum translation and correlation coefficient between the translation parameters and a signal representing the ictal events as blocks for all patients. The plot shows that 6 patients had relatively large motion or high correlation between the motion parameters and the ictal events. Fig. 9 also shows the translation parameters and ictal events for these 6 patients. For 4 patients (#2, 3, 4, and 7), the seizures were clearly associated with head movement. For patient #10, there were several abrupt movements that were sometimes simultaneous with ictal events. For patient #12, the translation parameters did not show abrupt movements, but rather a slow drifting motion. BOLD signal changes due to motion artifacts cannot be distinguished from true ictal fluctuations if the motion is correlated with the seizures. The activations identified in those 6 patients are thus likely to include motion-related clusters.
Fig. 9.

Identification of patients with seizure-correlated motion. A: Scatterplot showing the maximum motion and correlation between motion and ictal events for all patients. Six patients, shown as red crosses, stand out from the other patients, shown as blue dots, due to large motion and high correlation between motion and ictal events. B: Time courses of the 3 translation parameters and periods of ictal activity for the 6 patients identified in part A.
In 8 patients, the earliest activations were in focal areas concordant with the presumed epileptogenic zone (see Table 3). The results will be discussed according to lesion type. All HRF peak times will refer to the time relative to the ictal onset determined from the EEG.
Periventricular nodular heterotopia
Patients #1–5 had periventricular nodular heterotopias. The results of patient #5 are shown in Fig. 4. The HRF pattern involved the right posterior cortex overlying the heterotopia with an HRF peaking at approximately 5 s. The heterotopia was also involved with a later HRF peaking between 7 and 8 s. This pattern was consistent with the intracranial investigation (see Fig. 4). The ictal onset was localized to depth electrodes RS, in superficial contacts, and RP, either only in superficial contacts or diffusely. After 2–3 s, the seizures then propagated to the deeper contacts of electrodes RS and RP (in the nodule), and some time later to other locations including mesial temporal structures after another 2–3 s. Surgical resection of the lesion and overlying cortex resulted in seizure freedom after 12 months.
Patient #1 had a very similar HRF pattern as patient #5, with involvement of the overlying cortex followed by the heterotopia. The results of patients #2–4 are less consistent due to head movements associated with their seizures (see Fig. 9B). The ICA map of patient #2 was dominated by a large frontal deactivation, which was also present in the GLM map, while patient #3’s ICA decomposition did not result in any component whose fitted HRF had a prominent peak. As for patient #4, the activations included bilateral mesial temporal structures with an HRF peaking at 2 s. This would be consistent with the intracranial investigation of this patient, which revealed either left or right mesial temporal seizure onset, with propagation to the nodules after 2 to 15 s. However, the ICA method also identified several small clusters with earlier HRFs peaking at approximately the same time as the EEG ictal onset, in bilateral frontal, insular, ventricular, and periventricular areas.
Focal cortical dysplasia
Patients #6–7 had focal cortical dysplasias. Patient #6 (Fig. 5) had an early HRF peak at 3.5 s located directly inside the right anterior frontal lesion. A later HRF in the thalami, with a peak at 9 s, is consistent with the secondary bilateral synchrony observed on surface EEG during the seizures. A presurgical electrocorticogram showed rhythmic spiking over the dysplasia. A right frontopolar resection resulted in seizure freedom after 2 years. For patient #7, a large head motion occurred exactly at the time of the seizure (Fig. 9B). A left parietal cluster inside the dysplasia was detected by ICA with an HRF peaking at 6 s, although there was also an earlier occipital activation peaking at −5s.
Band heterotopia
Patients #8–9 had band heterotopias. In both cases, the fMRI cluster with the earliest HRF peak was in the heterotopic cortex in a location consistent with the ictal onset observed on scalp EEG. Patient #8 had a right temporo-parieto-occipital onset and a right occipital activation with an HRF peaking at 2.5 s, with a later diffusion to surrounding areas. Patient #9 had bilateral occipital rhythmic discharges with additional involvement of right temporal and parietal electrodes and a single deactivation in the right occipital cortex with an HRF peaking at 9.5 s. The lesions were widespread in both patients, but showed some right-sided predominance in patient #8.
Metastasis
Patient #10 had a metastasis from a lung cancer. Motion was correlated with the ictal events. The earliest activation identified by ICA (Fig. 6) peaked at the time of the ictal onset and followed the edge of the brain at the occipital pole; it was thus likely caused by movement. The next activation cluster had an HRF peaking at 3 s and was situated in the cortex directly adjacent to the lesion. The contralateral cortex was then involved 6 s later with an HRF peaking at 9 s. The EEG did show bilateral synchronization following the right-sided ictal onset in all recorded seizures, although only 1 to 2 s after. The rather early HRF peak of the right-sided cluster may correspond to electrical activity preceding the onset visible on scalp EEG.
Cortical atrophy
Patient #11 had a right frontal atrophy (Fig. 7). The earliest activation cluster was in the inferior frontal areas bilaterally with an early HRF peak at −2 s. This region was also identified by the GLM analysis, but appeared as a deactivation, likely reflecting the undershoot of the HRF.
Patient #12 had a left fronto-temporal atrophy (Fig. 8). The motion parameters were correlated with the ictal events, but the motion consisted of slow drift rather than abrupt jerks (Fig. 9B). Despite the left-sided MRI abnormality, ICA only identified a single activation cluster in the right frontal region, with an HRF peaking at 1 s. Nevertheless, an electrocortigraphic study with left fronto-temporal strips appeared to have missed the seizure onset zone. Therefore, the reviewing neurologist could not confirm the hypothesis of a left-sided epileptogenic focus, and rather suggested a right-sided or multifocal ictal onset. Because of the early HRF peak, this region was not detected by the GLM.
Non-lesional
Patients #13–15 had normal MRIs. Patient #13 showed early HRFs peaking at 2–3 s in the left frontal and left mesial temporal areas, with other regions having later HRF peaks. This was consistent with the EEG showing activity predominant in the F7-T3-T5 electrodes. Patient #14 showed a bilateral frontal HRF peaking at −2 s, and then a left frontal cluster with an HRF peaking at 5 s. This is concordant with the bifrontal, predominantly left, ictal pattern seen on surface EEG. Patient #15 showed a single activation cluster in the right temporo-parietal regions with an early HRF peaking at the same time as the EEG ictal onset, which was predominantly right posterior. The GLM analysis showed a deactivation in the same region, likely reflecting the undershoot of the HRF.
Discussion
In summary, 13 of 15 patients showed plausible HRF patterns given the available electro-clinical data, although 4 of these 13 had seizure-related motions at ictal onset, resulting in additional BOLD response clusters with early HRF peaks in 3 of them. Seizure-related motion may also explain the lack of concordant BOLD patterns in the 2 remaining patients (#2 and 3). Among the 9 patients without seizure-related motion, 7 had their earliest positive HRF peak inside the presumed epileptogenic zone, with another patient (#9) having a single negative HRF peak concordant with the electro-clinical data.
Methodological issues
As a data-driven procedure, ICA cannot rely on null hypothesis testing to generate thresholded spatial maps. The chosen approach of modeling the signal by a mixture of Gaussian and Gamma functions (Beckmann and Smith, 2004) allowed for an adequate representation of the ICA maps, but this is not equivalent to null hypothesis testing and family-wise false positive rate thresholding as used in the GLM. Moreover, the GLM noise estimation includes any unmodeled signal fluctuations such as cardiac artifacts, respiration, or residual movement, while the ICA residuals do not include these sources of structured noise, which are rather extracted into separate components (Thomas et al., 2002). This results in additional variability between the maps generated by GLM and ICA methods. Nevertheless, the GLM and ICA maps were significantly correlated in 14 of 15 patients.
Modeling the HRF by a Fourier basis set may also lead to the detection of artifacts in the resulting fMRI maps. The method can accommodate arbitrary HRFs, including shapes very different from the canonical one. The statistical analysis ensures that the method will not fit fMRI signal peaks occurring merely by chance, but only if the assumptions of the model are correct. Modeling the residuals as an autoregressive process cannot accommodate large artifactual BOLD signal transients that coincidentally occurred during the ictal event, which may result in statistically significant non-canonical HRFs. A study on epileptic spikes revealed that most non-canonical shapes tended to occur remotely from the presumed epileptogenic focus and were likely artifacts (Lemieux et al., 2008). On the other hand, restricting the HRF to the canonical shape, such as in the standard GLM method, may prevent the detection of real activations. For example, various studies have observed HRFs with late peaks (Bagshaw et al., 2004; Jacobs et al., 2008) or even early HRFs preceding the observed EEG events (Hawco et al., 2007; Jacobs et al., 2009; Moeller et al., 2008). Simulations have shown that HRFs delayed by only a few seconds may be undetected by the GLM (LeVan and Gotman, 2009). The current study opts for a compromise, the Fourier basis model allowing an arbitrary HRF shape, but with the additional criterion of a single clear HRF peak to reduce the likelihood of fitting artifacts. The resulting HRFs were similar to the canonical shapes, but accommodated a wide variety of delays. This allowed a temporal ordering of the ICA components, as well as the separation of activation and deactivation.
Ictal events
The analyzed ictal events consisted of sustained discharges clearly distinct from background or interictal activity. They did not necessarily include clinical symptoms, and thus were not exactly equivalent to the patients’ usual seizures. Nevertheless, the regions identified from these events may provide an important indication of the epileptogenic zone, which cannot be determined from interictal events alone (Tyvaert et al., 2008). Subclinical electrographic seizures usually originate from the same location as clinical seizures (Sperling and O’Connor, 1990). Also, the distinction between clinical and subclinical events may only be related to the extent of the propagation of the ictal activity and to the intensity of clinical observation; it has thus been suggested to consider the two types of events with the same degree of importance in the presurgical evaluation of epilepsy (Zangaladze et al., 2008). Ictal events lacking significant clinical symptoms, particularly movements, are particularly well-suited for recording in the MRI scanner, as motion may result in highly contaminated fMRI data (Lemieux et al., 2007). Compared to other studies in the literature (Di Bonaventura et al., 2006a; Kobayashi et al., 2006; Salek-Haddadi et al., 2002; Tyvaert et al., 2008), the 15 patients in the current study constitute a sizable number, but ictal events are still quite infrequently recorded during EEG-fMRI sessions. However, it should be noted that none of the patients had originally been recruited on the basis of their seizure frequency. Future ictal EEG-fMRI investigations may therefore use a more specific patient recruitment strategy to increase the size of the study.
Identification of the epileptogenic focus
The high signal-to-noise ratio of ictal BOLD responses may result in the identification of significant activation clusters in very widespread brain regions (Kobayashi et al., 2006). Kobayashi et al. also reported that the spatial extent of the BOLD responses was strongly dependent on the number of analyzed ictal events. The same strong correlation was observed in the current study. This indicates that even subclinical seizures may involve a large brain area that is undetected when analyzing only a few events, due to the stringent statistical thresholds necessary to limit type I errors. The distinction between seizure onset and propagation inside this large brain area is then unclear. The method presented in the current study allows the estimation of the BOLD response delay by foregoing any strong constraints on the HRF shape. By calculating the peak delay of the HRF fitted to each component, it was possible to find activation clusters describing the onset of the ictal events, along with clusters with later HRF peaks that may correspond to propagated activity. It should be noted, however, that an analysis based on the identification of HRF peaks time-locked to EEG events may fail to recognize more sustained BOLD changes. The short ictal events seen on EEG may actually reflect longer neuronal discharges that are too deep or too spatially restricted to be measured on the scalp (Kobayashi et al., 2006). Seizures may also be accompanied by subtle, prolonged hemodynamic changes, for example due to the existence of a pre-ictal state up to 20 min prior to a seizure (Federico et al., 2005b). However, the detection of such changes would require longer continuous fMRI data than the 6-minute scanning runs acquired in the current study. The HRF peaks may only represent the strongest initial BOLD signal changes related to the seizures, and further studies would be necessary to investigate ictal hemodynamics over long time periods.
Effect of artifacts
Patients with seizure-correlated motion also exhibited activation clusters associated with the motion artifacts. These artifacts could be easily identified as such if they were situated in areas such as brain edges or ventricles, but this was not always the case. Given that motion artifacts appear in the fMRI signal without a hemodynamic delay, these clusters may not be distinguishable from ictal BOLD changes with early-peaking HRFs related to the seizure onset. Nevertheless, it was decided to still analyze and present the results from all patients, knowing that false activations may be present in the GLM and ICA maps for the 6 patients with seizure-correlated motion. This problem may be alleviated by the development of better models to detect and subtract these artifacts and other sources of noise that were not investigated in the current study, but that could also contribute to the widespread regions identified by the method. The clusters of BOLD response may also include non-artifactual hemodynamic changes that are only indirectly related to the seizures, such as regions comprising the “default-mode” network (Gotman et al., 2005; Laufs et al., 2007; Raichle et al., 2001), identified in 6 patients. Further studies would be required to determine whether other networks are also indirectly involved during ictal events, as such regions should not be classified as part of the ictal pattern.
Concordance of the results with the literature
The ICA method identified HRF patterns concordant with electro-clinical data in 13 of 15 patients (including the 3 patients who additionally showed motion-related clusters). Only 4 patients had intracranial electrode investigations, with 3 of them yielding an accurate delineation of the seizure onset zone. For patients without intracranial electrodes, the results can still be compared to other patients with similar characteristics in the literature. SEEG studies in patients with nodular heterotopia have shown that the nodules may be epileptogenic (Kothare et al., 1998), but almost never exclusively. Seizures usually start in the mesial temporal structures or in the cortex overlying the nodules, with only occasional involvement of the nodules themselves (Aghakhani et al., 2005; Battaglia et al., 2006; Tassi et al., 2005). Abnormalities in the overlying cortex are an indicator of epileptogenicity (Aghakhani et al., 2005; Porter et al., 2002), as seen in patients #1 and 5.
Intracranial electrode reports on focal cortical dysplasia have shown that dysplastic cortex is intrinsically epileptogenic, and complete removal of the lesion is associated with good seizure outcome (Chassoux et al., 2000; Palmini et al., 1995). Accordingly, patients #6 and 7 showed early HRF peaks in the lesion before spreading to surrounding areas, although patient #7 also included motion-related clusters.
There have been only a few studies of patients with band heterotopia investigated with intracranial electrodes. The heterotopic cortex appears to be epileptogenic (Morrell et al., 1992), but ictal onset discharges also involve the normal overlying cortex suggesting that both cortices are strongly interconnected (Francione et al., 1994; Mai et al., 2003). The diffuse lesion underlies widespread epileptogenicity, leading to poor surgical outcome (Bernasconi et al., 2001). In the current study, patients #8 and 9 showed BOLD patterns in heterotopic cortex consistent with surface EEG.
In the case of cerebral tumors, the mechanisms of epileptogenesis are not fully understood, but it is known that tumors induce multiple structural changes in adjacent cortex, altering the balance between excitatory and inhibitory activity (Beaumont and Whittle, 2000; Wolf et al., 1996). Resection of the epileptogenic peritumoral cortex is often required to obtain seizure freedom (Cascino, 1990). The results of patient #10 are in agreement with these observations, although the ICA map also included motion-related clusters.
Focal atrophy findings provide poor localization of the epileptogenic focus. Patients with mesial temporal lobe epilepsy (MTLE) are an exception, as they often show volumetric changes in the epileptogenic focus, but extratemporal neocortical changes are also frequently measured, including in the contralateral hemisphere of patients with unilateral MTLE (Keller and Roberts, 2008; Marsh et al., 1997; Seidenberg et al., 2005). Neocortical atrophy may be focal, yet distant from the presumed epileptogenic focus (Liu et al., 2003). In light of these observations, the BOLD patterns identified by the ICA method were only evaluated with respect to scalp EEG for patients with neocortical atrophy, as well as those with no visible MRI abnormalities. The results were found to be plausible in all cases.
These results show that the ICA method may constitute a way to distinguish between onset and propagation of the seizures, with the earliest identified activations mostly matching the presumed epileptogenic zone. The proposed method could also improve the interpretation of some GLM results, such as a deactivation explained by an early-peaking positive HRF found only by ICA analysis. Despite such differences, it should be noted that the ICA maps were significantly correlated with the GLM maps in 14 of 15 patients.
The validation of any new method of studying seizure onset and propagation is always challenging because there is currently no safe method providing this information unambiguously. The current gold standard, intracranial EEG, is highly invasive and suffers from poor spatial sampling. Nevertheless, it was still possible to obtain results that were consistent with the available data for each patient. The estimation of HRF delays may provide additional information in a non-invasive manner about seizure evolution, but it would be necessary to further validate that the HRF peaks truly reflect the ictal process. The temporal resolution of the identified HRF peaks is limited by the sampling rate of the fMRI acquisition and the intrinsic smoothness of the HRF. The HRF may also undergo some variability due to physiological factors unrelated to seizure propagation, but it is hoped that such confounding factors can be addressed in future studies. For example, a breath-holding task could be used as a calibration procedure to correct for variability due to regional vascular differences (Chang et al., 2008). In the current study, it was thus not possible for this method to detect propagated activity of the order of milliseconds, as is possible with intracranial EEG. Time differences between HRF peaks could only be resolved on the order of seconds, but the method has the advantage of providing a high-resolution image of the entire brain in a non-invasive manner. Further studies with direct hemodynamic measurements could be used to confirm that the reported HRF temporal patterns are truly representative of ictal propagation.
Conclusion
The presented ICA method could detect similar regions of ictal BOLD response as the standard GLM approach, with 14 of 15 patients having an ICA map significantly correlated with the GLM map. By imposing only few constraints on the HRF, the method could fit variable HRF shapes. This allowed the estimation of the hemodynamic delay in each BOLD response cluster identified by ICA. These BOLD patterns were concordant with the available electro-clinical data and with the literature in 13 of 15 patients, although motion artifacts could introduce additional activation clusters. The proposed method could thus detect regions with early HRF peaks, likely corresponding to the epileptogenic zone. It is hypothesized that regions associated with later HRF peaks could be used to map the ictal propagation patterns, although this would require further validation.
Supplementary Material
Acknowledgments
This project was supported by the Canadian Institutes of Health Research grant MOP-38079 and the Natural Sciences and Engineering Research Council of Canada scholarship CGSD.
References
- Aghakhani Y, Kinay D, Gotman J, Soualmi L, Andermann F, Olivier A, Dubeau F. The role of periventricular nodular heterotopia in epileptogenesis. Brain. 2005;128:641–651. doi: 10.1093/brain/awh388. [DOI] [PubMed] [Google Scholar]
- Aghakhani Y, Kobayashi E, Bagshaw A, Hawco C, Benar C, Dubeau F, Gotman J. Cortical and thalamic fMRI responses in partial epilepsy with focal and bilateral synchronous spikes. Clin Neurophysiol. 2006;117:177–191. doi: 10.1016/j.clinph.2005.08.028. [DOI] [PubMed] [Google Scholar]
- Aguirre G, Zarahn E, D’Esposito M. The variability of human, BOLD hemodynamic responses. NeuroImage. 1998;8:360–369. doi: 10.1006/nimg.1998.0369. [DOI] [PubMed] [Google Scholar]
- Al Asmi A, Benar C, Gross D, Khani Y, Andermann F, Pike B, Dubeau F, Gotman J. fMRI activation in continuous and spike-triggered EEG-fMRI studies of epileptic spikes. Epilepsia. 2003;44:1328–1339. doi: 10.1046/j.1528-1157.2003.01003.x. [DOI] [PubMed] [Google Scholar]
- Allen P, Josephs O, Turner R. A method for removing imaging artifact from continuous EEG recorded during functional MRI. NeuroImage. 2000;12:230–239. doi: 10.1006/nimg.2000.0599. [DOI] [PubMed] [Google Scholar]
- Bagshaw A, Aghakhani Y, Benar C, Kobayashi E, Hawco C, Dubeau F, Pike G, Gotman J. EEG-fMRI of focal epileptic spikes: analysis with multiple haemodynamic functions and comparison with gadolinium-enhanced MR angiograms. Hum Brain Mapp. 2004;22:179–192. doi: 10.1002/hbm.20024. [DOI] [PMC free article] [PubMed] [Google Scholar]
- Battaglia G, Chiapparini L, Franceschetti S, Freri E, Tassi L, Bassanini S, Villani F, Spreafico R, D’Incerti L, Granata T. Periventricular nodular heterotopia: classification, epileptic history, and genesis of epileptic discharges. Epilepsia. 2006;47:86–97. doi: 10.1111/j.1528-1167.2006.00374.x. [DOI] [PubMed] [Google Scholar]
- Beaumont A, Whittle I. The pathogenesis of tumour associated epilepsy. Acta Neurochir (Wien) 2000;142:1–15. doi: 10.1007/s007010050001. [DOI] [PubMed] [Google Scholar]
- Beckmann C, Smith S. Probabilistic independent component analysis for functional magnetic resonance imaging. IEEE Trans Med Imaging. 2004;23:137–152. doi: 10.1109/TMI.2003.822821. [DOI] [PubMed] [Google Scholar]
- Benar C, Gross D, Wang Y, Petre V, Pike B, Dubeau F, Gotman J. The BOLD response to interictal epileptiform discharges. NeuroImage. 2002;17:1182–1192. doi: 10.1006/nimg.2002.1164. [DOI] [PubMed] [Google Scholar]
- Benar C, Aghakhani Y, Wang Y, Izenberg A, Al Asmi A, Dubeau F, Gotman J. Quality of EEG in simultaneous EEG-fMRI for epilepsy. Clin Neurophysiol. 2003;114:569–580. doi: 10.1016/s1388-2457(02)00383-8. [DOI] [PubMed] [Google Scholar]
- Bernasconi A, Martinez V, Rosa-Neto P, D’Agostino D, Bernasconi N, Berkovic S, MacKay M, Harvey A, Palmini A, da Costa J, Paglioli E, Kim H, Connolly M, Olivier A, Dubeau F, Andermann E, Guerrini R, Whisler W, Toledo-Morrell L, Morrell F, Andermann F. Surgical resection for intractable epilepsy in “double cortex” syndrome yields inadequate results. Epilepsia. 2001;42:1124–1129. doi: 10.1046/j.1528-1157.2001.39900.x. [DOI] [PubMed] [Google Scholar]
- Cascino G. Epilepsy and brain tumors: implications for treatment. Epilepsia. 1990;31 (Suppl 3):S37–S44. doi: 10.1111/j.1528-1157.1990.tb05858.x. [DOI] [PubMed] [Google Scholar]
- Chang C, Thomason M, Glover G. Mapping and correction of vascular hemodynamic latency in the BOLD signal. NeuroImage. 2008;43:90–102. doi: 10.1016/j.neuroimage.2008.06.030. [DOI] [PMC free article] [PubMed] [Google Scholar]
- Chassoux F, Devaux B, Landre E, Turak B, Nataf F, Varlet P, Chodkiewicz J, Daumas-Duport C. Stereoelectroencephalography in focal cortical dysplasia: a 3D approach to delineating the dysplastic cortex. Brain. 2000;123 (Pt. 8):1733–1751. doi: 10.1093/brain/123.8.1733. [DOI] [PubMed] [Google Scholar]
- Collins D, Neelin P, Peters T, Evans A. Automatic 3D intersubject registration of MR volumetric data in standardized Talairach space. J Comput Assist Tomogr. 1994;18:192–205. [PubMed] [Google Scholar]
- Di Bonaventura C, Vaudano A, Carni M, Pantano P, Nucciarelli V, Garreffa G, Maraviglia B, Prencipe M, Bozzao L, Manfredi M, Giallonardo A. EEG/fMRI study of ictal and interictal epileptic activity: methodological issues and future perspectives in clinical practice. Epilepsia. 2006a;47 (Suppl 5):52–58. doi: 10.1111/j.1528-1167.2006.00878.x. [DOI] [PubMed] [Google Scholar]
- Di Bonaventura C, Carnfi M, Vaudano A, Pantano P, Garreffa G, Le Piane E, Maraviglia B, Bozzao L, Manfredi M, Prencipe M, Giallonardo A. Ictal hemodynamic changes in late-onset Rasmussen encephalitis. Ann Neurol. 2006b;59:432–433. doi: 10.1002/ana.20752. [DOI] [PubMed] [Google Scholar]
- Federico P, Archer J, Abbott D, Jackson G. Cortical/subcortical BOLD changes associated with epileptic discharges: an EEG-fMRI study at 3 T. Neurology. 2005a;64:1125–1130. doi: 10.1212/01.WNL.0000156358.72670.AD. [DOI] [PubMed] [Google Scholar]
- Federico P, Abbott D, Briellmann R, Harvey A, Jackson G. Functional MRI of the pre-ictal state. Brain. 2005b;128:1811–1817. doi: 10.1093/brain/awh533. [DOI] [PubMed] [Google Scholar]
- Francione S, Kahane P, Tassi L, Hoffmann D, Durisotti C, Pasquier B, Munari C. Stereo-EEG of interictal and ictal electrical activity of a histologically proved heterotopic gray matter associated with partial epilepsy. Electroencephalogr Clin Neurophysiol. 1994;90:284–290. doi: 10.1016/0013-4694(94)90146-5. [DOI] [PubMed] [Google Scholar]
- Friston K, Worsley K, Frackowiak R, Mazziotta J, Evans A. Assessing the significance of focal activations using their spatial extent. Hum Brain Mapp. 1994;1:210–220. doi: 10.1002/hbm.460010306. [DOI] [PubMed] [Google Scholar]
- Friston K, Williams S, Howard R, Frackowiak R, Turner R. Movement-related effects in fMRI time-series. Magn Reson Med. 1996;35:346–355. doi: 10.1002/mrm.1910350312. [DOI] [PubMed] [Google Scholar]
- Glover G. Deconvolution of impulse response in event-related BOLD fMRI. NeuroImage. 1999;9:416–429. doi: 10.1006/nimg.1998.0419. [DOI] [PubMed] [Google Scholar]
- Gotman J, Grova C, Bagshaw A, Kobayashi E, Aghakhani Y, Dubeau F. Generalized epileptic discharges show thalamocortical activation and suspension of the default state of the brain. Proc Natl Acad Sci U S A. 2005;102:15236–15240. doi: 10.1073/pnas.0504935102. [DOI] [PMC free article] [PubMed] [Google Scholar]
- Handwerker D, Ollinger J, D’Esposito M. Variation of BOLD hemodynamic responses across subjects and brain regions and their effects on statistical analyses. NeuroImage. 2004;21:1639–1651. doi: 10.1016/j.neuroimage.2003.11.029. [DOI] [PubMed] [Google Scholar]
- Hawco C, Bagshaw A, Lu Y, Dubeau F, Gotman J. BOLD changes occur prior to epileptic spikes seen on scalp EEG. NeuroImage. 2007;35:1450–1458. doi: 10.1016/j.neuroimage.2006.12.042. [DOI] [PubMed] [Google Scholar]
- Himberg J, Hyvarinen A, Esposito F. Validating the independent components of neuroimaging time series via clustering and visualization. NeuroImage. 2004;22:1214–1222. doi: 10.1016/j.neuroimage.2004.03.027. [DOI] [PubMed] [Google Scholar]
- Hyvarinen A, Oja E. Independent component analysis: algorithms and applications. Neural Netw. 2000;13:411–430. doi: 10.1016/s0893-6080(00)00026-5. [DOI] [PubMed] [Google Scholar]
- Jacobs J, Hawco C, Kobayashi E, Boor R, LeVan P, Stephani U, Siniatchkin M, Gotman J. Variability of the hemodynamic response as a function of age and frequency of epileptic discharge in children with epilepsy. NeuroImage. 2008;40:601–614. doi: 10.1016/j.neuroimage.2007.11.056. [DOI] [PMC free article] [PubMed] [Google Scholar]
- Jacobs J, LeVan P, Moeller F, Boor R, Stephani U, Gotman J, Siniatchkin M. Hemodynamic changes preceding the interictal EEG spike in patients with focal epilepsy investigated using simultaneous EEG-fMRI. NeuroImage. 2009;45:1220–1231. doi: 10.1016/j.neuroimage.2009.01.014. [DOI] [PubMed] [Google Scholar]
- Keller S, Roberts N. Voxel-based morphometry of temporal lobe epilepsy: an introduction and review of the literature. Epilepsia. 2008;49:741–757. doi: 10.1111/j.1528-1167.2007.01485.x. [DOI] [PubMed] [Google Scholar]
- Kobayashi E, Hawco C, Grova C, Dubeau F, Gotman J. Widespread and intense BOLD changes during brief focal electrographic seizures. Neurology. 2006;66:1049–1055. doi: 10.1212/01.wnl.0000204232.37720.a4. [DOI] [PubMed] [Google Scholar]
- Kothare S, VanLandingham K, Armon C, Luther J, Friedman A, Radtke R. Seizure onset from periventricular nodular heterotopias: depth-electrode study. Neurology. 1998;51:1723–1727. doi: 10.1212/wnl.51.6.1723. [DOI] [PubMed] [Google Scholar]
- Kruggel F, Pelegrini-Issac M, Benali H. Estimating the effective degrees of freedom in univariate multiple regression analysis. Med Image Anal. 2002;6:63–75. doi: 10.1016/s1361-8415(01)00052-4. [DOI] [PubMed] [Google Scholar]
- Laufs H, Hamandi K, Salek-Haddadi A, Kleinschmidt A, Duncan J, Lemieux L. Temporal lobe interictal epileptic discharges affect cerebral activity in “default mode” brain regions. Hum Brain Mapp. 2007;28:1023–1032. doi: 10.1002/hbm.20323. [DOI] [PMC free article] [PubMed] [Google Scholar]
- Lemieux L, Salek-Haddadi A, Lund T, Laufs H, Carmichael D. Modelling large motion events in fMRI studies of patients with epilepsy. Magn Reson Imaging. 2007;25:894–901. doi: 10.1016/j.mri.2007.03.009. [DOI] [PubMed] [Google Scholar]
- Lemieux L, Laufs H, Carmichael D, Paul J, Walker M, Duncan J. Noncanonical spike-related BOLD responses in focal epilepsy. Hum Brain Mapp. 2008;29:329–345. doi: 10.1002/hbm.20389. [DOI] [PMC free article] [PubMed] [Google Scholar]
- LeVan P, Gotman J. Independent component analysis as a model-free approach for the detection of BOLD changes related to epileptic spikes: a simulation study. Hum Brain Mapp. 2009;30:2021–2031. doi: 10.1002/hbm.20647. [DOI] [PMC free article] [PubMed] [Google Scholar]
- Liu R, Lemieux L, Bell G, Hammers A, Sisodiya S, Bartlett P, Shorvon S, Sander J, Duncan J. Progressive neocortical damage in epilepsy. Ann Neurol. 2003;53:312–324. doi: 10.1002/ana.10463. [DOI] [PubMed] [Google Scholar]
- Mai R, Tassi L, Cossu M, Francione S, Lo Russo, Garbelli R, Ferrario A, Galli C, Taroni F, Citterio A, Spreafico R. A neuropathological, stereo-EEG, and MRI study of subcortical band heterotopia. Neurology. 2003;60:1834–1838. doi: 10.1212/01.wnl.0000065884.61237.24. [DOI] [PubMed] [Google Scholar]
- Marsh L, Morrell M, Shear P, Sullivan E, Freeman H, Marie A, Lim K, Pfefferbaum A. Cortical and hippocampal volume deficits in temporal lobe epilepsy. Epilepsia. 1997;38:576–587. doi: 10.1111/j.1528-1157.1997.tb01143.x. [DOI] [PubMed] [Google Scholar]
- McKeown M, Makeig S, Brown G, Jung T, Kindermann S, Bell A, Sejnowski T. Analysis of fMRI data by blind separation into independent spatial components. Hum Brain Mapp. 1998;6:160–188. doi: 10.1002/(SICI)1097-0193(1998)6:3<160::AID-HBM5>3.0.CO;2-1. [DOI] [PMC free article] [PubMed] [Google Scholar]
- Menz M, Neumann J, Muller K, Zysset S. Variability of the BOLD response over time: an examination of within-session differences. NeuroImage. 2006;32:1185–1194. doi: 10.1016/j.neuroimage.2006.06.003. [DOI] [PubMed] [Google Scholar]
- Moeller F, Siebner H, Wolff S, Muhle H, Boor R, Granert O, Jansen O, Stephani U, Siniatchkin M. Changes in activity of striato-thalamo-cortical network precede generalized spike wave discharges. NeuroImage. 2008;39:1839–1849. doi: 10.1016/j.neuroimage.2007.10.058. [DOI] [PubMed] [Google Scholar]
- Morrell F, Whisler W, Hoeppner T, Smith M, Kanner A, Pierre-Louis S, Chez M, Hasegawa H. Electrophysiology of heterotopic gray matter in the “double cortex” syndrome. Epilepsia. 1992;33:76. [Google Scholar]
- Palmini A, Gambardella A, Andermann F, Dubeau F, da Costa J, Olivier A, Tampieri D, Gloor P, Quesney F, Andermann E. Intrinsic epileptogenicity of human dysplastic cortex as suggested by corticography and surgical results. Ann Neurol. 1995;37:476–487. doi: 10.1002/ana.410370410. [DOI] [PubMed] [Google Scholar]
- Porter B, Brooks-Kayal A, Golden J. Disorders of cortical development and epilepsy. Arch Neurol. 2002;59:361–365. doi: 10.1001/archneur.59.3.361. [DOI] [PubMed] [Google Scholar]
- Raichle M, MacLeod A, Snyder A, Powers W, Gusnard D, Shulman G. A default mode of brain function. Proc Natl Acad Sci U S A. 2001;98:676–682. doi: 10.1073/pnas.98.2.676. [DOI] [PMC free article] [PubMed] [Google Scholar]
- Rodionov R, De Martino F, Laufs H, Carmichael D, Formisano E, Walker M, Duncan J, Lemieux L. Independent component analysis of interictal fMRI in focal epilepsy: comparison with general linear model-based EEG-correlated fMRI. NeuroImage. 2007;38:488–500. doi: 10.1016/j.neuroimage.2007.08.003. [DOI] [PubMed] [Google Scholar]
- Rosenow F, Luders H. Presurgical evaluation of epilepsy. Brain. 2001;124:1683–1700. doi: 10.1093/brain/124.9.1683. [DOI] [PubMed] [Google Scholar]
- Salek-Haddadi A, Merschhemke M, Lemieux L, Fish D. Simultaneous EEG-correlated ictal fMRI. NeuroImage. 2002;16:32–40. doi: 10.1006/nimg.2002.1073. [DOI] [PubMed] [Google Scholar]
- Salek-Haddadi A, Diehl B, Hamandi K, Merschhemke M, Liston A, Friston K, Duncan J, Fish D, Lemieux L. Hemodynamic correlates of epileptiform discharges: an EEG-fMRI study of 63 patients with focal epilepsy. Brain Res. 2006;1088:148–166. doi: 10.1016/j.brainres.2006.02.098. [DOI] [PubMed] [Google Scholar]
- Seidenberg M, Kelly K, Parrish J, Geary E, Dow C, Rutecki P, Hermann B. Ipsilateral and contralateral MRI volumetric abnormalities in chronic unilateral temporal lobe epilepsy and their clinical correlates. Epilepsia. 2005;46:420–430. doi: 10.1111/j.0013-9580.2005.27004.x. [DOI] [PubMed] [Google Scholar]
- Smith S. Fast robust automated brain extraction. Hum Brain Mapp. 2002;17:143–155. doi: 10.1002/hbm.10062. [DOI] [PMC free article] [PubMed] [Google Scholar]
- Smith S, Jenkinson M, Woolrich M, Beckmann C, Behrens T, Johansen-Berg H, Bannister P, De Luca M, Drobnjak I, Flitney D, Niazy R, Saunders J, Vickers J, Zhang Y, De Stefano N, Brady J, Matthews P. Advances in functional and structural MR image analysis and implementation as FSL. NeuroImage. 2004;23 (Suppl 1):S208–S219. doi: 10.1016/j.neuroimage.2004.07.051. [DOI] [PubMed] [Google Scholar]
- Sperling M, O’Connor M. Auras and subclinical seizures: characteristics and prognostic significance. Ann Neurol. 1990;28:320–328. doi: 10.1002/ana.410280304. [DOI] [PubMed] [Google Scholar]
- Srivastava G, Crottaz-Herbette S, Lau K, Glover G, Menon V. ICA-based procedures for removing ballistocardiogram artifacts from EEG data acquired in the MRI scanner. NeuroImage. 2005;24:50–60. doi: 10.1016/j.neuroimage.2004.09.041. [DOI] [PubMed] [Google Scholar]
- Tassi L, Colombo N, Cossu M, Mai R, Francione S, Lo Russo, Galli C, Bramerio M, Battaglia G, Garbelli R, Meroni A, Spreafico R. Electroclinical, MRI and neuropathological study of 10 patients with nodular heterotopia, with surgical outcomes. Brain. 2005;128:321–337. doi: 10.1093/brain/awh357. [DOI] [PubMed] [Google Scholar]
- Thomas C, Harshman R, Menon R. Noise reduction in BOLD-based fMRI using component analysis. NeuroImage. 2002;17:1521–1537. doi: 10.1006/nimg.2002.1200. [DOI] [PubMed] [Google Scholar]
- Tyvaert L, Hawco C, Kobayashi E, LeVan P, Dubeau F, Gotman J. Different structures involved during ictal and interictal epileptic activity in malformations of cortical development: an EEG-fMRI study. Brain. 2008;131:2042–2060. doi: 10.1093/brain/awn145. [DOI] [PMC free article] [PubMed] [Google Scholar]
- Wolf H, Roos D, Blumcke I, Pietsch T, Wiestler O. Perilesional neurochemical changes in focal epilepsies. Acta Neuropathol. 1996;91:376–384. doi: 10.1007/s004010050439. [DOI] [PubMed] [Google Scholar]
- Worsley K, Friston K. Analysis of fMRI time-series revisited—again. NeuroImage. 1995;2:173–181. doi: 10.1006/nimg.1995.1023. [DOI] [PubMed] [Google Scholar]
- Worsley K, Liao C, Aston J, Petre V, Duncan G, Morales F, Evans A. A general statistical analysis for fMRI data. NeuroImage. 2002;15:1–15. doi: 10.1006/nimg.2001.0933. [DOI] [PubMed] [Google Scholar]
- Yang Z, Laconte S, Weng X, Hu X. Ranking and averaging independent component analysis by reproducibility (RAICAR) Hum Brain Mapp. 2008;29:711–725. doi: 10.1002/hbm.20432. [DOI] [PMC free article] [PubMed] [Google Scholar]
- Zangaladze A, Nei M, Liporace J, Sperling M. Characteristics and clinical significance of subclinical seizures. Epilepsia. 2008;49:2016–2021. doi: 10.1111/j.1528-1167.2008.01672.x. [DOI] [PubMed] [Google Scholar]
- Zijlmans M, Huiskamp G, Hersevoort M, Seppenwoolde J, van Huffelen A, Leijten F. EEG-fMRI in the preoperative work-up for epilepsy surgery. Brain. 2007;130:2343–2353. doi: 10.1093/brain/awm141. [DOI] [PubMed] [Google Scholar]
Associated Data
This section collects any data citations, data availability statements, or supplementary materials included in this article.