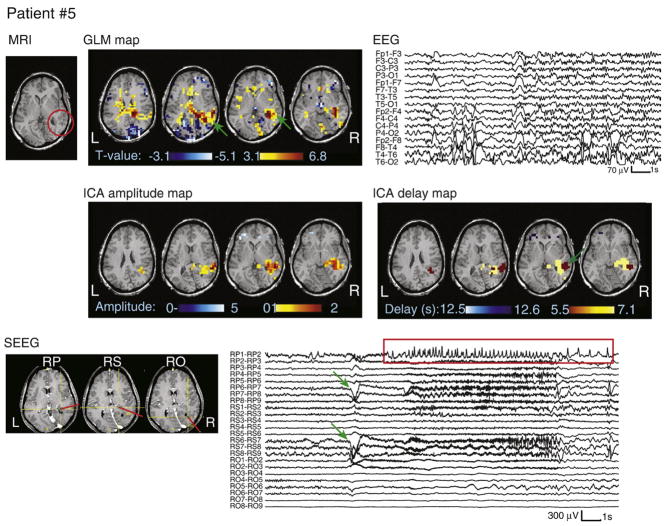
Fig. 4.
MRI, EEG, SEEG, and analysis results for patient #5. The heterotopia is circled in red on the MRI. SEEG electrode labels are numbered from the deepest (#1) to the most superficial contact (#9). The ictal onset time and location are indicated by green arrows on the SEEG trace and GLM map, with propagated activity shown in the red rectangle. Note that the color scale on the ICA delay map represents HRF peak timing, with the earliest activation also indicated by a green arrow.

