
Fig. 5.
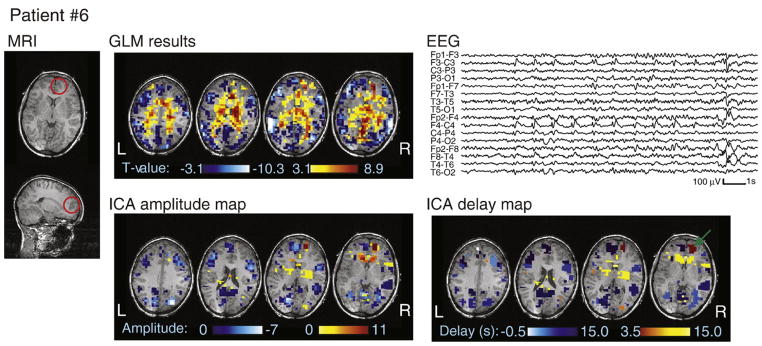
MRI, EEG, and analysis results for patient #6. The dysplasia is circled in red on the MRI. Note that the color scale on the ICA delay map represents HRF peak timing, with the earliest activation indicated by a green arrow.
Official websites use .gov
A
.gov website belongs to an official
government organization in the United States.
Secure .gov websites use HTTPS
A lock (
) or https:// means you've safely
connected to the .gov website. Share sensitive
information only on official, secure websites.
MRI, EEG, and analysis results for patient #6. The dysplasia is circled in red on the MRI. Note that the color scale on the ICA delay map represents HRF peak timing, with the earliest activation indicated by a green arrow.