Abstract
Introduction:
Glaucoma is a progressive disorder and requires serial evaluation in order to monitor disease progression and optimize therapy.
Objective:
The objective of this study was to determine the correlation between each of cup/disc (C/D) ratio and the disc damage likelihood scale (DDLS) with retinal nerve fiber layer (RNFL) and global indices in Humphrey field analyzer II (HFA II).
Design:
Cross-sectional study.
Materials and Methods:
A total of 50 patients diagnosed with primary open angle glaucoma were examined to grade DDLS score and C/D ratio. The average (avg) RNFL was obtained using the Fast RNFL protocol on optical coherence tomography (OCT) (4.0.2 Carl Zeiss). HFA II Swedish Interactive Threshold Algorithm Standard 24-2 visual fields were obtained within 1 month of clinical examination. The correlation of C/D ratio with avg RNFL thickness, Mean deviation and Pattern standard deviation was calculated by Pearson correlation coefficient (r). Similar coefficients were obtained for DDLS.
Results:
The P value for the difference in the r between C/D ratio with RNFL (−0.628) and DDLS with RNFL (−0.8369) was significant (P < 0.01) when correlation of C/D, DDLS with RNFL was considered.
Conclusion:
The DDLS shows stronger correlation with structural changes in OCT than C/D ratio. The disc diameter and rim width increases the value of clinical optic disc examination.
Keywords: Cup/disc ratio, disc damage likelihood scale, retinal nerve fiber layer thickness, visual field
Introduction
Glaucoma is a progressive optic neuropathy characterized by loss of retinal ganglion cells and manifest clinically as loss of optic disc neuro-retinal rim tissue, localized and/or diffuse defects of retinal nerve fiber layer (RNFL) and deficits in functional visual field testing (VF). Optic disc evaluation is essential for the diagnosis as well as follow-up of glaucoma patients. The cup/disc (C/D) ratio was introduced by Armaly[1,2] as a standardized method to evaluate optic nerve head and communicate the same. The larger the C/D ratio, more severe the field damage.[3,4] However, the C/D ratio does not take into consideration the diameter of the optic disc nor does it directly describe the focal changes in the neuroretinal rim. It has been long recognized that focal rim loss, particularly in the vertical poles of the disc are characteristic of glaucoma.[5,6] Several investigators have pointed out that small discs have fewer nerve fibers and smaller C/D ratio than larger discs.[7,8,9] The neuroretinal rim area reflect the number of ganglion cell axons passing through the optic disc and outperforms the C/D ratio in its correlation with visual function.
The disc damage likelihood scale (DDLS) was devised by Bayer et al. to incorporate the evaluation of disc size and rim width in clinical grading of the disc.[10] It has high inter observer reproducibility and correlates strongly with a degree of glaucomatous VF damage.[10,11]
Optic disc evaluation and estimation of retinal nerve fiber loss has been automated with a variety of instruments including optical coherence tomography (OCT). OCT provides quantitative assessments of the retina and optic nerve by measuring the echo time delay and the intensity of back scattered light from posterior segment structures.[12,13,14,15,16] Good correlation has been reported between peripapillary RNFL thickness measured by OCT and visual function[15,17,18,19,20] as well as histological measurements of RNFL thickness.[21]
The objective of the study was to determine the correlation between each of C/D ratios and the DDLS with RNFL and global indices in Humphrey field analyzer II.
Design
Cross-sectional study.
Patient selection
After informed consent, 50 patients were enrolled from the glaucoma clinic in a tertiary center. Each patient had a diagnosis of glaucoma (44) and 6 were normal patients. The diagnosis was based on full clinical evaluation including medical and ophthalmic history, slit lamp examination, intraocular pressure, gonioscopy, fundoscopy, and Standard Automated Perimetry Swedish Interactive Threshold Algorithm (SITA) Standard 24-2.
Inclusion criteria include best corrected visual acuity of at least 20/200 (6/60), anterior chamber angle open, reliable automated perimetry, and informed consent by the patient.
Exclusion criteria include spherical errors >5 diopters and cylinder >2.5 diopters, concomitant ocular disease leading to raised intraocular pressure, contact lens wearer, cloudy optic media that interferes with fundus examination, history of neurological diseases, ocular trauma and patients with intraocular surgery for less than 3 months.
Normal eyes were defined as those with no family history of glaucoma in the first degree relative, no history or evidence of intraocular surgery and no retinal pathological features. Normal eyes had best corrected visual acuity of 20/40 or better with refractive error between +3.00 D and −6.00 D, normal appearing optic nerve head and normal VF tests.
Glaucomatous eyes had abnormal VF test results with evidence of glaucomatous optic neuropathy. Glaucomatous optic neuropathy was defined as asymmetry between fellow eyes of 0.2, rim thinning, notching, and excavation or RNFL defects.
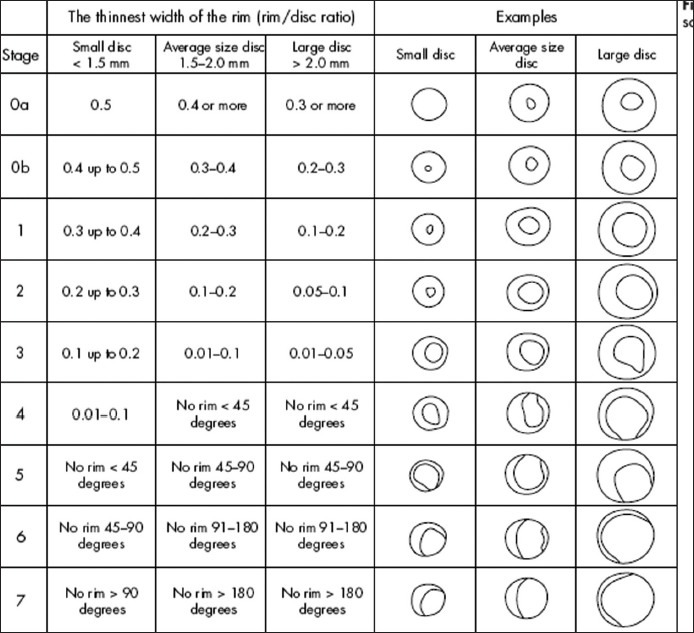
An abnormal VF test was defined as an abnormal glaucoma hemifield test (outside normal limits) and at least three points in the same hemifield that exceeded a probability value of 0.5% in the pattern deviation plot and an optic disc that was judged to be compatible with glaucoma and the degree and type of VF damage in that eye. In addition, there could be no signs of other diseases of the retina or optic nerve that could lead to the disc or field findings. Two glaucoma specialists independently evaluated the optic disc of patients and determined the C/D ratio and DDLS score using 78 diopter Volk noncontact fundus lens at the slit lamp. The readings were repeated at two different occasions within a span of two weeks. The DDLS was determined by drawing of the disc, the narrowest rim-to-disc ratio, the size of the disc, and the DDLS nomogram. If the nerve is smaller or larger than average (avg), the DDLS score was adjusted appropriately. The disc was staged from stage 1 to 10 as read from DDLS table [Figure 1].
Figure 1.

Disc damage likelihood scale
VFs were performed with SITA-Standard 24-2 within a month of clinical assessment. An observer masked to findings of the clinical examination and diagnosis recorded mean deviation (MD) and pattern standard deviation (PSD). Each eye was examined using OCT 3000 Version 4.0.2 Carl Zeiss using the fast RNFL protocol on the second day of examination.
Exclusion criteria was eyes having coexisting ocular disease, refractive error exceeding ± 5.00 dioptres and or ± 2.00 cylinders, peripapillary atrophy exceeding 1.7 mm from the optic disc center, intraocular surgery within last 3 months and unreliable perimetry.
Poor quality OCT images (with both eyes below five signal strength, unfocussed, poorly centered) were excluded.
OCT parameters used were avg, superior and inferior RNFL thickness.
Pearson correlation coefficients are performed by using the SSPS 14.0 Windows. The correlations are compared by standardized normal test.
Results
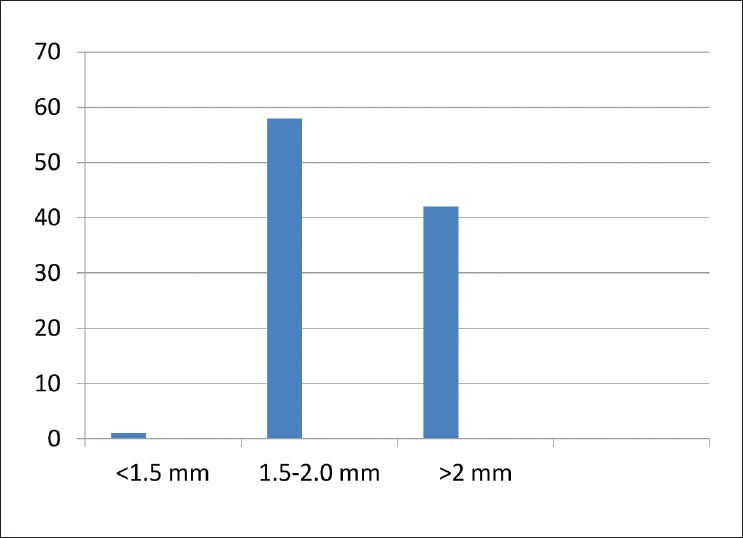
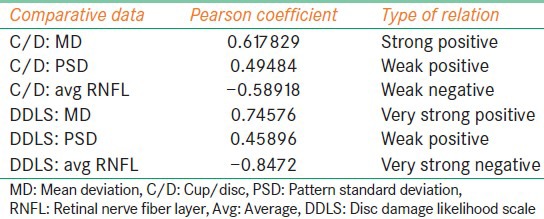
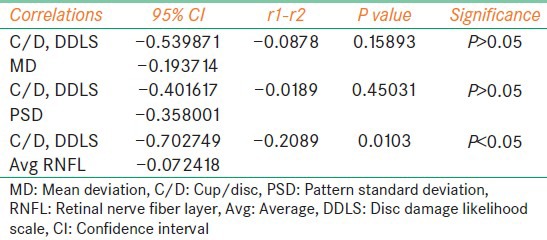
Our study included 27 females and 23 males. The mean age of the patients were 52.98 years [standard deviation (SD) =9.798]. The optic disc sizes were in ranges from 1.5 mm to 2.5 mm with avg vertical disc size 2.0307 mm (SD = 0.2311) [Figure 2]. Pearson coefficient was performed for following combinations - C/D versus MD, C/D versus PSD, C/D versus avg RNFL thickness, DDLS versus MD, DDLS versus PSD and DDLS versus avg RNFL thickness. The strongest negative correlation was found between DDLS and avg RNFL thickness and strongest positive correlation was found between DDLS and MD [Table 1]. In order to determine whether the difference in correlations between pairs were significant we did standardized normal test using the software available on internet (SISA). We found difference between correlations of C/D and MD versus DDLS and MD were not statistically significant (P = 0.99139). Similarly, PSD did not show statistical significance (P = 0.32364). The difference of correlation of C/D and avg RNFL versus DDLS and avg RNFL thickness was statistically significant (P = 0.00005) [Table 2]. The interobserver reproducibility was 67% for C/D and 71% for DDLS.
Figure 2.

Disc size variation among the study patients
Table 1.
The strength of correlation between different parameters

Table 2.
Summary of P values, confidence intervals of correlation coefficients

Discussion
Our results demonstrate that DDLS shows strong positive correlation with MD in VFs and strong negative correlation in RNFL thickness when compared to C/D ratio. The C/D ratio does not take into consideration the optic disc size. Hence, large discs which are likely to have larger C/D ratio (but may have normal neuroretinal rims) are more likely to be classified as glaucomatous while small C/D ratio are more likely to be classified as normal whether they actually have glaucoma or not.
Caprioli et al. demonstrated that neuroretinal rim area correlates more strongly with field damage than C/D ratio or cup volume.[7] The two major advantages of DDLS are, firstly it considers the disc size and secondly it focuses on the neuroretinal rim tissue thinning. Consideration of the disc size is central to the process of DDLS grading. This adjusts for the rim size categorizing into small, medium, and large discs.
DDLS has limitations. It is theoretically possible that a patient with static DDLS may have continuing damage, for example if focal thinning of the disc was followed by generalized atrophy. However, detailed drawing of the optic disc at every visit and longitudinal follow-up with other modalities help to overcome this limitation. This method requires some effort to learn and is best carried out with the table of stages at hand during slit lamp evaluation of the optic disc.
In our study, we found a stronger correlation of DDLS with MD in VFs (−0.7958) than between C/D ratio with M.D (−0.708). Garway-Heath has pointed out that when both structural and functional measures are plotted on a logarithmic scale (or both on linear scales) the structure and function relation appears to be linear.[2] This is contrary to the curvilinear relation found in earlier studies.[3,4]
James C Bobrow conducted a correlation of DDLS with VFs and found a similar correlation (−0.68).[22] Danesh-Meyer et al. did a similar scatter plot relation between MD of the VF and DDLS r = −0.62.[6] (statistically similar to our results). They found DDLS staging system to be superior to C/D ratio as clinical approach to the optic disc evaluation. Their data showed the correlation between Hiedelberg Retina Tomograph (HRT) parameters and VF defects of only 0.5-0.6. It was explained that only axon loss is correlated directly with functional loss and it is therefore likely that there always will be moderate variation in the relationship of disc topography to VF defect. Therefore, imaging technologies that enumerate nerve fiber layer thickness away from disc such as OCT will correlate better with VF than disc tomography.[7]
A number of studies have compared the diagnostic accuracy of Stratus OCT, GDx VCC and HRT II and found no significant differences among the largest areas under the Receiver Operating Curves(ROC) curves among different imaging modalities.[8,9]
Our study aimed to find whether the structural loss mapped in fast RNFL thickness protocol of Stratus OCT was better correlated with DDLS grading than with C/D ratio. We found significant difference between the correlations proving the DDLS grading superior to C/D ratio in documenting the structural damage.
Majid et al. studied 149 eyes from 149 patients who were categorized as normal, glaucoma suspect or with glaucoma. The patients were examined with OCT and graded with DDLS staging and they found the DDLS had the best predictive power (0.917) and showed a close correlation with VF, C/D ratio and OCT parameters.
The system of DDLS staging would get better appraisal as to its clinical use in longitudinal study where it can document progression better than C/D ratio. To our knowledge, this is the first study correlating DDLS, C/D ratio, VF defect with avg RNFL thickness in Stratus OCT.
Footnotes
Source of Support: Nil
Conflict of Interest: None declared.
References
- 1.Armaly MF. Genetic determination of cup/disc ratio of the optic nerve. Arch Ophthalmol. 1967;78:35–43. doi: 10.1001/archopht.1967.00980030037007. [DOI] [PubMed] [Google Scholar]
- 2.Armaly MF, Sayegh RE. The cup-disc ratio. The findings of tonometry and tonography in the normal eye. Arch Ophthalmol. 1969;82:191–6. doi: 10.1001/archopht.1969.00990020193008. [DOI] [PubMed] [Google Scholar]
- 3.Douglas GR, Drance SM, Schulzer M. A correlation of fields and discs in open angle glaucoma. Can J Ophthalmol. 1974;9:391–8. [PubMed] [Google Scholar]
- 4.Hart WM, Jr, Yablonski M, Kass MA, Becker B. Multivariate analysis of the risk of glaucomatous visual field loss. Arch Ophthalmol. 1979;97:1455–8. doi: 10.1001/archopht.1979.01020020117005. [DOI] [PubMed] [Google Scholar]
- 5.Kirsch RE, Anderson DR. Clinical recognition of glaucomatous cupping. Am J Ophthalmol. 1973;75:442–54. doi: 10.1016/0002-9394(73)91153-7. [DOI] [PubMed] [Google Scholar]
- 6.Danesh-Meyer HV, Gaskin BJ, Jayusundera T, Donaldson M, Gamble GD. Comparison of disc damage likelihood scale, cup to disc ratio, and Heidelberg retina tomograph in the diagnosis of glaucoma. Br J Ophthalmol. 2006;90:437–41. doi: 10.1136/bjo.2005.077131. [DOI] [PMC free article] [PubMed] [Google Scholar]
- 7.Caprioli J. Discrimination between normal and glaucomatous eyes. Invest Ophthalmol Vis Sci. 1992;33:153–9. [PubMed] [Google Scholar]
- 8.Jonas JB, Schmidt AM, Müller-Bergh JA, Schlötzer-Schrehardt UM, Naumann GO. Human optic nerve fiber count and optic disc size. Invest Ophthalmol Vis Sci. 1992;33:2012–8. [PubMed] [Google Scholar]
- 9.Quigley HA, Coleman AL, Dorman-Pease ME. Larger optic nerve heads have more nerve fibers in normal monkey eyes. Arch Ophthalmol. 1991;109:1441–3. doi: 10.1001/archopht.1991.01080100121056. [DOI] [PubMed] [Google Scholar]
- 10.Bayer A, Harasymowycz P, Henderer JD, Steinmann WG, Spaeth GL. Validity of a new disk grading scale for estimating glaucomatous damage: Correlation with visual field damage. Am J Ophthalmol. 2002;133:758–63. doi: 10.1016/s0002-9394(02)01422-8. [DOI] [PubMed] [Google Scholar]
- 11.Henderer JD, Liu C, Kesen M, Altangerel U, Bayer A, Steinmann WC, et al. Reliability of the disk damage likelihood scale. Am J Ophthalmol. 2003;135:44–8. doi: 10.1016/s0002-9394(02)01833-0. [DOI] [PubMed] [Google Scholar]
- 12.Sommer A, Katz J, Quigley HA, Miller NR, Robin AL, Richter RC, et al. Clinically detectable nerve fiber atrophy precedes the onset of glaucomatous field loss. Arch Ophthalmol. 1991;109:77–83. doi: 10.1001/archopht.1991.01080010079037. [DOI] [PubMed] [Google Scholar]
- 13.Quigley HA, Katz J, Derick RJ, Gilbert D, Sommer A. An evaluation of optic disc and nerve fiber layer examinations in monitoring progression of early glaucoma damage. Ophthalmology. 1992;99:19–28. doi: 10.1016/s0161-6420(92)32018-4. [DOI] [PubMed] [Google Scholar]
- 14.Tuulonen A, Lehtola J, Airaksinen PJ. Nerve fiber layer defects with normal visual fields. Do normal optic disc and normal visual field indicate absence of glaucomatous abnormality? Ophthalmology. 1993;100:587–97. doi: 10.1016/s0161-6420(93)31598-8. [DOI] [PubMed] [Google Scholar]
- 15.Harwerth RS, Carter-Dawson L, Shen F, Smith EL, 3rd, Crawford ML. Ganglion cell losses underlying visual field defects from experimental glaucoma. Invest Ophthalmol Vis Sci. 1999;40:2242–50. [PubMed] [Google Scholar]
- 16.Kerrigan-Baumrind LA, Quigley HA, Pease ME, Kerrigan DF, Mitchell RS. Number of ganglion cells in glaucoma eyes compared with threshold visual field tests in the same persons. Invest Ophthalmol Vis Sci. 2000;41:741–8. [PubMed] [Google Scholar]
- 17.Budenz DL, Michael A, Chang RT, McSoley J, Katz J. Sensitivity and specificity of the Stratus OCT for perimetric glaucoma. Ophthalmology. 2005;112:3–9. doi: 10.1016/j.ophtha.2004.06.039. [DOI] [PubMed] [Google Scholar]
- 18.Medeiros FA, Zangwill LM, Bowd C, Weinreb RN. Comparison of the GDx VCC scanning laser polarimeter, HRT II confocal scanning laser ophthalmoscope, and stratus OCT optical coherence tomograph for the detection of glaucoma. Arch Ophthalmol. 2004;122:827–37. doi: 10.1001/archopht.122.6.827. [DOI] [PubMed] [Google Scholar]
- 19.Medeiros FA, Zangwill LM, Bowd C, Vessani RM, Susanna R, Jr, Weinreb RN. Evaluation of retinal nerve fiber layer, optic nerve head, and macular thickness measurements for glaucoma detection using optical coherence tomography. Am J Ophthalmol. 2005;139:44–55. doi: 10.1016/j.ajo.2004.08.069. [DOI] [PubMed] [Google Scholar]
- 20.Hougaard JL, Heijl A, Bengtsson B. Glaucoma detection using different Stratus optical coherence tomography protocols. Acta Ophthalmol Scand. 2007;85:251–6. doi: 10.1111/j.1600-0420.2006.00826.x. [DOI] [PubMed] [Google Scholar]
- 21.Hougaard JL, Ostenfeld C, Heijl A, Bengtsson B. Modelling the normal retinal nerve fibre layer thickness as measured by Stratus optical coherence tomography. Graefes Arch Clin Exp Ophthalmol. 2006;244:1607–14. doi: 10.1007/s00417-006-0372-9. [DOI] [PubMed] [Google Scholar]
- 22.Spaeth GL, Henderer J, Liu C, Kesen M, Altangerel U, Bayer A, Katz LJ, Myers J, Rhee D, Steinmann W. The disc damage likelihood scale: reproducibility of a new method of estimating the amount of optic nerve damage caused by glaucoma. (185-6).Trans Am Ophthalmol Soc. 2002;100:181–5. discussion. [PMC free article] [PubMed] [Google Scholar]


