

Abstract
The risk of hip fracture rises rapidly with age, and is notably higher in women. After falls and prior fragility fractures, the main clinically recognized risk factor for hip fracture is reduced bone density. To better understand the extent to which femoral neck density and structure change with age in each sex, we have carried out a longitudinal study in subjects not treated with agents known to influence bone mineral density to investigate changes in regional cortical thickness, as well as cortical and trabecular bone mineral density at the mid-femoral neck. Segmental QCT analysis was used to assess bone measurements in two anatomic sub-regions, the supero-lateral (superior) and infero-medial (inferior). A total of 400 older individuals (100 men and 300 women, aged 66–90 years) who were participants in the AGES-Reykjavik study, were studied. Participants had two QCT scans of the hip over a median follow-up of 5.1 yr. (mean baseline age 74 yr.). Changes in bone values during follow-up were estimated from mixed effects regression models. At baseline women had lower bone values in the superior region than men. At follow-up all bone values were lower in women, except cortical vBMD inferiorly. The relative losses in all bone values estimated in the superior region were substantially (about threefold) and significantly greater compared to those estimated in the inferior region in both sexes. Women lost cortical thickness and cortical vBMD more rapidly than men in both regions; and this was only weakly reflected in total femoral neck DXA-like results. The higher rate of bone loss in women at critical locations may contribute materially to the greater femoral neck fracture incidence among women than men.
Keywords: Cortical thickness, proximal end of femur, aging, longitudinal, QCT
Introduction
The number of hip fractures is increasing worldwide, in part due to rapidly aging populations with greater survival (1). There is a long-standing interest in femoral bone loss with advancing age because of its association with hip fracture, the most clinically serious osteoporotic fracture in the elderly which can lead to permanent disability and death (2). While trochanteric fractures are clearly associated with low bone mass (3, 4), femoral neck fractures may have a somewhat different etiology. We previously found evidence that cortical thinning in the superior surface of the mid-femoral neck was important in determining resistance to femoral neck fracture in vivo (5).
Bone is lost from all parts of the skeleton with advancing age but to different degrees. Both cross-sectional and longitudinal studies have reported age-related bone loss in men and women (6–11). The loss of bone begins earlier and proceeds faster in women than men. Longitudinal studies have also shown a progressive loss of bone with age at the femoral neck in the elderly (12, 13). Marked thinning of the mid-femoral neck cortex with advancing age has been described in cross-sectional studies, both ex-vivo and in-vivo (14–16). In an ex-vivo cross-sectional study, trabecular bone mineral density (BMD) declined asymmetrically with age at the mid-femoral neck with the greatest change in the superior half (in an antero-posterior projection) (17). In another study, the same region of the neck displayed marked trabecular micro-architectural weakness in elderly women who had sustained a femoral neck fracture (18). These changes are important because in normal gait, the greatest stresses occur in the sub-capital and mid-femoral neck region, where maximum compressive stresses occur inferiorly. Superiorly, smaller magnitude tensile stresses occur during walking (19). On the other hand, during a sideways fall onto the greater trochanter the greatest compressive stresses and strains occur in the superior femoral neck while the lower tensile ones occur in the inferior region (19, 20).
No previous quantitative computed tomography (QCT) study has examined longitudinal change in regional cortical thickness and BMD measurements at the mid-femoral neck in both older men and women. We found in our cross-sectional study that variations in cortical thickness with age showed considerable sex differences (5). Women appeared to lose cortical thickness whereas men apparently maintained theirs. The bone decrement with age seemed to be different according to location within the femoral neck and appeared to be more substantial in the superior region. However, we could not exclude the possibility that these apparent changes with age were due to so-called cohort effects rather than age or time itself.
In this longitudinal study our primary aim was to investigate, using multi slice CT, change over 5 years in regional cortical thickness and cortical and trabecular BMD, each measured separately. We also assessed total (i.e., cortical plus trabecular) BMD and simulated-DXA-like changes at this location since QCT has been shown to be capable of reasonably accurate DXA simulation (21). The study cohort consisted of 100 men and 300 women aged 66–90 years from the population-based AGES-Reykjavik study with available two-hip QCT-scans taken 5 years apart. Segmental QCT analysis of the mid-femoral neck was applied to estimate cortical thickness and BMD measurements in the superior and inferior regions of the mid-neck, using an image analysis protocol that has been shown to be highly reproducible in location and not subject to anatomical drift with age (16).
Materials and methods
Study participants
Individuals were participants in the Age Gene/Environment Susceptibility-Reykjavik Study (AGES-Reykjavik), a single-center prospective population study of Icelandic men and women. Design and recruitment have been described in detail (10, 22). Baseline CT scans of 5500 individuals from this cohort were obtained between 2002 and 2006. Approximately 3300 individuals were rescanned about 5 years after the baseline measurements (2007–2011). Scans of a subset of 400 (100 men and 300 women) individuals were randomly selected for detailed quantitative analysis from the subgroup who had two QCT scans of the hip, had not sustained a hip fracture and not using medications known to affect bone density (see below). Otherwise there were no exclusions. The median follow-up time was 5.1 (SD: 0.15) years.
At the baseline visit, height and weight were measured and participants were asked to bring all medications used in the previous 2 weeks to the clinic representing current usage. Medications known to affect bone density: including estrogen replacement therapy, tibolone, antiepileptics, systemic glucocorticosteroids and agents for the treatment of osteoporosis (raloxifene, calcitonin or bisphosphonates), were identified. At baseline 8% (24) of women and 11% (11) of men suffered from type 2 diabetes mellitus. The weight was measured again at follow-up. At both baseline and follow-up, the time to walk 6 m at the participant's usual pace was recorded and in this study the average of baseline and follow-up walking time was used to represent the individual’s physical performance during the follow-up (Greater walking time is interpreted as a reduced physical performance). All participants provided written informed consent, and the study was approved (VSN 00-063) by the National Bioethics Committee in Iceland as well as the Institutional Review Board of the Intramural Research Program of the National Institute of Aging.
Quantitative computerized tomography (QCT) scanning and analysis
Imaging of the hips with CT was performed using a 4-row detector CT system (Sensation, Siemens Medical Systems, Erlangen, Germany), as described before in (5). To calibrate CT Hounsfield units to equivalent bone mineral concentrations, all subjects lay on a calibration phantom (Image Analysis, Columbia, KY, USA), which extended from a position superior to the L1 vertebral body to the mid-femoral shaft. The phantom contained calibration cells of 0, 75 and 150 mg/cm3 equivalent concentration of calcium hydroxyapatite. Scans were acquired using a standardized protocol and encompassed the proximal end of femur from a level 1 cm superior to the acetabulum to a level 3–5 mm inferior to the lesser trochanter at settings of 120 kVp, 140 mAs, 1-mm slice thickness, pitch=1, pixel size of 0.977 mm and 512×512 matrix in spiral reconstruction mode using the standard kernel with a 50-cm reconstruction field of view (FOV). The imaging centre uses highly stringent and reproducible daily quality assurance tests to monitor scanner stability based on a phantom test including measurements of slice geometry, spatial uniformity, density linearity, spatial resolution and noise. In addition the imaging centre performs weekly measurements to monitor density linearity of the calibration phantom described above. The scanner was calibrated monthly against water.
QCT-derived femoral neck measures
The CT images were processed to extract measures of volumetric BMD (vBMD), areal BMD (aBMD, DXA equivalent) and bone structure at the femoral neck using QCT PRO CTXA software (Mindways, Austin, Texas) according to a protocol described in more detail previously (5, 16) and briefly described below.
Bone segmentation
Automated segmentation of bone from soft-tissue voxels generated axial, coronal and sagittal reconstructions of the hip followed by 3D rendering and femoral neck axis placement. A region-growing algorithm classified each pixel as either “bone” or “not bone” using an adaptive classifier. A graphical user interface allowed the operator to optimize the reconstructed images in 3 planes of section: first to properly position the hip for cortical thickness and BMD measurements; then to trim excessive soft tissue pixels, fill artifactual bone holes and optimize the femoral neck axis on the 3D surface-rendered image. The baseline scan and the follow-up scan for each individual were analyzed together to ensure that the hip was properly positioned in both analyses. The analysis was done by a single observer.
Regional cortical thickness
A scripting command, written to extract automatically six contiguous cross-sectional slices of 1 mm thickness of the mid-femoral neck from a reproducible location for measurements, was used with the QCT PRO Bone Investigational Toolkit (BIT2) software (Mindways, Austin, Texas). The mid-femoral neck cross-section placement was automatically directed perpendicular to the femoral neck axis where the approximate ratio of maximum to minimum diameters equaled to 1.4: slice 6 in Fig. 1. Studies have shown that where the ratio of the distances between the superior to inferior (maximum) and anterior to posterior diameters (minimum) is 1.4, this region of the femoral neck has the lowest cross-sectional area and can be considered the mid-neck (23, 24). Five further slices were extracted at 1 mm intervals medially. The extracted images had an interpolated pixel size of 0.488 mm. Estimated cortical thickness (Est Ct.Th) at the mid-femoral neck was determined in two anatomical surfaces. The centre of area was the internal reference point, with 16 equal sectors defined by equal angles (22.5°) (to simulate anatomical stance) and the first sector boundary defined by a vertical line; see Fig. 1. In QCT PRO analysis, the anterior surface of the femur on the sagittal plane image is positioned vertically (to ensure reproducibility in a limited scan field). However, the anterior surface of the whole femur is canted anteriorly in stance (giving a mean angle of incidence of 22.5 degrees to the vertical) (25). Thus region division boundaries on cross sections of the mid-femoral neck required clockwise rotation (by 22.5 degrees, or one sector viewed towards the acetabulum) to ensure anatomic relevance when considering the femurs in “stance” (see Fig. 1, image to right). This resulted in two anatomical regions (Fig. 1): the superior surface (S: from sectors 14, 15, 16, 1, 2, 3, 4, 5), and the inferior surface (I: 6, 7, 8, 9, 10, 11, 12, 13). The cortical bone threshold was chosen at 450 mg/cm3 because this minimized differences from cortical thickness estimates made by higher resolution CT and histological methods (16, 26). Est Ct.Th was calculated for each of the 16 sectors as follows; the cortical area was measured automatically (by pixel counting) on each cross-sectional image. In each sector, the cortical bone mass was assumed to be evenly distributed between the two surface boundaries (periosteal and endosteal). The boundaries were approximated as concentric arcs of constant curvature, enclosing the cortical centre of mass. The software automatically selected two radii of curvature centred at the intersection point of the sector lines (one periosteal, the other endosteal) that matched the pixel counted cortical area. Est Ct.Th by superior and inferior surfaces was averaged across corresponding sectors and the data from the 6 cross-sections were used to derive a single mean estimate for each region.
Figure 1.
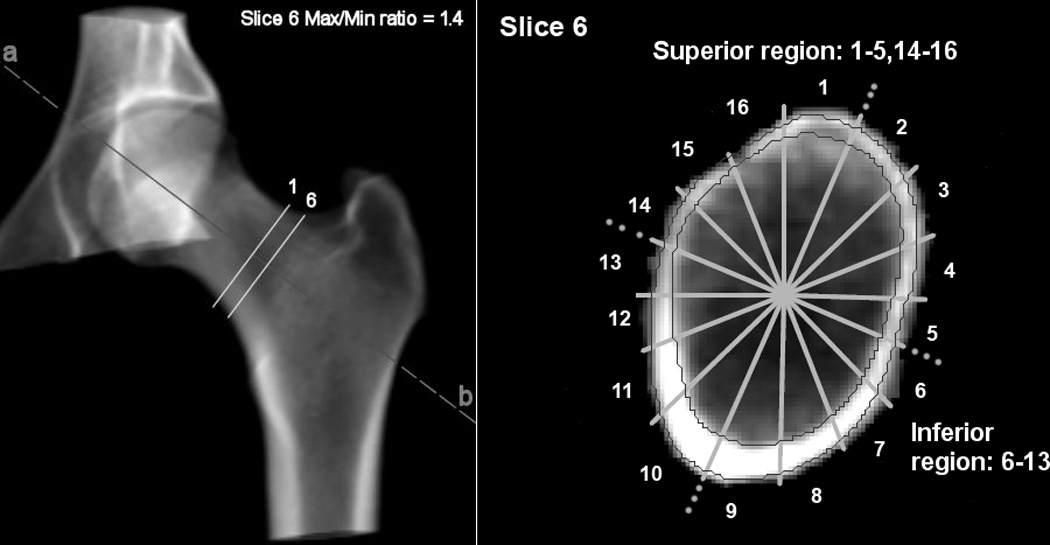
3D CT rendering (left) showing ROIs and Slice Position. Shape of FN at max/min ratio 1.4 (right) showing the superior and inferior region (note the clockwise shift of one sector due to sagittal positioning). The contours show the cortex.
To assess the in vivo reproducibility of our measurements, nine participants underwent a repeated CT scan after they got off the table and were then repositioned. The intra-observer variability of the Est Ct.Th measurements by regions was estimated using coefficient of variation (CV). The CVs were 4.8% for S Est Ct.Th and 1.9% for I Est Ct.Th.
vBMD measurements, DXA-equivalent femoral neck aBMD, and geometric measures
Volumetric BMD (vBMD) measurements (in mg/cm3) were derived for each segment. Cortical vBMD (Ct.vBMD) was calculated from the voxels classified as being within the cortex and trabecular vBMD (Tb.vBMD) from the remaining pixels interior to the endosteal cortical boundary. The total vBMD (Tt.vBMD), Ct.vBMD and Tb.vBMD values for the superior and inferior regions was averaged across corresponding sectors and the data from the 6 cross-sections were used to derive a single mean estimate for each region. The mean total vBMD for the mid-femoral neck (FN vBMD) was also estimated. The mean cross-sectional area (CSA) of the mid-femoral neck was estimated from the 6 cross-sections and defined as the area enclosed by the external bone perimeter. The mean density-weighted maximum and minimum cross-sectional moment of inertia (CSMImin, with respect to the longer axis; CSMImax, with respect to the shorter axis) was estimated for the mid-femoral neck (total bone). CSMI is defined by the integral sum of the products of individual bone pixel cross-sectional areas with the squares of their distances from the centroid. CSMI is proportional to the capacity of a cross-section to resist bending. DXA-equivalent BMD (in mg/cm2) for the total femoral neck aBMD (FN aBMD) was determined by the software. The CVs for these variables across the 6 cross-sections were 7.7% for S Tt.vBMD, 2.0% for I Tt.vBMD, 2.2% for S Ct.vBMD, 0.6% for I Ct.vBMD, 10.2% for S Tb.vBMD, 9% for I Tb.vBMD, 1.1% for FN Tt.vBMD, 2% for CSA and 0.8% for FN aBMD.
Statistical analyses
Since we aimed to measure rates of loss or gain of our measured variables in units of measurement and also to compare rates of change between regions with considerably different mean values, as well as between the two sexes, we performed linear regression analysis both on the untransformed and on natural log-transformed data. Random effects regression models were used to determine the average amount of change in study variables during follow-up for each participant. These random effects models accounted for between-subject variation and adjusted for within-subject correlations between repeated measurements. Thus each participant had a subject-specific intercept and slope. Time was modeled as time between the two measurements. The fixed effect in the models included the mean of baseline age and follow-up age. Changes are reported both as absolute changes and percent changes. The significance of difference between the sexes was tested by assessing the interaction between sex and time in each model. The effect of baseline height, baseline weight and weight change during follow-up was tested by adjusting for each variable separately in the models. Their interactions with time were also tested, but since these interactions were not significant and they did not affect the estimated average changes the results are not shown.
A participant was considered to have maintained or increased in Est Ct.Th and BMD during follow-up if the difference between follow-up and baseline measurement was ≥0. Student’s t-test was used to test for difference between those who maintained or increased and those who lost bone. The percentage loss in I Est Ct.Th across the weight change quartiles is reported graphically and the difference by quartiles was analyzed by one-way analysis of variance (ANOVA). The baseline and follow-up measurements for S Est Ct.Th, I Est Ct.Th and FN vBMD for each individual’s visits were plotted to provide a graphical representation of the variability in the loss. The partial correlation coefficients were estimated from linear regression. The percent difference between the sexes was estimated using linear regression analysis of the natural log-transformed outcome and having sex as a factor variable (table 1). The programs R 2.13.2 (R Foundation for Statistical Computing, Vienna, Austria) and SAS 9.2 (SAS Institute Inc, Cary, North Carolina, USA) were used for statistical analyses.
Table 1.
Baseline and follow-up characteristics of the participants, men n=100 and women n=300.
| Men (n=100) | Women (n=300) | Percent difference between men and women | ||||
|---|---|---|---|---|---|---|
| Mean (SD) | Mean (SD) | Mean (95%CI) | ||||
| Baseline | Follow-up | Baseline | Follow-up | Baseline | Follow-up | |
| Age (years) | 73.9 (4.4) | 78.9 (4.4) | 74.3 (5.2) | 79.4 (5.2) | - | - |
| Height (cm) | 176.0 (6.1) | - | 161.4 (5.2) | - | −8.3 (−9.0, −7.6)*** | - |
| Weight (kg) | 83.9 (12.9) | 83.5 (13.8) | 70.3 (11.3) | 69.3 (11.8) | −16.2 (−19.2, −13.2)*** | - |
| BMI (kg/m2) | 27.9 (3.5) | - | 27.0 (4.0) | - | - | - |
| Weight change (kg) | - | −0.4 (4.6) | - | −1.0 (5.3) | - | - |
| S Est Ct.Th (mm) | 1.21 (0.52) | 1.11 (0.51) | 0.93 (0.50) | 0.81 (0.49) | −25.0 (−33.1, −15.9)*** | −28.9 (, −37.2, −19.4)*** |
| I Est Ct.Th (mm) | 2.97 (0.53) | 2.90 (0.57) | 2.88 (0.56) | 2.76 (0.57) | - | −5.3 (−9.8, −0.7)* |
| Cross-sectional area (cm2) | 12.08 (1.30) | 12.02 (1.31) | 9.09 (1.05) | 9.12 (1.1) | −24.8 (−26.7, −22.8)*** | −24.2 (−26.2, −22.1)*** |
| CSMI min (mg/cm3 cm4) | 2974 (676) | 2870 (656) | 1557 (374) | 1485 (357) | −48.0 (−50.6,-45.2)*** | −48.5 (−51.2, −45.7)*** |
| CSMI max (mg/cm3 cm4) | 4122 (984) | 3977 (940) | 2195 (499) | 2107 (489) | −46.7 (−49.4, −43.9)*** | −47.1 (−49.7, −44.3)*** |
| S Tt.vBMD (mg/cm3) | 114 (37) | 110 (39) | 99 (41) | 85 (39) | −21.9 (−28.9, −14.1)*** | −30.5 (−36.2, −24.3)*** |
| I Tt.vBMD (mg/cm3) | 274 (42) | 269 (47) | 270 (56) | 257 (57) | - | −5.6 (−10.2, 0.7)* |
| S Ct.vBMD (mg/cm3) | 515 (70) | 501 (73) | 479 (84) | 455 (93) | −8.3 (−12.5, −3.8)** | −10.2 (−14.6, −5.8)*** |
| I Ct.vBMD (mg/cm3) | 712 (48) | 710 (48) | 727 (66) | 715 (72) | - | - |
| S Tb.vBMD (mg/cm3) | 64 (26) | 62 (27) | 55 (23) | 48 (23) | −14.1 (−19.7, −8.1)*** | −11.7 (−20.3, −2.3)* |
| I Tb.vBMD (mg/cm3) | 86 (32) | 84 (33) | 44 (32) | 41 (32) | −40.0 (−45.5, −29.4)*** | −44.1 (−51.1, −36.2)*** |
| FN vBMD (mg/ cm3) | 243 (34) | 245 (37) | 238 (44) | 226 (41) | - | −5.1 (−8.9, −1.2)* |
| FN aBMD (mg/cm2) | 827 (147) | 794 (156) | 725 (152) | 680 (140) | −12.7 (−16.7, −8.6)*** | −14.3 (−18.0, −10.4)*** |
p-values for sex differences
p<0.0001,
p<0.01,
p<0.05.
Results
Baseline and follow-up values
Characteristics of the cohort at baseline (dates 2002–2006) and at follow-up (2007–2011) are summarized in Table 1. The median time between baseline and follow-up was 5.1 years. Men and women were of similar age at baseline and as expected men were on average taller and heavier than women. At baseline men had on average higher bone values than women except at the inferior region of the mid-femoral neck, where Est Ct.Th, Tt.vBMD and Ct.vBMD were similar. At follow-up all bone values were lower in women with the striking exception of Ct.vBMD in the inferior surface. Men and women had similar total mid FN vBMD at baseline but total FN DXA-like was 13% lower in women at baseline. Body weight change during the follow-up was similar among men and women. Mid-FN cross-sectional area was unchanged during follow-up in both sexes.
Estimated changes in cortical thickness and bone mineral density at femoral neck
Longitudinal changes per year for men and women are summarized in table 2. All mean cortical thickness and BMD measurements declined significantly from baseline in both sexes, except Ct.vBMD in the inferior surface among men and Tb.vBMD in the inferior region in both men and women. The relative losses in Est Ct.Th and vBMD were substantial and significantly greater in the superior region compared to the inferior region in both sexes (p<0.02). Average changes in S Est Ct.Th were −1.6 %/year in men and −3.3%/year in women, contrasting with −0.5%/year and −0.9%/year respectively in I Est Ct.Th. The relative change in Tb.vBMD in the superior region was on average about threefold greater than the change in Ct.vBMD in the same region in both sexes. Changes in regional Tt.vBMD were broadly similar to changes in regional Est Ct.Th (Table 2). The relative decline in the mean density-weighted CSMI (total bone) for the mid-FN was 0.7–0.9 % per year and similar in both sexes.
Table 2.
Estimated longitudinal changes in CSA, CSMI, Est Ct.Th and BMD at femoral neck during the 5-year follow-up. Absolute changes per year (95CI) and percent changes per year (95%CI) are provided and are bold if the changes are significantly different from zero.
| Men (N=100) | Women (N=300) | |||
|---|---|---|---|---|
| Absolute change per year (95CI) |
% change per year Mean (95%CI) |
Absolute change per year (95CI) |
% change per year Mean (95%CI) |
|
| ΔS Est Ct.Th (mm/%) | −0.020 (−0.026 to −0.014) | −1.6 (−2.1 to −1.1) | −0.023 (−0.026 to −0.020) | −3.3 (−3.8 to −2.8)* |
| ΔI Est Ct.Th (mm/%) | −0.013 (−0.018 to −0.007) | −0.5 (−0.7 to −0.3) | −0.024 (−0.028 to −0.020)* | −0.9 (−1.0 to −0.8)* |
| ΔCSA (cm2/%) | −0.012 (−0.019 to 0) | −0.2 (−0.2, 0.0) | 0.004 (−0.002 to 0.01) | 0.0 (0.0, 0.1) |
| CSMI min (mg/cm3 cm4/%) | −21 (−26 to −15) | −0.7 (−0.9 to −0.5) | −13 (−15 to −11)* | −0.9 (−1.0 to −0.7) |
| CSMI max (mg/cm3 cm4/%) | −29 (−37 to −21) | −0.7 (−0.9 to −0.5) | −17 (−20 to −14)* | −0.8 (−0.9 to −0.7) |
| ΔS Tt.vBMD (mg/cm3/%) | −2.2 (−2.7 to −1.7) | −2.2 (−2.7 to −1.6) | −2.6 (−2.9 to −2.3) | −3.4 (−3.8 to −3.0)* |
| ΔI Tt.vBMD (mg/cm3/%) | −1.0 (−1.5 to −0.4) | −0.4 (−0.6 to −0.2) | −2.5 (−3.0 to −2.1)* | −1.0 (−1.2 to −0.9)* |
| ΔS Ct.vBMD (mg/cm3/%) | −2.8 (−3.9 to −1.6) | −0.6 (−0.3, −0.8) | −4.7 (−5.5 to −3.9)* | −1.2 (−1.4 to −0.9)* |
| ΔI Ct.vBMD (mg/cm3/%) | −0.5 (−1.4 to 0.5) | −0.1 (0.1, −0.2) | −2.4 (−3.0 to −1.8)* | −0.4 (−0.5 to −0.3)* |
| ΔS Tb.vBMD (mg/cm3/%) | −1.2 (−1.6 to −0.9) | −2.4 (−4.5 to −0.2) | −1.4 (−1.6 to −1.2) | −3.0 (−3.8 to −2.3) |
| ΔI Tb.vBMD (mg/cm3/%) | −0.4 (−0.9 to 0.0) | −0.4 (−0.8 to 0.0) | −0.6 (−0.8 to −0.3) | −0.4 (−1.3 to 0.6) |
| ΔFN vBMD (mg/ cm3/%) | −1.6 (−1.9 to −1.2) | −0.7 (−0.8 to-0.5) | −2.4 (−2.7 to −2.2)* | −1.1 (−1.2 to −1.0)* |
| ΔFN aBMD (mg/cm2/%) | −6.3 (−9.7 to −3.0) | −0.8 (−1.2 to −0.5) | −9.3 (−11.5 to −7.1) | −1.3 (−1.5 to −1.0) |
p<0.05 Significant sex difference.
Women lost relatively more cortical thickness and vBMD than men in both surfaces except for Tb.vBMD in the inferior region. This was also true for absolute changes with the exception of Est Ct.Th and Tt.vBMD in the superior region. The average change in FN Tt.vBMD was slightly higher in women but was similar for FN aBMD in men and women, about −1 %/year. The baseline body weight was positively associated with I Est Ct.Th and FN aBMD but it was not associated with the estimated loss in each variable.
Type 2 diabetes was not an effect modifier for the estimated average change in any of the variables for either men or women (p>0.05)
Comparison between those who maintained or increased bone and those who lost bone
The baseline and follow-up value for every individual in cortical thickness in inferior and superior surfaces and FN vBMD are shown in Fig. 2. Among men, 25 participants (25%) maintained or increased S Est Ct.Th during follow-up, 34 (34%) maintained or increased I Est Ct.Th and 20 (20%) maintained or increased FN vBMD. Fifty-six women (19%) maintained or increased S Est Ct.Th, 68 (23%) maintained or increased I Est Ct.Th and 27 (9%) maintained or increased FN vBMD during follow-up. The maintenance of Est Ct.Th and FN vBMD in men was not significantly (p>0.15) associated with any of the following: baseline age; baseline weight; baseline height; or weight change during follow-up. Maintenance of I Est Ct.Th among women was associated with weight gain (p<0.02), those who maintained I Est Ct.Th increased on average their weight by 0.24 kg (SD=6.0) and those who lost I Est Ct.Th decreased their weight by −1.4 kg (SD=5.0). Percent I Est Ct.Th loss among women during follow-up is presented by quartiles of weight change during follow-up in Fig. 3 a (p for trend = 0.01). Maintenance of S Est Ct.Th was not significantly (p>0.21) associated with any of the following; baseline age; baseline weight; baseline height; or weight change during follow-up in either sex.
Figure 2.
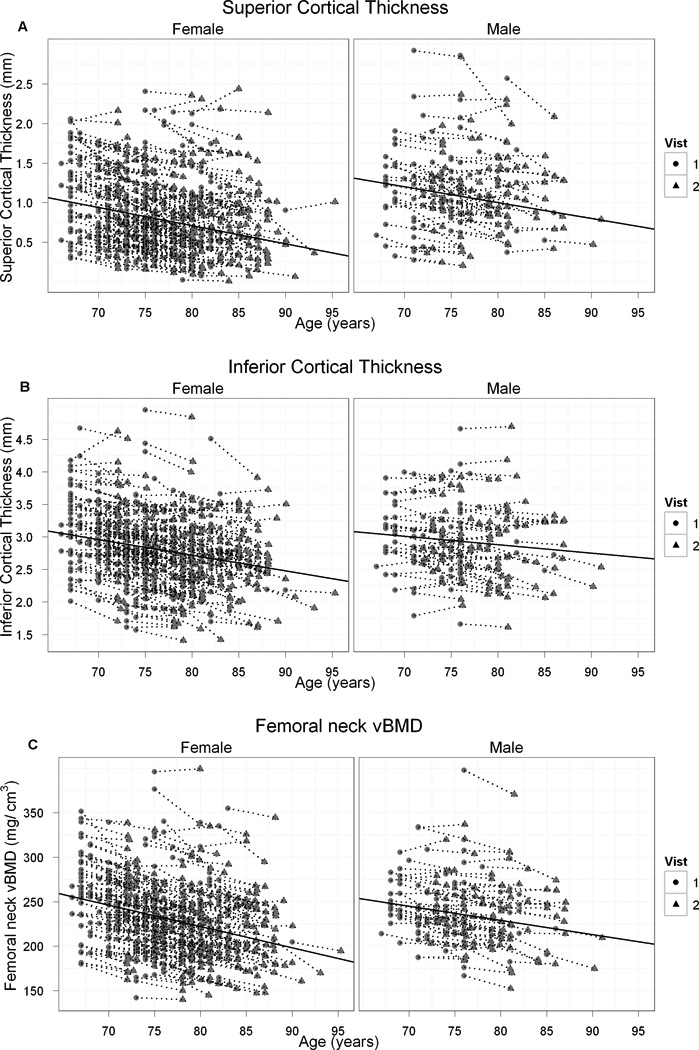
Individual change in estimated cortical thickness in superior (A) and inferior (B) surfaces and mid-femoral neck vBMD (C) in men and women during a median of 5.1 yr of follow-up. Each dot line represents a single participant. The solid line represents the average loss.
Figure 3.
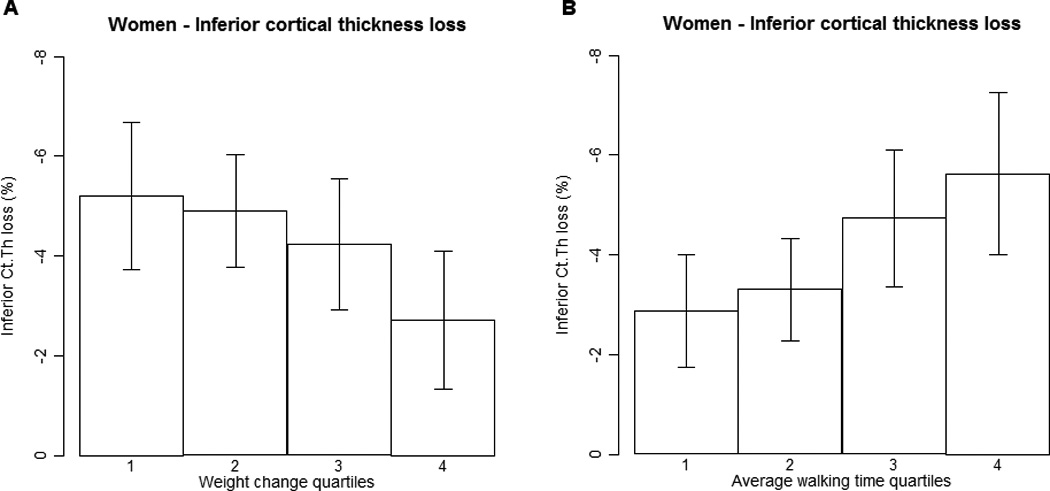
a. Percentage loss in inferior estimated cortical thickness during a median of 5.1 yr of follow-up by quartiles of weight change during follow-up in women. Cut-points for weight change quartiles are as follows: <-4.0 kg, −4.0 kg to < −1.0 kg, −1.0 kg to < 1.8 kg and ≥ 1.8 kg. Significantly different from quartile four, p=0.01. Error bars indicate 95% confidence intervals.
b. Percentage loss in inferior estimated cortical thickness during a median of 5.1 yr of follow-up by quartiles of baseline walk time in women. Cut-points for baseline walk speed quartiles are as follows: <5.4 sec, 5.4 sec to < 6.0 sec, 6.0 sec to < 6.8 sec and ≥ 6.8 sec. Significantly different from quartile four, p=0.007. Error bars indicate 95% confidence intervals.
Correlation between percentage changes in bone variables and individual’s physical performance
Table 3 shows the partial correlation coefficients between percentage changes in bone variables and the average walking time (used to represent an individual’s physical performance) when corrected for baseline age, height and weight. The correlation between changes in bone variables and walking time were inverse; and when statistically significant ranged from −0.13 to −0.26. Among women, I Est Ct.Th, S Tt.vBMD, S Ct.vBMD and FN vBMD were negatively correlated with average walking time. In men, S Tt.vBMD, FN vBMD and FN aBMD were negatively correlated with average walking time. Percent I Est Ct.Th loss among women during follow-up is presented by quartiles of average walking time in Fig. 3 b.
Table 3.
Correlation between the percent changes in various variables with average walking time (physical performance). All partial correlation coefficients are adjusted for baseline age, height and weight.
| Men | Women | |
|---|---|---|
| Partial correlation coefficient |
Partial correlation coefficient |
|
| ΔS Est Ct.Th (%) | NS | NS |
| ΔI Est Ct.Th (%) | NS | −0.13 (−0.24, −0.02)* |
| ΔS Tt.vBMD (%) | −0.26 (−0.44, −0.06)* | −0.14 (−0.25, −0.02)* |
| ΔI Tt.vBMD (%) | NS | NS |
| ΔS Ct.vBMD (%) | −0.22 (−0.40 to −0.02)* | −0.18 (−0.29, −0.06)** |
| ΔI Ct.vBMD (%) | - | NS |
| ΔS Tb.vBMD (%) | NS | NS |
| ΔFN vBMD (%) | −.24 (−0.42, −0.04)* | −0.17 (−0.28, −0.05)* |
| ΔFN aBMD (%) | −0.24 (−0.42, −0.04)* | NS |
p<.0001,
p<.001,
<.01,
p<0.05
NS: correlation not signficant
Correlation between changes in superior and inferior region and between changes in cortical and trabecular bone in the same region
Table 4 shows the partial correlation coefficients between changes in superior and inferior region for Est Ct.Th, Tt.vBMD, Ct.vBMD and Tb.vBMD when corrected for baseline age, height and weight among men and women. The coefficients of correlation ranged from 0.23–0.41 and were similar in men and women. The strongest correlation was between S Tt.vBMD and I Tt.vBMD. In addition the correlation coefficients between changes in cortical and trabecular bone in the same region are shown in table 3. The correlation between variables in superior region was higher in men than women. The correlation between changes in I Ct.vBMD and I Tb.vBMD was inverse, statistically significant, but similar in both sexes. There was no correlation between changes in I Est Ct.Th and I Tb.vBMD.
Table 4.
Relationship between changes in superior and inferior region for Est cortical thickness, total vBMD, cortical vBMD and trabecular vBMD among men and women. In addition, relationship between changes in cortical and trabecular bone in the same region. All partial correlation coefficients are adjusted for baseline age, height and weight.
| Men (N=100) | Women (N=300) | |||
|---|---|---|---|---|
| Relationship between changes in superior and inferior region | ||||
| Partial correlation coefficient (95%CI) | p on gender difference |
|||
| I Est Ct.Th vs. S Est Ct.Th | 0.26 (0.07 to 0.43) | 0.40 (0.30 to 0.49) | 0.48 | |
| I Tt.vBMD vs. S Tt.vBMD | 0.41 (0.23 to 0.56) | 0.38 (0.28 to 0.47) | 0.76 | |
| I Ct.vBMD vs. S Ct.vBMD | 0.21 (0.01 to 0.39) | 0.33 (0.23 to 0.43) | 0.27 | |
| I Tb.vBMD vs. S Tb.vBMD | 0.23 (0.04 to 0.41) | 0.28 (0.17 to 0.38) | 0.65 | |
| Relationship between changes in cortical and trabecular bone in the same region | ||||
| Partial correlation coefficient (95%CI) | p on gender difference |
|||
| S Ct.vBMD vs. S Tb.vBMD | 0.35 (0.16 to 0.51) | 0.13 (0.02 to 0.24) | 0.04 | |
| I Ct.vBMD vs. I Tb.vBMD | −0.48 (−0.62 to −0.31) | −0.44 (−0.53 to −0.34) | 0.66 | |
| S Est Ct.Th vs. S Tb.vBMD | 0.47 (0.30 to 0.61) | 0.17 (0.06 to 0.28) | <0.0001 | |
| I Est Ct.Th vs. I Tb.vBMD | 0.00 (−0.20 to 0.20) | −0.01 (−0.12 to 0.10) | 0.93 | |
Discussion
This study presents longitudinal changes in cortical thickness, cortical vBMD, trabecular vBMD as well as total vBMD in specific regions of the mid-femoral neck. Elderly women lost cortical thickness, total vBMD and cortical vBMD more rapidly than elderly men while in both sexes the relative losses were significantly greater in all variables in the superior region compared to the mechanically loaded inferior region. The loss in trabecular vBMD was similar in each sex and restricted to the superior region. At baseline, women had lower bone values in the superior region than men and these differences increased; yet they were only weakly reflected in the total femoral neck DXA-like results generated by the standard software. It seems plausible that these higher rates of bone loss at critical locations may contribute materially to the greater risk of femoral neck fracture seen in elderly women.
The losses in all bone variables in the superior region correlated low to moderately with those seen inferiorly. This might indicate different determining factors. In normal gait, the maximum compressive stresses occur inferiorly and smaller magnitude tensile stresses occur superiorly (19). It has been postulated that an adaptive bone remodelling response to the typical strains from bipedal locomotion causes increasing asymmetry of the femoral neck cross-section during life (27–29) and results in faster thinning of cortex and decrease in volumetric BMD superiorly. While walking usually continues into advanced old age, the femoral necks of the elderly are rarely subjected to “odd impact” and “high impact” loads that are associated with a more uniformly thickened femoral neck cortex (30).
Change in body weight and change in BMD have previously been shown to be associated in both sexes (31–33). In the present study, higher baseline weight was slightly associated with greater I Est Ct.Th and FN aBMD at both baseline and follow-up in women. Also in women, maintenance of I Est Ct.Th was associated with maintenance of body weight. Reid (34) concluded that both fat mass and lean mass contribute to maintenance of bone mass, though in postmenopausal women the importance of fat mass had been demonstrated more consistently. Mechanically and biologically, fat and bone are linked by a multitude of pathways including the effects of soft tissue mass on skeletal loading, the association of fat mass with the secretion of bone active hormones from the pancreatic beta cell (including insulin, amylin, and preptin), and the secretion of bone active hormones (35) (e.g. estrogens and leptin) from adipocytes. We found marked individual variations in the amount of bone lost in both men and women, which may imply that underlying mechanisms differ between subjects. Since BMD and Est Ct.Th are strongly associated with fracture risk in both men and women (5, 36, 37), understanding the source of these variations is important.
There is limited evidence suggesting that physical activity has positive effects on elderly bone (38). Cousins et al. (39) found that bone strength and physical activity in men was associated through greater total bone area but not volumetric density; and other studies have shown reduction of fracture rates in older people who exercise (40). Our findings show that reduced physical performance was associated with more bone loss. This is consistent with previously published data from this elderly population showing that continuing physical activity helps maintain bone health in the elderly (41).
To our knowledge, this is the first 3-dimensional study to report longitudinal changes in specific regions of the mid-femoral neck. In agreement with previous DXA studies, our results showed that elderly men and women lose about 1.0 % of total femoral neck aBMD per year (7, 8), confirming that BMD loss progresses with age at the femoral neck in the elderly (12, 13). This longitudinal study, while verifying our previous cross-sectional results suggesting that losses in cortical thickness differed considerably between men and women and were markedly different according to location within the femoral neck (5), has shown in addition that cortical thickness also decreases with advancing age in men.
We found a two-fold higher rate of loss in the inferior region in our age-group compared to the estimate from a cross-sectional study using similar methodology (16); which emphasizes the need to make direct measurements of rates of loss. In a longitudinal study of 59 Japanese women (aged 54–84 years) followed for the shorter interval of 2 years, the cortical thickness in the femoral neck decreased by 1.1% per year but the cortical vBMD was unchanged (42). Riggs et al (43) suggested in a cross-sectional study that decreases in trabecular vBMD begin before midlife, whereas cortical vBMD decreases start later. We found that whereas the loss in trabecular BMD was similar among men and women and only significant superiorly, women lost more cortical vBMD in both regions than men, men only losing cortical vBMD superiorly.
It has been hypothesized (44) that endosteal bone loss precedes periosteal apposition, which adapts to maintain whole bone strength (45). Kaptoge et al found with DXA that the width of the elderly femoral neck in the antero-posterior projection gradually increased over time (46). But in our study mid-femoral neck cross-sectional area was unchanged, in agreement with the results of Ito et al (42). In the MrOS study, the total cross-sectional area of the neck was minimally related with age in men (47) while in the cross-sectional AGES study the neck CSA slightly increased with age, by about 2% per decade in both men and women (10). To be able to detect such a small increase in CSA with advancing age would have required a longer follow-up in this cohort.
Lobstein defined osteoporosis 150 years before bone densitometry by the increased size of cortical pores (48, 49) and in hip fracture very large pores develop from merging of two or more haversian canals, potentially leading to trabecularization of the cortex (27). This might have led to the inverse associations we observed between I Tb.vBMD and I Ct.vBMD (Table 4), although there are other possible explanations including thresholding errors between cortical and trabecular bone due to partial volume effects.
Maximal compressive strain from a sideways fall occurs superiorly in the neck (15, 19, 20). In load-to-failure ex-vivo testing in a sideways fall simulation, cadaveric femurs often began to fracture at the thin superior cortex (50) as previously predicted (15, 17). Cortical thinning in the superior surface of the mid-femoral neck has been shown to be associated with femoral neck fracture in vivo (5, 51). In an ex-vivo study the superior region of the mid-neck displayed marked trabecular micro-architectural weakness in elderly female femoral neck fracture cases (18). It has been argued that the importance of trabecular bone for fracture resistance is greater if the femoral neck cortex fails through local buckling rather than through materials failure in which the superior cortex is crushed (17). Our study showed that the relative loss of Est Ct.Th was threefold greater superiorly than inferiorly whereas trabecular vBMD only declined in the superior region.
As longevity increases our findings are potentially important, even though the mechanical implications of these densitometric and geometric changes of the femoral neck are still somewhat conjectural. To estimate age-related changes in stress and strain distribution in the cortical and the trabecular bone, separately, in both stance and sideways fall configurations is desirable but requires further investigation. The voxel-based finite element techniques that have been applied in population based studies so far have only been validated to estimate whole bone strength (fracture load).
This study has several important strengths such as the inclusion of both men and women, the longitudinal study design, which eliminates the cohort effects that confound cross-sectional studies, and the spatial resolution 1 mm thickness QCT-scans being made and analyzed at a single center. Our detailed information on medication allowed exclusion of subjects on medications that influence bone. This study also has some limitations. All of our subjects were Caucasian, and our results may therefore not be applicable to other ethnic groups. There are certain technical limitations to the measurement of cortical bone in vivo, which have been discussed in previous reports (5, 16). What we have measured with the BIT2 technique cannot be considered an accurate estimate of the thickness of the cortex in the thin superior zones, due to the partial volume effect. For simplicity in application, we used a single threshold to delineate cortex from trabecular bone. The difficulties of resolving thin bone cortices in the femur using a thresholding technique were documented (52). The partial volume effect tends to make trabecular bone close to the endosteal boundary appear more dense and cortical bone less dense than they really are (53, 54). These effects lead to cortical thickness overestimation particularly in the inferior region of the femoral neck cortex. Downward bias can also occur when true cortical thickness approaches the pixel size, especially for highly porous cortices (53) and this might affect our results more in women than men because of thinner cortices among women. Higher apparent cortical density in the inferior regions compared to the superior regions appeared exaggerated compared to direct measurements made with a scanning electron microscope (SEM) technique (55). Nevertheless, by average adjacent Est Ct.Th measurements and along the femoral neck axis to increase the precision, the CVs are comparable to those obtained in 2D Hip Strength Analysis (56) and with the architectural variables derived by HR-pQCT (57, 58) while remaining equal to or larger than CVs for 2D BMD (59). An additional technical limitation might be that the image registration method was not fully automated. The correlation coefficients in table 4 might be underestimated by 20–30 % in men because of measurement imprecision leading to regression dilution, especially for total vBMD and trabecular vBMD, and this might affect our results more in men than women because they lost less bone.
In conclusion, we have shown that age-related losses of bone tissue were about threefold greater in the superior region than in the inferior region of the mid-femoral neck in both sexes. Older women lost cortical thickness and cortical BMD more rapidly than men, especially superiorly and this was only weakly reflected in the DXA-like results. Since fractures may initiate superiorly (50), the increased rate of superior femoral neck bone loss in women may contribute materially to the greater risk of femoral neck fracture in elderly women than men. Excess endocortical resorption and possibly enlargement of intracortical cavities leading to trabecularization of the cortex may be key processes leading to increased bone fragility in the elderly femoral neck. Because of the marked difference in regional bone loss between individuals and also between the two sexes, better understanding of the so far undetermined mechanisms regulating localized bone loss in the elderly proximal femur is an important topic for future research.
Acknowledgements
This study was funded by NIH contract N01-AG-1-2100, the NIA Intramural Research Program, Hjartavernd (the Icelandic Heart Association), the Althingi (the Icelandic Parliament), and the memorial fund of Helga Jonsdottir and Sigurlidi Kristjansson. Dr G Sigurdsson acknowledges support from the University of Iceland Research Fund. The study was approved by the Icelandic National Bioethics Committee (VSN 00-063). Dr Poole acknowledges the support of Arthritis Research UK and the Cambridge NIHR Biomedical Research Centre. Dr Reeve was supported in part by the EU FP7 Integrated Project Grant GEFOS Reference: 201865 The researchers are indebted to the participants for their willingness to participate in the study. The authors would like to thank Keenan Brown (Mindways software, Texas, USA) for his assistance.
Authors’ roles: Study design: FJ, TA, JR, KEP, TBH, VGG and GS. Study conduct: FJ, TA, VGG and GS. Data collection: FJ, TA, SS, VGG and GS. Data analysis: FJ, TA, VGG and GS. Data interpretation: FJ, TA, JR, VGG and GS. Drafting manuscript: FJ, TA, JR, VGG and GS. All authors contribute to revising the manuscript content and approving the final version of manuscript.
Funding sources
This study was funded by NIH contract N01-AG-1-2100, the NIA Intramural Research Program, the Icelandic Parliament, the University of Iceland Research Fund, and the memorial fund of Helga Jonsdottir and Sigurlidi Kristjansson. Dr Poole acknowledges the support of an Arthritis Research UK Research Progression Award and Campaign (UK) and the Cambridge NIHR Biomedical Research Centre. Dr Reeve was supported in part by the EU FP7 Integrated Project Grant GEFOS Reference: 201865.
Footnotes
Disclosure Page
Other authors state that they have no conflicts of interest.
References
- 1.Kanis J. The incidence of hip fracture in Europe. Osteoporos Int. 1993;3:10–15. doi: 10.1007/BF01621853. [DOI] [PubMed] [Google Scholar]
- 2.Moyad M. Osteoporosis: a rapid review of risk factors and screening methods. Urologic Oncology. 2003;21:375–379. doi: 10.1016/s1078-1439(03)00140-6. [DOI] [PubMed] [Google Scholar]
- 3.Lang TF, Augat P, Lane NE, Genant HK. Trochanteric hip fracture: strong association with spinal trabecular bone mineral density measured with quantitative CT. Radiology. 1998;209:525–530. doi: 10.1148/radiology.209.2.9807584. [DOI] [PubMed] [Google Scholar]
- 4.Mautalen CA, Vega EM, Einhorn TA. Are the etiologies of cervical and trochanteric hip fractures different? Bone. 1996;18:133S–137S. doi: 10.1016/8756-3282(95)00490-4. [DOI] [PubMed] [Google Scholar]
- 5.Johannesdottir F, Poole KE, Reeve J, Siggeirsdottir K, Aspelund T, Mogensen B, Jonsson BY, Sigurdsson S, Harris TB, Gudnason VG, Sigurdsson G. Distribution of cortical bone in the femoral neck and hip fracture: a prospective case-control analysis of 143 incident hip fractures; the AGES-REYKJAVIK Study. Bone. 2011;48:1268–1276. doi: 10.1016/j.bone.2011.03.776. [DOI] [PMC free article] [PubMed] [Google Scholar]
- 6.Burger H, Van Daele PL, Algra D, van den Ouweland FA, Grobbee DE, Hofman A, van Kuijk C, Schutte HE, Birkenhager JC, Pols HA. The association between age and bone mineral density in men and women aged 55 years and over: The Rotterdam study. Bone Miner. 1994;25:1–13. doi: 10.1016/s0169-6009(08)80203-6. [DOI] [PubMed] [Google Scholar]
- 7.Cawthon PM, Ewing SK, McCulloch CE, Ensrud KE, Cauley JA, Cummings SR, Orwoll ES. Loss of hip BMD in older men: the osteoporotic fractures in men (MrOS) study. J Bone Miner Res. 2009;24:1728–1735. doi: 10.1359/JBMR.090419. [DOI] [PMC free article] [PubMed] [Google Scholar]
- 8.Melton LJ, III, Khosla S, Atkinson EJ, Oconnor MK, Ofallon WM, Riggs BL. Cross-sectional versus longitudinal evaluation of bone loss in men and women. Osteoporos Int. 2000;11:592–599. doi: 10.1007/s001980070080. [DOI] [PubMed] [Google Scholar]
- 9.Riggs BL, Melton LJ, III, Robb RA, Camp JJ, Atkinson EJ, McDaniel L, Amin S, Rouleau PA, Khosla S. A population based assessment of rates of bone loss at multiple skeletal sites: Evidence for substantial trabecular bone loss in young adult women and men. J Bone Miner Res. 2008;23:205–214. doi: 10.1359/JBMR.071020. [DOI] [PMC free article] [PubMed] [Google Scholar]
- 10.Sigurdsson G, Aspelund T, Chang M, Jonsdottir B, Sigurdsson S, Eiriksdottir G, Gudmundsson A, Harris TB, Gudnason V, Lang T. Increasing sex difference in bone strength in old age: the Age, Gene/Environment Susceptibility — Reykjavik Study (AGES-REYKJAVIK) Bone. 2006;39:644–651. doi: 10.1016/j.bone.2006.03.020. [DOI] [PubMed] [Google Scholar]
- 11.Steiger P, Cummings SR, Black DM, Spencer NE, Genant HK. Age-related decrements in bone mineral density in women over 65. J Bone Miner Res. 1992;7:625–632. doi: 10.1002/jbmr.5650070606. [DOI] [PubMed] [Google Scholar]
- 12.Greenspan SL, Maitland LA, Myers ER, Krasnow MB, Kido TH. Femoral bone loss progresses with age: A longitudinal study in women over age 65. J Bone Miner Res. 1994;9:1959–1965. doi: 10.1002/jbmr.5650091216. [DOI] [PubMed] [Google Scholar]
- 13.Jones G, Nguyen T, Sambrook P, Kelly PJ, Eisman JA. Progressive loss of bone in the femoral neck in elderly people: Longitudinal findings from the Dubbo osteoporosis epidemiology study. BMJ. 1994;309:691–695. [PMC free article] [PubMed] [Google Scholar]
- 14.Boyce TM, Bloebaum RD. Cortical aging differences and fracture implications for the human femoral neck. Bone. 1993;14:769–7678. doi: 10.1016/8756-3282(93)90209-s. [DOI] [PubMed] [Google Scholar]
- 15.Mayhew PM, Thomas CD, Clement JG, Loveridge N, Beck TJ, Bonfield W, Burgoyne CJ, Reeve J. Relation between age, femoral neck cortical stability, and hip fracture risk. Lancet. 2005;366:129–135. doi: 10.1016/S0140-6736(05)66870-5. [DOI] [PubMed] [Google Scholar]
- 16.Poole KE, Mayhew PM, Rose CM, Brown JK, Bearcroft PJ, Loveridge N, Reeve J. Changing structure of the femoral neck across the adult female lifespan. J Bone Miner Res. 2010;25:482–491. doi: 10.1359/jbmr.090734. [DOI] [PubMed] [Google Scholar]
- 17.Thomas CD, Mayhew PM, Power J, Poole KE, Loveridge N, Clement JG, Burgoyne CJ, Reeve J. Femoral neck trabecular bone: loss with aging and role in preventing fracture. J Bone Miner Res. 2009;24:1808–1818. doi: 10.1359/jbmr.090504. [DOI] [PubMed] [Google Scholar]
- 18.Milovanovic P, Djonic D, Marshall R, Hahn M, Nikolic S, Zivkovic V, Amling M, Djuric M. Micro-structural basis for particular vulnerability of the superolateral neck trabecular bone in the postmenopausal women with hip fractures. Bone. 2012;50:63–68. doi: 10.1016/j.bone.2011.09.044. [DOI] [PubMed] [Google Scholar]
- 19.Lotz JC, Cheal EJ, Hayes WC. Stress distributions within the proximal femur during gait and falls: Implications for osteoporotic fracture. Osteoporosis Int. 1995;5:252–261. doi: 10.1007/BF01774015. [DOI] [PubMed] [Google Scholar]
- 20.Verhulp E, van Rietbergen B, Huiskes R. Load distribution in the healthy and osteoporotic human proximal femur during a fall to the side. Bone. 2008;42:30–35. doi: 10.1016/j.bone.2007.08.039. [DOI] [PubMed] [Google Scholar]
- 21.Khoo BCC, Brown K, Cann C, Zhu K, Henzell S, Low V, Gustafsson S, Price RI, Prince RL. Comparison of QCT-derived and DXA-derived areal bone mineral density and T scores. Osteoporos Int. 2009;20:1539–1545. doi: 10.1007/s00198-008-0820-y. [DOI] [PubMed] [Google Scholar]
- 22.Harris TB, Launer LJ, Eiriksdottir G, Kjartansson O, Jonsson PV, Sigurdsson G, Thorgeirsson G, Aspelund T, Garcia ME, Cotch MF, Hoffman HJ, Gudnason V. Age, Gene/Environment Susceptibility-Reykjavik Study: multidisciplinary applied phenomics. Am J Epidemiol. 2007;165:1076–1087. doi: 10.1093/aje/kwk115. [DOI] [PMC free article] [PubMed] [Google Scholar]
- 23.Crabtree N, Loveridge N, Parker M, Rushton N, Power J, Bell KL, Beck TJ, Reeve J. Intracapsular hip fracture and the region-specific loss of cortical bone: analysis by peripheral quantitative computed tomography. J Bone Miner Res. 2001;16:1318–1328. doi: 10.1359/jbmr.2001.16.7.1318. [DOI] [PubMed] [Google Scholar]
- 24.Kuiper J, Van Kuijk C, Grashuis J. Distribution of trabecular and cortical bone related to geometry. A quantitative computed tomography study of the femoral neck. Invest Radiol. 1997;32:83–89. doi: 10.1097/00004424-199702000-00002. [DOI] [PubMed] [Google Scholar]
- 25.Stephenson P, Seedhom BB. Modelling femoral curvature in the sagittal plane: a cadaveric study. Proc Inst Mech Eng. 2001;215:221–228. doi: 10.1243/0954411011533616. [DOI] [PubMed] [Google Scholar]
- 26.Poole KES, Rose CM, Mayhew PM, Brown JK, Clement JG, Thomas CD, Reeve J, Loveridge N, editors. BRS/BORS second joint meeting. Manchester: Calcif Tissue Int; 2008. Thresholds for the measurement of cortical thickness in-vivo using computed tomography (The 100 women study) [Google Scholar]
- 27.Bell KL, Loveridge N, Jordan GR, Power J, Constant CR, Reeve J. A novel mechanism for induction of increased cortical porosity in cases of intracapsular hip fracture. Bone. 2000;27:297–304. doi: 10.1016/s8756-3282(00)00318-5. [DOI] [PubMed] [Google Scholar]
- 28.Lovejoy CO. Evolution of human walking. Sci Am. 1988;259:118–125. doi: 10.1038/scientificamerican1188-118. [DOI] [PubMed] [Google Scholar]
- 29.Power J, Loveridge N, Lyon A, Rushton N, Parker M, Reeve J. Osteoclastic cortical erosion as a determinant of subperiosteal osteoblastic bone formation in the femoral neck’s response to BMU imbalance: effects of stance-related loading and hip fracture. Osteoporos Int. 2005;16:1049–1056. doi: 10.1007/s00198-004-1803-2. [DOI] [PubMed] [Google Scholar]
- 30.Nikander R, Kannus P, Dastidar P, Hannula M, Harrison L, Cervinka T, Narra NG, Aktour R, Arola T, Eskola H, Soimakallio S, Heinonen A, Hyttinen J, Sievänen H. Targeted exercises against hip fragility. Osteoporos Int. 2008;20:1321–1328. doi: 10.1007/s00198-008-0785-x. [DOI] [PubMed] [Google Scholar]
- 31.Gudmundsdottir SL, Oskarsdottir D, Indridason OS, Franzson L, Sigurdsson G. Risk factors for bone loss in the hip of 75-year-old women: A 4-year follow-up study. Maturitas. 2010;67:256–261. doi: 10.1016/j.maturitas.2010.07.005. [DOI] [PubMed] [Google Scholar]
- 32.Knoke JD, Barrett-Connor E. Weight loss: a determinant of hip bone loss in older men and women. The Rancho Bernardo Study. Am J Epidemiol. 2003;158:1132–1138. doi: 10.1093/aje/kwg265. [DOI] [PubMed] [Google Scholar]
- 33.Uusi-Rasi K, Sievanen H, Pasanen M, Oja P, Vuori I. Maintenance of body weight, physical activity and calcium intake helps preserve bone mass in elderly women. Osteoporos Int. 2001;12:373–379. doi: 10.1007/s001980170105. [DOI] [PubMed] [Google Scholar]
- 34.Reid IR. Fat and bone. Arch Biochem Biophys. 2010;503:20–27. doi: 10.1016/j.abb.2010.06.027. [DOI] [PubMed] [Google Scholar]
- 35.Cummings SR, Browner WS, Bauer D, Stone K, Ensrud K, Jamal S, Ettinger B. Endogenous hormones the risk of hip and vertebral fractures among older women. Study of Osteoporotic Fractures Research Group. N Engl J Med. 1998;339:733–738. doi: 10.1056/NEJM199809103391104. [DOI] [PubMed] [Google Scholar]
- 36.Black DM, Bouxsein ML, Marshall LM, Cummings SR, Lang T, Cauley JA, Ensrud KE, Nielson CM, Orwoll ES. Proximal Femoral Structure and the Prediction of Hip Fracture in Men: A Large Prospective Study Using QCT. J Bone Miner Res. 2008;23:1326–1333. doi: 10.1359/JBMR.080316. [DOI] [PMC free article] [PubMed] [Google Scholar]
- 37.Cummings SR, Black DM, Nevitt MC, Browner W, Cauley J, Ensrud K, Genant HK, Palermo L, Scott J, Vogt TM. Bone density at various sites for prediction of hip fractures. The Study of Osteoporotic Fractures Research Group. Lancet. 1993;341:72–75. doi: 10.1016/0140-6736(93)92555-8. [DOI] [PubMed] [Google Scholar]
- 38.Bonnet N, Ferrari S. Exercise and the skeleton: how it works and what it really does. IBMS BoneKEy. 2010;7:235–248. [Google Scholar]
- 39.Cousins J, Petit M, Paudel M, Taylor B, Hughes J, Cauley J, Zmuda J, Cawthon P, Ensrud K. Muscle power and physical activity are associated with bone strength in older men: the osteoporotic fractures in men study. Bone. 2010;47:205–211. doi: 10.1016/j.bone.2010.05.003. [DOI] [PMC free article] [PubMed] [Google Scholar]
- 40.Sherrington C, Whitney J, Lord S, Herbert R, Cumming R, Close J. Effective exercise for the prevention of falls: a systematic review and meta-analysis. J Am Geriatr Soc. 2008;56:2234–2243. doi: 10.1111/j.1532-5415.2008.02014.x. [DOI] [PubMed] [Google Scholar]
- 41.Rianon N, Lang T, Sigurdsson G, Eiriksdottir G, Sigurdsson S, Garcia M, Pajala S, Koster A, Yu B, Selwyn B, Taylor W, Kapadia A, Gudnason V, Launer L, Harris T. Lifelong physical activity in maintaining bone strength in older men and women of the Age, Gene/Environment Susceptibility-Reykjavik Study. Osteoporos Int. 2012;23:2303–2312. doi: 10.1007/s00198-011-1874-9. [DOI] [PMC free article] [PubMed] [Google Scholar]
- 42.Ito M, Nakata T, Nishida A, Uetani M. Age-related changes in bone density, geometry and biomechanical properties of the proximal femur: CT-based 3D hip structure analysis in normal postmenopausal women. Bone. 2011;48:627–630. doi: 10.1016/j.bone.2010.11.007. [DOI] [PubMed] [Google Scholar]
- 43.Riggs BL, Melton LJ, III, Robb RA, Camp JJ, Atkinson EJ, Peterson JM, Rouleau PA, McCollough CH, Bouxsein ML, Khosla S. Population-Based Study of Age and Sex Differences in Bone Volumetric Density, Size, Geometry, and Structure at Different Skeletal Sites. J Bone Miner Res. 2004;19:1945–1954. doi: 10.1359/JBMR.040916. [DOI] [PubMed] [Google Scholar]
- 44.Szulc P, Seeman E, Duboeuf F, Sornay-Rendu E, Delmas PD. Bone fragility: failure of periosteal apposition to compensate for increased endocortical resorption in postmenopausal women. J Bone Miner Res. 2006;21:1856–1863. doi: 10.1359/jbmr.060904. [DOI] [PubMed] [Google Scholar]
- 45.Power J, Loveridge N, Rushton N, Parker M, Reeve J. Intracapsular bone formation on the external 'periosteal' surface of the femoral neck: An investigation in cases of hip fracture and controls. Osteoporos Int. 2003;14:146–151. doi: 10.1007/s00198-002-1333-8. [DOI] [PubMed] [Google Scholar]
- 46.Kaptoge S, Dalzell N, Loveridge N, Beck TJ, Khaw KT, Reeve J. Effects of gender, anthropometricvariables, and aging on the evolution of hip strength in men and women aged over 65. Bone. 2003;32:561–170. doi: 10.1016/s8756-3282(03)00055-3. [DOI] [PubMed] [Google Scholar]
- 47.Marshall L, Lang T, Lambert L, Zmuda J, Ensrud K, Orwoll E. Dimensions and volumetric BMD of the proximal femur and their relationto age among older U.S. men. J Bone Miner Res. 2006;21:1197–1206. doi: 10.1359/jbmr.060506. [DOI] [PubMed] [Google Scholar]
- 48.Schapira D, Schapira C. Osteoporosis: the evolution of a scientific term. Osteoporos Int. 1992;2:164–167. doi: 10.1007/BF01623921. [DOI] [PubMed] [Google Scholar]
- 49.Zebaze RM, Ghasem-Zadeh A, Bohte A, Iuliano-Burns S, Mirams M, Price RI, Mackie EJ, Seeman E. Intracortical remodelling and porosity in the distal radius and post-mortem femurs of women: a cross-sectional study. Lancet. 2010;375:1729–1736. doi: 10.1016/S0140-6736(10)60320-0. [DOI] [PubMed] [Google Scholar]
- 50.de Bakker PM, Manske SL, Ebacher V, Oxland TR, Cripton PA, Guy P. During sideways falls proximal femur fractures initiate in the superolateral cortex: evidence from high-speed video of simulated fractures. J Biomech. 2009;42:1917–1925. doi: 10.1016/j.jbiomech.2009.05.001. [DOI] [PubMed] [Google Scholar]
- 51.Poole KES, Treece GM, Mayhew PM, Vaculík J, Dungl P, Horák M, Stepán JJ, Gee AH. Cortical Thickness Mapping to Identify Focal Osteoporosis in Patients with Hip Fracture. PLoS One. 2012;7:e38466. doi: 10.1371/journal.pone.0038466. [DOI] [PMC free article] [PubMed] [Google Scholar]
- 52.Treece GM, Gee AH, Mayhew PM, Poole KE. High resolution cortical bone thickness measurement from clinical CT data. Med Image Anal. 2010;14:276–290. doi: 10.1016/j.media.2010.01.003. [DOI] [PMC free article] [PubMed] [Google Scholar]
- 53.Davis KA, Burghardt AJ, Link TM. The effects of geometric and threshold definitions on cortical bone metrics assessed by in vivo high-resolution peripheral quantitative computed tomography. Calcif Tissue Int. 2007;81:364–371. doi: 10.1007/s00223-007-9076-3. [DOI] [PubMed] [Google Scholar]
- 54.Prevrhal S, Fox JC, Shepherd JA, Genant HK. Accuracy of CT-based thickness measurement of thin structures: modeling of limited spatial resolution in all three dimensions. Med Phys. 2003;30:1–8. doi: 10.1118/1.1521940. [DOI] [PubMed] [Google Scholar]
- 55.Loveridge N, Power J, Reeve J, Boyde A. Bone mineralization density and femoral neck fragility. Bone. 2004;35:929–941. doi: 10.1016/j.bone.2004.05.025. [DOI] [PubMed] [Google Scholar]
- 56.Khoo BC, Beck TJ, Qiao QH, Parakh P, Semanick L, Prince RL, Singer KP, Price RI. In vivo short-term precision of hip structure analysis variables in comparison with bone mineral density using paired dual-energy X-ray absorptiometry scans from multi-center clinical trials. Bone. 2005;37:112–121. doi: 10.1016/j.bone.2005.03.007. [DOI] [PubMed] [Google Scholar]
- 57.Walker M, McMahon D, Udesky J, Liu G, Bilezikian J. Application of high resolution skeletal imaging to measurements of volumetric bone density and skeletalmicroarchitecture in Chinese American and white women: Explanation of a paradox. J Bone Miner Res. 2009;24:1953–1959. doi: 10.1359/JBMR.090528. [DOI] [PMC free article] [PubMed] [Google Scholar]
- 58.Wang X, Wang Q, Ghasem-Zadesh A, Evans A, McLeod C, Iuiano-Burns S, Seeman E. Differences in macro and micro-architecture of the appendicular skeleton in young Chinese and white women. J Bone Miner Res. 2009;24:1946–1952. doi: 10.1359/jbmr.090529. [DOI] [PubMed] [Google Scholar]
- 59.Lorentzon M, Landin K, Mellström D, Ohlsson C. Leptin is a negative independent predictor of areal BMD and cortical bone size in young adult Swedish men. J Bone Miner Res. 2006;21:1871–1878. doi: 10.1359/jbmr.060814. [DOI] [PubMed] [Google Scholar]