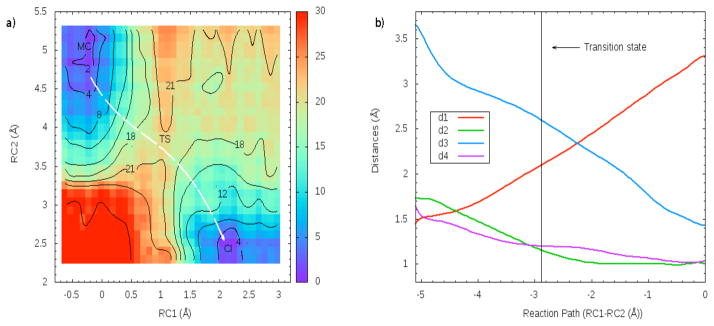
Figure 3.

a) Free energy contour plot of the CI formation in TcTS using sialyl-lactose as substrate. Results are in kcal/mol. The white line illustrates the minimum path. For this path, the distances involved in the reaction coordinate definition are depicted in b)
