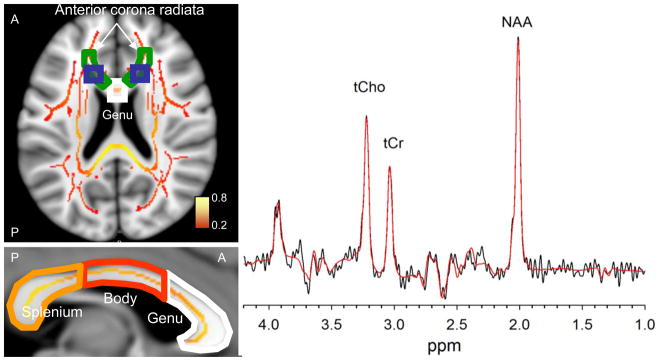
Figure 2.

Left. An axial slice (Talairach Z=10) shows the placement of bilateral spectroscopy voxels (blue boxes) with respect to the TBSS skeleton of WM tracts (average FA values color-coded from red to yellow) and two regions of interest extracted from JHU WM atlas: The genu of corpus callosum (white outline) and the anterior corona radiate (green outline). The sagittal slice through the interhemispheric fissure (Talairach X=0) shows the parcelation of corpus callosum into genu, body and splenium. Right. The representative 135-ms TE PRESS spectrum acquired from one of the voxels. Spectroscopic data from each hemisphere were fit in LCModel, and the results (red curve) were averaged after determining that the metabolite concentrations from each hemisphere were not significantly different.
