

Abstract
In nonalcoholic steatohepatitis (NASH), the extent of hepatocyte apoptosis correlates with disease severity. Reducing hepatocyte apoptosis with the selective caspase inhibitor GS-9450 has a potential for altering the course of the liver disease. In this phase 2, double-blind study, 124 subjects with biopsy-proven NASH were randomized to once-daily placebo or 1, 5, 10, or 40 mg GS-9450 for 4 weeks. Absolute and percent changes from baseline in ALT levels, AST levels, and caspase-3–cleaved cytokeratin (CK)-18 fragments at week 4 were assessed by an analysis of covariance model with adjustment for baseline values. In the 40-mg group, mean (SD) ALT decreased by 47 (43) U/L from baseline to week 4 (P < 0.0001 versus placebo), and the proportion of subjects with normal ALT increased from 0% to 35% at week 4. In the 40-mg group, mean AST decreased by 13 U/L from baseline (not significant), and the proportion with normal AST increased from 20% at baseline to 48% at week 4. By week 4, mean CK-18 fragment levels had decreased to 393 (723) U/L in the GS-9450 10-mg group and 125 (212) U/L in the 40-mg group, but these reductions were not statistically significant. No serious adverse events were reported during treatment, and the percentage of subjects with at least one treatment-emergent grade 3 or 4 laboratory abnormality ranged from 11.5% to 17% across the GS-9450 treatment groups versus 35% in the placebo group.
Conclusion
GS-9450 treatment induced significant reductions in ALT levels in NASH patients. Reductions in CK-18 fragment levels also occurred, although they were not statistically significant. At appropriate therapeutic indices, selective caspase inhibitors may be a promising treatment option in patients with NASH.
Current pharmacological options for nonalcoholic steatohepatitis (NASH) are limited because the mechanisms that trigger hepatic inflammation in the steatotic liver are not well understood. Inflammation is a major feature underlying the progression between steatosis and steatohepatitis, and clinical and experimental data have documented increased hepatocyte apoptosis in patients with NASH. Although apoptosis is a vital component of normal cellular turnover and development, excessive apoptosis, such as can occur in response to noxious stimuli, promotes inflammation.1 Apoptosis leads to inflammation either directly by activation of nuclear factor-κB (NF-κB) with subsequent up-regulation of proinflammatory cytokines or indirectly by inducing adhesion molecules, chemokines, and inflammatory cell recruitment.2 Moreover, clearance of apoptotic bodies elicits injurious inflammatory responses, which result in tissue damage and promotion of fibrosis.3
Both the extrinsic and the intrinsic (endogenous) pathways of apoptosis are activated in experimental models of NASH.1,4 NASH is characterized by a dysregulated delivery of free fatty acids to the liver because of impaired insulin sensitivity. Free fatty acids induce lipoapoptosis in many cell types, including hepatocytes. Free fatty acids can activate the lysosomal pathway of cell death5 and sensitize hepatocytes to tumor necrosis factor–related apoptosis-inducing ligand (TRAIL)-mediated apoptosis.6 Moreover, steatotic livers are sensitized to Fas- and TRAIL-mediated apoptosis.7,8 Hepatocyte apoptosis is increased in patients with NASH and correlates with disease severity and stage of fibrosis, thus suggesting a pathogenic role for apoptosis in the progression of the disease.9 Death receptor expression, especially Fas and TNF receptor-1 (TNF-R1), is significantly enhanced in patients with NASH.9
Because apoptosis is a critical mediator of inflammation and fibrosis in liver disease, inhibiting apoptosis may theoretically be a useful therapeutic approach. Therefore, oral, small-molecule antiapoptotic agents have been developed. GS-9450 is a caspase inhibitor with selective activity against caspases 1, 8, and 9. Caspase-8 is a key initiating caspase essential for apoptosis induced by all three death receptors (Fas, TNF-R1, and TRAIL receptors 1 and 2).10 Short-term treatment with GS-9450 can cause reductions in alanine aminotransferase (ALT) levels in patients with chronic hepatitis C virus (HCV) infection,11 which is also accompanied by increased hepatocyte apoptosis. Given the potential for GS-9450 in treating apoptosis-mediated liver injury, we sought to evaluate the safety and activity of GS-9450 in a proof-of-concept, 4-week pilot trial in subjects with NASH.
Subjects and Methods
Subjects
Eligible subjects were adults 18–75 years of age with ALT > 60 U/L (as measured at a central laboratory), a fatty liver as judged by ultrasound, and biopsy findings consistent with NASH without evidence of cirrhosis. The liver biopsy was required during screening if none had been performed in the previous 12 months. The histological diagnosis of NASH was made by the local pathologist, without a central reading, and was based on the presence of steatosis (>5% of hepatocytes containing liver fat), hepatocyte ballooning, and lobular inflammation, regardless of the amount of fibrosis. Subjects were required to have a platelet count ≥ 75,000/mm3, absolute neutrophil count ≥ 1500/mm3, hemoglobin ≥ 11.0 g/dL, and creatinine clearance ≥ 70 mL/min as calculated with the Cockcroft-Gault equation. Subjects with non–insulin-dependent diabetes for < 10 years were eligible if the diabetes had been managed with non-glitazone medications for at least 6 months before screening. Subjects who had either received glitazone treatment within 6 months of screening or had peripheral diabetic neuropathy or gastroparesis were not eligible.
Subjects were required to have a stable weight (i.e., no weight loss > 4%) for 8 weeks before screening and to maintain consistent diet, food intake, and physical exercise during the study. Subjects with any other cause of liver disease (e.g., viral hepatitis, autoimmune hepatitis, hemochromatosis, and others) were excluded, as were subjects with hepatocellular carcinoma (HCC). Subjects were not included if their daily alcohol consumption was higher than 30 g in males and 20 g in females. Subjects with drug-induced or other forms of secondary NASH were also excluded. All subjects provided written informed consent before undertaking any study-related procedures.
Study Design
This was a Phase 2, randomized, double-blind, parallel-group, placebo-controlled, multicenter, international study investigating the safety, tolerability, and activity of multiple oral doses of GS-9450 in adults with NASH. Qualifying subjects were stratified by the presence or absence of type 2 diabetes (i.e., on or off oral diabetic medication at study entry) and by geographic region. After stratification, subjects were randomly assigned (1:1:1:1:1) to one of five parallel treatment groups: placebo or GS-9450 1 mg, 5 mg, 10 mg, or 40 mg administered orally once daily for 4 weeks. On completion of treatment, subjects entered a 4-week follow-up period.
Because of the exploratory nature of this study, no formal power or sample size calculations were used to determine sample size. The number of subjects per treatment arm was chosen empirically based on experience with change in ALT in previous studies (Supporting Table 1).
Before study initiation, each institution’s Independent Ethics Committee or Institutional Review Board reviewed and approved the study. During the study, all available safety and tolerability data were reviewed by an independent Data Monitoring Committee.
Efficacy Assessments
Serum ALT and AST Values
Absolute and percent change from baseline in ALT and aspartate aminotransferase (AST) were evaluated on day 3, at weeks 1, 2, 3, and 4 of the on-treatment period, and at weeks 1, 2, 3, and 4 of the follow-up period. Percent of subjects achieving ALT and AST normalization at various time points was also evaluated. Normal levels were defined as follows: 43 U/L ALT and 36 U/L AST for males, and 34 U/L ALT and 34 U/L AST for females.
Cytokeratin-18 Fragments
Blood samples were collected at the week-2 and week-4 study visits for analysis of serum caspase-3–cleaved cytokeratin (CK)-18 fragments. CK-18 fragments were measured using the M30-Apoptosense enzyme-linked immunosorbent assay (ELISA) kit (Peviva AB, Stockholm, Sweden) in assays conducted by Esoterix, Inc. (LabCorp; Austin, TX).
Pharmacokinetic Assessments
Concentrations of GS-9450 were determined in plasma by using a validated bioanalytical assay. Steady-state plasma pharmacokinetic parameters of GS-9450 assessed during weeks 2–4 included maximum observed concentration of drug in plasma (Cmax), time of Cmax (Tmax), half-life (T1/2), and area under the plasma concentration versus time curve over the dosing interval (AUCtau). Trough concentrations were determined from samples collected during treatment visits at weeks 1, 2, 3, and 4 and at the follow-up week-1 visit.
Safety Assessments
Safety was evaluated by assessment of clinical laboratory tests, physical examinations, vital signs measurements, 12-lead electrocardiograms, and documentation of adverse events (AEs). Fatigue was self-reported without the use of a specific symptom score. Concomitant medication intake was also recorded. All safety laboratory measurements were performed by Covance Central Laboratory Services (Indianapolis, IN).
Endpoints and Statistical Analyses
The primary efficacy endpoints were the absolute and percent changes from baseline in ALT levels, AST levels, and CK-18 fragment levels at week 4.
The primary analysis set for efficacy included all randomized subjects who received at least one dose of study drug. Absolute and percent change from baseline in ALT levels, AST levels, and CK-18 fragment levels at week 4 were assessed by an analysis of covariance (ANCOVA) model with adjustment for baseline values. For pairwise treatment comparison involving placebo, GS-9450 40 mg was compared first. The GS-9450 10-mg, 5-mg, and 1-mg pairwise comparisons with placebo were then considered sequentially to minimize the family-wise type I error. P values and 95% confidence intervals around the treatment group differences were calculated. As an exploratory analysis, the linear relationship between the percent measurable change from baseline for ALT at weeks 2, 3, and 4 versus dose at week 4 was evaluated.
The pharmacokinetic analysis set included all subjects who had evaluable pharmacokinetic profiles. Plasma concentration–time data for each subject were analyzed using standard noncompartmental methods to compute pharmacokinetic parameters. The primary method for evaluating dose proportionality was based on AUCtau and Cmax using a power model that was fitted using all fasted doses. To explore GS-9450 exposure–response relationships, standard pharmacodynamic models (e.g., inhibitory Emax, inhibitory sigmoid Emax, linear) were fit to the timeweighted average change in CK-18 fragments and ALT from baseline to week 4 and the corresponding AUCtau and Cmax values for all subjects. Modeling was performed using WinNonlin (version 5.2; Pharsight Corp., Mountain View, CA); model discrimination was performed by comparing Akaike Information Criteria, attainment of reasonable parameter estimates, and reproducibility of parameter estimate outputs, given variable initial conditions.
The safety analysis set included all randomized subjects who received at least one dose of study drug. Safety data were summarized by incidence of treatment-emergent AEs and laboratory abnormalities or descriptive statistical summaries.
Results
Subject Population
Between September 2008 and August 2009, 254 subjects were screened and 124 subjects were randomized, treated, and completed study procedures at 41 study sites, including 35 in the United States and 6 in France (Fig. 1). The most common reason for screening failure was ALT level below 60 IU/L (n = 90). Subjects were predominantly male (70%), and the majority (85%) were white (Table 1). At screening, across the treatment groups, mean ALT levels ranged from 94 to 109 U/L, and creatinine clearance ranged from 92 to 102 mL/min. The majority of subjects (84%) did not have type 2 diabetes. All groups had comparable baseline body mass index (BMI), insulin resistance surrogate markers (homeostasis model of insulin resistance [HOMA-IR] in nondiabetics), and aminotransferase values. All subjects had biopsy findings consistent with steatohepatitis as judged by a local pathologist, and no subjects had cirrhosis. A minority (n = 16, 13%) had advanced fibrosis. Nonalcoholic fatty liver disease activity scoring (NAS) by central pathologist overread was not employed for this shortterm, 4-week study.
Fig. 1.

Subject disposition throughout the study.
Table 1.
Subject Demographic and Baseline Disease Characteristics
| Characteristic | GS-9450 1 mg (n = 26) | 5 mg (n = 26) | 10 mg (n = 24) | 40 mg (n = 25) | Placebo (n = 23) |
|---|---|---|---|---|---|
| Male sex, no. (%) | 19 (73) | 21 (81) | 13 (54) | 17 (68) | 17 (74) |
| Ethnicity, no. (%)a | |||||
| Non-Hispanic/Latino | 22 (85) | 19 (73) | 18 (75) | 19 (76) | 18 (78) |
| Hispanic/Latino | 4 (15) | 7 (27) | 6 (25) | 5 (20) | 5 (21) |
| Race, no. (%) | |||||
| White | 20 (77) | 21 (81) | 24 (100) | 23 (92) | 18 (78) |
| Asian | 3 (12) | 2 (8) | 0 | 1 (4) | 2 (9) |
| American Indian or Alaska Native | 0 | 1 (4) | 0 | 0 | 1 (4) |
| Black or African-American | 0 | 0 | 0 | 1 (4) | 1 (4) |
| Other | 3 (12) | 2 (8) | 0 | 0 | 1 (4) |
| Type 2 diabetes status, no. (%) | |||||
| Absent | 22 (85) | 22 (85) | 20 (83) | 22 (88) | 18 (78) |
| Present | 4 (15) | 4 (15) | 4 (17) | 3 (12) | 5 (22) |
| Median (Q1, Q3) values | |||||
| Age, years | 49 (35, 53) | 48 (38, 53) | 45 (33, 55) | 44 (31, 51) | 51 (42, 59) |
| Weight, kg | 98 (84, 118) | 102 (90, 112) | 99 (90, 117) | 101 (85, 107) | 106 (80, 112) |
| BMI, kg/m2 | 35 (30, 39) | 33 (31, 38) | 35 (31, 36) | 33 (30, 36) | 34 (27, 40) |
| Serum glucose, mg/dL | 103 (90, 134) | 99 (90, 114) | 99 (89, 109) | 98 (89, 113) | 101 (94, 147) |
| Insulin, μIU/mL | 14.3 (9.1, 23.8) | 17.6 (10.4, 19.5) | 16.7 (10.3, 22.0) | 16.5 (11.5, 33.5) | 18.7 (13.2, 27.8) |
| HOMA-IR | 4.4 (2.1, 5.9) | 3.9 (2.5, 4.9) | 3.7 (2.5, 5.9) | 3.8 (2.5, 9.34) | 4.5 (3.2, 8.1) |
| Triglycerides, mg/dL | 178 (124, 266) | 175 (136, 224) | 178 (113, 273) | 146 (106, 184) | 198 (171, 356) |
| ALT, U/L | 88 (68, 123) | 91 (70, 125) | 80 (70, 122) | 79 (71, 115) | 84 (65, 140) |
| AST, U/L | 49 (34, 79) | 57 (38, 73) | 51 (42, 68) | 48 (39, 57) | 60 (43, 114) |
| CK-18 fragments, U/L | 583 (380, 879) | 858 (360, 1339) | 540 (430, 1235) | 562 (402, 778) | 639 (449, 1335) |
ALT, alanine aminotransferase; AST, aspartate aminotransferase; CK-18, cytokeratin-18; HOMA-IR, homeostasis model assessment of insulin resistance.
One subject who received 40 mg GS-9450 did not have a reported ethnicity.
Efficacy Assessments
ALT
At week 4, reductions in ALT levels were greater in GS-9450 treatment groups than placebo, with mean (SD) changes from baseline ranging from −14 (40) to −47 (43) U/L in the GS-9450 groups versus −2 (30) in the placebo group (Table 2). Reductions in ALT were most substantial in the group receiving 40 mg GS-9450, in which mean absolute ALT values decreased from 106 U/L at baseline to 62 U/L at week 4, and the proportion of subjects with normal ALT increased from 0% at baseline to 35% at week 4 (Fig. 2).
Table 2.
Mean (SD in Parentheses) and Percent Changes in ALT, AST, and CK-18 Fragments
| Baseline | Change at Week 2 | Change at Week 4 | %Change at Week 4 | |
|---|---|---|---|---|
| ALT, U/L | ||||
| Placeboa | 109 (76) | −14 (80) | −2 (30) | −2 (29) |
| GS-9450 | ||||
| 1 mgb | 97 (44) | −17 (31) | −14 (40) | −8 (41) |
| 5 mgc | 101 (38) | −35 (18) | −30 (26) | −28 (21) |
| 10 mgd | 94 (38) | −37 (23) | −30 (26) | −30 (20) |
| 40 mge | 106 (79) | −46 (46) | −47 (43) | −43 (19) |
| AST, U/L | ||||
| Placeboa | 81 (58) | −8 (63) | −3 (27) | −2 (42) |
| GS-9450 | ||||
| 1 mgb | 67 (46) | −4 (36) | −8 (35) | −2 (41) |
| 5 mgc | 62 (31) | −12 (16) | −5 (24) | −6 (38) |
| 10 mgf | 68 (46) | −22 (34) | −12 (36) | −16 (29) |
| 40 mge | 57 (35) | −16 (20) | −13 (20) | −20 (26) |
| CK&-18 fragments, U/L | ||||
| Placebog | 989 (820) | 34 (545) | −96 (619) | 12 (73) |
| GS-9450 | ||||
| 1 mgh | 652 (380) | 164 (384) | 192 (584) | 23 (81) |
| 5 mgi | 922 (691) | −116 (608) | 96 (641) | 25 (120) |
| 10 mgj | 1035 (1147) | −460 (866) | −393 (723) | −26 (38) |
| 40 mgk | 725 (655) | −140 (490) | −125 (212) | −19 (32) |
n = 23 at baseline and 22 at week 4.
n = 26.
n = 26 at baseline and 25 at week 4.
n = 24 at baseline, 22 at week 2, and 23 at week 4.
n = 25 at baseline, 24 at week 2, and 23 at week 4.
n = 24 at baseline and 22 at weeks 2 and 4.
n = 23 at baseline, 21 at week 2, and 23 at week 4.
n = 26 at baseline, 24 at week 2, and 25 at week 4.
n = 26 at baseline, 25 at week 2, and 26 at week 4.
n = 24 at baseline, 23 at week 2, and 20 at week 4.
n = 25 at baseline, 24 at week 2, and 22 at week 4.
Fig. 2.

Percent of subjects with normal ALT. After 4 weeks of treatment, the GS-9450 40-mg group had the highest proportion of subjects achieving ALT normalization, defined as 43 U/L for males and 34 U/L for females. P values versus the placebo arm at 4 weeks of treatment: P = 0.07 for the 40-mg arm; P = 0.41 for the 10-mg arm; P = 0.42 for the 5-mg arm; P = 1 for the 1-mg group.
Reductions in ALT occurred in a dose–response manner, with the greatest activity observed with 40 mg GS-9450 daily (Table 3). In a linear regression model, the percent measurable change in ALT at week 4 versus dose was highly significant (P < 0.0001; Fig. 3). In the 40-mg GS-9450 dose group, only two subjects (8%) were nonresponders at week 4, meaning they had a decrease in ALT of <10% relative to baseline.
Table 3.
Analysis of Covariance of ALT Changes From Baseline to Week 4a
| Statistical Model/Comparison | Least Squares Means | Difference | P | ||
|---|---|---|---|---|---|
|
|
|
||||
| GS-9450 (T) | Placebo (R) | T − R | 95% CI | ||
| Observed change from baseline to week 4 in ALT (U/L) using an ANCOVA model | |||||
| 40 mg GS-9450 vs. pooled placebo | −43 | −4 | −39 | (−55, −23) | <0.0001 |
| 10 mg GS-9450 vs. pooled placebo | −32 | −4 | −28 | (−44, −12) | 0.0007 |
| 5 mg GS-9450 vs. pooled placebo | −29 | −4 | −25 | (−41, −9) | 0.0019 |
| 1 mg GS-9450 vs. pooled placebo | −15 | −4 | −11 | (−26, 4) | 0.1595 |
| Overall treatment | <0.0001 | ||||
| Percent change from baseline to week 4 in ALT (U/L) using an ANCOVA model | |||||
| 40 mg GS-9450 vs. pooled placebo | −42 | −2 | −40 | (−56, −24) | <0.0001 |
| 10 mg GS-9450 vs. pooled placebo | −31 | −2 | −28 | (−45, −12) | 0.0006 |
| 5 mg GS-9450 vs. pooled placebo | −28 | −2 | −26 | (−41, −10) | 0.0017 |
| 1 mg GS-9450 vs. pooled placebo | −8 | −2 | −6 | (−22, 10) | 0.4539 |
| Overall treatment | <0.0001 | ||||
Baseline was defined as the last available measurement before study drug administration. SAS PROC MIXED was performed with treatment and baseline as fixed effects. No adjustment was made for multiple comparisons. To protect family-wise type I error, for pairwise treatment comparisons involving placebo, GS-9450 40, 10, 5, and 1 mg qd were compared sequentially. Mixed model covariance parameter estimates: rMSE, square root of mean square error.
Fig. 3.

Percent measurable change of ALT at week 4. In a linear regression of percent measurable change in ALT levels (change from baseline/[baseline − 20 U/L]), the percent measurable change at week 4 versus dose was highly significant (P < 0.0001). An outlier value of 600 for percent measurable change of ALT at week 4 was excluded from the assessments.
The ALT reduction produced by GS-9450 was offset within 1 week of stopping study medication and was evident at the first off-treatment follow-up visit. For the 1-mg, 5-mg, and 10-mg dose groups, ALT levels at follow-up weeks 2, 3, and 4 were similar to baseline. For the GS-9450 40-mg group, mean ALT change from baseline was 16 IU/L at follow-up week 2, 13 IU/L at follow-up week 3, and 12 IU/L at follow-up week 4. In the placebo group, ALT levels showed little change throughout treatment and followup. No subject with a grade 3 ALT elevation upon discontinuation had a value higher than three times baseline.
AST
Treatment with GS-9450 also resulted in dose-dependent AST reductions. Across the GS-9450 treatment groups, AST levels decreased over the first week of treatment, with mean changes from baseline ranging from −9 (23) to −27 (29) U/L. However, by treatment week 4, mean (SD) changes in AST ranged from −5 (24) to −13 (20) U/L in the GS-9450 treatment groups versus −3 (27) in the placebo group. The greatest mean change in AST at week 4 occurred in the group receiving GS-9450 40 mg (Table 2). The proportion of subjects with normal AST in the 40-mg GS-9450 group increased from 20% at baseline to 48% at week 4, with a peak of 77% at day 3. Mean AST increased to modestly above baseline levels in all GS-9450 treatment groups within 1 week of stopping study medication.
Cytokeratin-18 Fragments
CK-18 fragment values declined in the two highest GS-9450 dose groups (Table 2): for the 10-mg group, mean (SD) change from baseline to week 4 was −393 (723) U/L, and for the 40-mg group, the mean (SD) change was −125 (212) U/L. However, the differences between each of the GS-9450 groups (40, 10, 5, and 1 mg) and placebo for the absolute and percent changes from baseline at week 4 were not significant (P > 0.05 for all comparisons).
Additional Biomarkers
Treatment with GS-9450 did not have obvious effects on markers of insulin resistance. Median changes from baseline to week 4 for GS-9450 1 mg, 5 mg, 10 mg, 40 mg and placebo, respectively, were as follows: serum glucose −0.5, 5, 12, 0, 6 mg/dL; insulin −3.13, 3.55, 2.21, −1.68, 2.23 μIU/mL; HOMA-IR −1.07, 0.82, 0.71, −0.35, 1.48; triglyceride 0, 28, −3, −7, −5 mg/dL; highdensity lipoprotein −1, −2, −2, −2, −2 mg/dL; and γ-glutamyl transpeptidase −3, −8, −3, −4, −3 U/L. During the 4-week trial period, median body weight within each treatment group was unchanged.
Pharmacokinetic and Pharmacodynamic Assessments
Under fasting conditions, GS-9450 reached peak plasma concentrations in approximately 2–3 hours (median Tmax). Multiple-dose median T1/2 values ranged between 13 and 14 hours. GS-9450 Cmax was dose-proportional from 1 to 40 mg. Mean predose and 24-hour postdose and GS-9450 concentrations indicated that steady state had been reached by 2–4 weeks of daily dosing in all dose groups (Fig. 4).
Fig. 4.
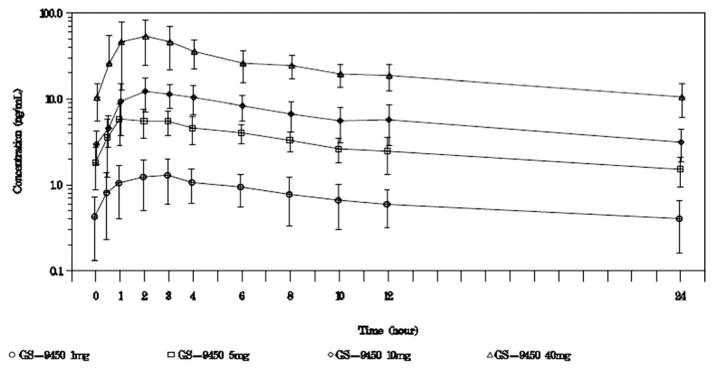
Mean (SD) steady-state GS-9450 concentration-versus-time profiles. GS-9450 was quantifiable over the dosing interval for all treatment groups. Examination of the mean and median GS-9450 trough values and mean predose and 24-hour post-dose concentrations achieved during serial pharmacokinetic assessment for each group indicated that steady state had been reached by 2–4 weeks of daily dosing.
Exploratory pharmacokinetic and pharmacodynamic modeling revealed that inhibitory Emax models provided best fit of GS-9450 exposure for differences between time-weighted averages at week 4 in ALT and CK-18 fragments. For the week 4 difference in ALT or CK-18 fragments, the mean exposure produced with 40 mg GS-9450 appeared to mediate a response at least 82% of the maximal effect achievable with GS-9450.
Safety Assessments
The frequency of treatment-emergent AEs during the 4-week on-treatment period was 77% for the GS-9450 1-mg group, 85% for the GS-9450 5-mg group, 75% for the GS-9450 10-mg group, 80% for the GS-9450 40-mg group, and 57% for the placebo group. The most common AEs (occurring in ≥ 6 subjects [5%] overall) during the on-treatment period were diarrhea, nausea, abdominal pain upper, abdominal pain, dyspepsia, fatigue, arthralgia, back pain, and headache (Table 4). Most treatment-emergent AEs were considered by the investigator to be of mild or moderate intensity. Treatment-emergent severe AEs included abscess, type 2 diabetes mellitus, back pain, arthralgia, osteoarthritis, pain in the extremity, and carpal tunnel syndrome. All of these events were considered to be unrelated to study drug, except for the event of pain in the extremity.
Table 4.
Adverse Events (AEs) Occurring During Treatment
| Adverse Events, n (%) | GS-9450 1 mg (n = 26) | 5 mg (n = 26) | 10 mg (n = 24) | 40 mg (n = 25) | Placebo (n = 23) |
|---|---|---|---|---|---|
| No. of subjects with at least one AE | 20 (77) | 22 (85) | 18 (75) | 20 (80) | 13 (57) |
| Total no. of events | 62 | 64 | 67 | 60 | 48 |
| Gastrointestinal disorders | |||||
| Diarrhea | 2 (8) | 6 (23) | 6 (25) | 5 (20) | 2 (9) |
| Nausea | 3 (12) | 1 (4) | 3 (13) | 3 (12) | 1 (4) |
| Abdominal pain upper | 1 (4) | 1 (4) | 4 (17) | 1 (4) | 0 |
| Abdominal pain | 1 (4) | 2 (8) | 1 (4) | 1 (4) | 1 (4) |
| Dyspepsia | 2 (8) | 2 (8) | 1 (4) | 1 (4) | 0 |
| Constipation | 2 (8) | 0 | 0 | 2 (8) | 1 (4) |
| Dry mouth | 1 (4) | 0 | 2 (8) | 1 (4) | 0 |
| Gastroesophageal reflux disease | 0 | 0 | 0 | 3 (12) | 1 (4) |
| General disorders and administration site conditions | |||||
| Fatigue | 6 (23) | 5 (19) | 2 (8) | 2 (8) | 5 (22) |
| Asthenia | 1 (4) | 1 (4) | 1 (4) | 0 | 1 (4) |
| Infections and infestations | |||||
| Nasopharyngitis | 2 (8) | 0 | 0 | 2 (8) | 1 (4) |
| Musculoskeletal and connective tissue disorders | |||||
| Arthralgia | 1 (4) | 3 (12) | 1 (4) | 3 (12) | 0 |
| Back pain | 1 (4) | 2 (8) | 0 | 1 (4) | 2 (9) |
| Pain in extremity | 1 (4) | 0 | 1 (4) | 2 (8) | 0 |
| Nervous system disorders | |||||
| Headache | 4 (15) | 7 (27) | 4 (17) | 4 (16) | 5 (22) |
| Dizziness | 2 (8) | 0 | 0 | 2 (8) | 1 (4) |
| Somnolence | 1 (4) | 2 (8) | 0 | 0 | 0 |
There were no deaths reported during the study. There were no serious AEs (SAEs) during the on-treatment period of the study; however, three SAEs were reported off-treatment by two subjects. One subject who received 1 mg GS-9450 had two episodes of pancreatitis, both of which resolved and were considered unrelated to study drug; this subject had a history of multiple prior episodes of pancreatitis and a history of dilatation and stenting of the sphincter of Oddi. One subject in the GS-9450 10-mg group developed hypothyroidism that occurred after study completion and database lock. This event was reported as related to study drug. In retrospect, high-titer antithyroglobulin antibody levels were found in screening and baseline samples.
One subject, taking GS-9450 40 mg, left the study because of a treatment-related AE of moderate facial flushing that started on day 1. This subject received her last dose of study drug on day 9, and the event resolved on day 25.
The percentage of subjects with at least one treatment-emergent grade 3 or 4 laboratory abnormality ranged from 12% to 17% across the GS-9450 treatment groups and was 35% in the placebo group. Treatment-emergent grade 3 or 4 laboratory abnormalities that occurred in more than one subject during the on-treatment period in the overall study included elevated ALT (all grade 3: one subject in the 1-mg group, two subjects on placebo), elevated AST (one grade 4 associated with elevated creatine kinase in the 1-mg group; grade 3 in three placebo subjects, one subject in the 5- and two in the 10-mg group), elevated serum lipase (one subject in the 5-mg group, one in placebo), and elevated serum glucose, urine blood, and urine glucose. No subjects had total bilirubin values ≥ 2 mg/dL concurrently with grade 3 or 4 ALT or AST abnormalities. One subject receiving 40 mg GS-9450 had an isolated grade 3 bilirubin value (3.1 mg/dL) at week 2, but this value was similar to screening, and subsequent levels were at or below pretreatment. None of these grade 3–4 laboratory abnormalities resulted in discontinuation of study drug treatment. Overall, there was no clearly evident on-treatment pattern of clinically relevant changes in laboratory assessments or specific laboratory abnormalities observed following 4 weeks of treatment with GS-9450.
Discussion
This study provides evidence that apoptosis inhibition results in biochemical improvement in aminotransferase values in subjects with NASH, a highly prevalent disease with no established, effective pharmacological therapy. Four weeks of daily dosing with a selective caspase inhibitor, GS-9450, resulted in significant, dose-dependent reductions in ALT. The highest reductions occurred in the 40-mg group, with one third of treated subjects experiencing ALT normalization over the treatment interval. This reduction in ALT levels occurred as early as the third day of treatment, which suggests that inhibition of apoptosis may be directly linked to lower ALT levels. The reduction in ALT was maintained throughout dosing. In contrast, ALT values were stable in subjects who received placebo. In the highest GS-9450 dose group, only two patients were nonresponders, thus suggesting a strong effect of the drug in most exposed individuals with NASH. A linear regression analysis of percent measurable change in ALT levels versus dose was statistically significant for all on-treatment weeks tested (P < 0.0001 for week 4).
This analysis suggests that a robust reduction in ALT levels can be achieved regardless of the baseline ALT level. The ALT values returned to pretreatment levels or higher on discontinuation of the drug. Similar posttreatment ALT increases have been documented with another pancaspase inhibitor in HCV-infected subjects.12 This suggests that long-term treatment is necessary for maintained benefit, and therefore a careful assessment of long-term safety will be crucial in future trials.
The therapeutic value of an anticaspase in humans was first evaluated with IDN-6556, a broad-spectrum, irreversible, specific caspase inhibitor that blocks Fas-induced apoptosis in vitro and in animal models.13,14 A 14-day treatment regimen in subjects with a variety of chronic liver diseases, mostly chronic hepatitis C, resulted in 31%–59% reductions in ALT without a clear dose–effect relationship.15 Only five subjects had NASH, and ALT reduction in these few subjects was reported to reach 59%. The results in subjects with HCV infection were subsequently confirmed in a larger study in which a consistent reduction in ALT activity, ranging from 36% to 46%, was apparent after only 1 week of administration.12 However, no results are available for a larger cohort of patients with NASH.
It is tempting to speculate that reduction in ALT levels reflects improvement in liver injury. The latter can only be defined histologically, but some data indicate that ALT is a valid proxy for evaluating improvement in hepatic necroinflammation. In liver diseases such as HBV or HCV infection or autoimmune hepatitis, successful treatment results in a significant reduction in ALT levels. Drugs that have shown some histological efficacy in NASH also reduced ALT levels.16–19 In a study that compared 2 years of treatment with ursodeoxycholic acid (UDCA) to placebo, rates of ALT change during treatment were significantly correlated with changes in inflammation but not steatosis or fibrosis.20 ALT changes alone predicted histologic improvement or worsening, as shown by area under the receiver operating characteristic curves (0.72–0.77).20 Therefore, the current trial, which demonstrates a strong and sustained ALT reduction, suggests that GS-9450 may improve hepatic injury, although this will need to be tested in larger, longer term studies.
Experimental studies have shown that pancaspase inhibitors such as VX-166 reduce hepatocyte apoptosis, hepatocellular damage (ALT levels), and oxidative stress.21 A significant improvement in hepatic inflammation was observed as the overall NAS activity score declined together with a reduction in TNF-α and monocyte chemoattractant protein 1 (MCP1) hepatic expression, two potent proinflammatory and chemotactic cytokines.21 Additionally, in some experimental conditions, pancaspase inhibition with VX-166 was able to block fibrogenesis, as evidenced by a reduction in collagen deposition and in α-smooth-muscle actin, collagen, and hydroxyproline expression in the liver.22
CK-18 (the M30 fragment) has been proposed as a serum marker of hepatocyte apoptosis in both NASH23,24 and HCV.25 In a group of 139 subjects with biopsy-proven nonalcoholic fatty liver disease (NAFLD) and 150 controls, CK-18 fragments predicted histological NASH.26 However, patients with steatosis alone, despite increased apoptosis, had similar CK-18 levels as controls.26 Another study reported an insufficient sensitivity and specificity of CK-18 alone for the diagnosis of steatohepatitis.27 Moreover, CK-18 levels were correlated not only with steatohepatitis but also with overall severity of liver disease, in particular the stage of fibrosis,26 which strongly suggests that other aspects of liver injury might confound its diagnostic accuracy toward NASH. Collectively, these data suggest that the relationship between the extent of apoptosis and CK-18 levels may be confounded by other aspects of liver injury. In the current study, although values of CK-18 fragments decreased in response to GS-9450 treatment in the two highest dose groups, the sensitivity of this experimental marker was insufficient in the short term to discern a dose–response relationship manifestly evident by ALT response.
Long-term use of antiapoptotic agents raises the theoretical concern of increased risk of neoplastic transformation. Although this possibility must be carefully addressed in future investigations of this class of drugs, several factors suggest that the risk may not be increased. GS-9450 is preferentially concentrated in the liver; therefore, exposure of other organs should be considerably reduced. GS-9450 is not a pancaspase but rather a selective caspase inhibitor, which does not directly block caspase-3 activity or the endogenous pathway of apoptosis. Residual apoptotic activity is allowed to proceed. Moreover, the simple view that abrogating apoptosis will result in a higher incidence of tumors has been challenged.28
Mice lacking myeloid cell leukemia-1, a survival factor from the Bcl-2 family, have increased apoptosis, which translates into development of malignant HCC-like lesions.29 In these mice, HCC formation is observed in the background of fibrosis but in the absence of apparent inflammatory responses, thus indicating that liver carcinogenesis is promoted by enhanced and ‘‘clean’’ apoptosis.28 Several explanations may account for this apparent paradox. An increased apoptotic environment correlates with elevated hepatic proliferation,29 possibly related to nonapoptotic functions of caspases such as cellular activation, proliferation, or differentiation.30,31 Increased apoptosis might also result in up-regulation of surviving,29 a molecule highly expressed in numerous cancers and involved in cell cycle progression and proliferation.32 These data suggest that whereas physiologic apoptosis helps protect from cancer, excessive apoptosis might, at least in some experimental situations, enhance neoplastic transformation.
Extrapolation of these intriguing findings to human disease states is, at this point, speculative. In the current trial we excluded subjects with cirrhosis, a preneoplastic state, because they are at high risk for malignant transformation. Safety data on long-term exposure to antiapoptotic agents should be obtained before further antiapoptotic agents are considered as valid longer term treatment strategies for liver disease patients.
In this study we did not detect any effect of anti-caspase treatment on surrogate markers of insulin resistance or on parameters associated with the metabolic syndrome (glucose, insulin, and lipid measurements). This is not unexpected, as inhibiting hepatocyte apoptosis should result in a direct hepatoprotective effect with no apparent insulin-sensitizing potency.33 Other antiapoptotic agents might have additional beneficial effects on insulin resistance, thus widening the interest of this class of agents for the treatment of NASH. For instance, recent data have shown that the proapoptotic receptor Fas is up-regulated in adipose tissue of obese and diabetic patients, in whom it can mediate inflammatory pathways.34 Abrogating Fas expression specifically in adipose tissue of mice fed a high-fat diet prevented whole-body and adipose tissue insulin resistance and protected the animals against hepatic steatosis.34 Whether antiapoptotic agents administered for a longer duration could reproduce these effects needs to be further tested and, if confirmed, could be a particularly exciting development for the treatment of NASH.
In this trial GS-9450 was safe and well tolerated; no adverse event types occurred more frequently with GS-9450 than placebo. No treatment-emergent grade 3 or 4 ALT elevations were observed in any of the 75 patients during dosing with 5, 10, or 40 mg GS-9450 daily. However, in a larger, 6-month study in hepatitis C subjects, episodes of drug-induced liver injury attributable to GS-9450 occurred, and the trial was terminated early.
In summary, in this proof-of-principle, randomized, placebo-controlled trial, 4 weeks of treatment with the GS-9450 selective caspase inhibitor resulted in significant declines in ALT levels and smaller nonstatistically significant reductions in AST and CK-18 fragments in patients with NASH. This finding suggests that reducing apoptosis may be a valuable therapeutic strategy in patients with NASH. Safe and effective antiapoptotic agents should therefore be considered for further clinical evaluation in this disease.
Supplementary Material
Acknowledgments
Supported by Gilead Sciences.
A full list of investigators is provided in the Appendix, in the Supporting Material. Jennifer King, Ph.D., of August Editorial, helped prepare the manuscript.
Abbreviations
- AE
adverse event
- ALT
alanine aminotransferase
- AST
aspartate aminotransferase
- ANCOVA
analysis of covariance
- AUCtau
area under the plasma concentration versus time curve over the dosing interval
- BMI
body mass index
- CI
confidence interval
- CK-18
cytokeratin-18
- Cmax
maximum observed concentration of drug in plasma
- HCC
hepatocellular carcinoma
- HOMA-IR
homeostasis model of insulin resistance
- NASH
nonalcoholic steatohepatitis
- SAE
serious adverse event
- Tmax
time of Cmax
- T1/2
half-life
Footnotes
Potential conflict of interest: V.R. has received funding from Gilead Sciences, Astellas Pharma, and Roche and has served as a consultant for Astellas, Axcan, Genentech, Gilead, Roche, and Sanofi.
Additional Supporting Information may be found in the online version of this article.
References
- 1.Syn WK, Choi SS, Diehl AM. Apoptosis and cytokines in non-alcoholic steatohepatitis. Clin Liver Dis. 2009;13:565–580. doi: 10.1016/j.cld.2009.07.003. [DOI] [PMC free article] [PubMed] [Google Scholar]
- 2.Canbay A, Guicciardi ME, Higuchi H, Feldstein A, Bronk SF, Rydzewski R, et al. Cathepsin B inactivation attenuates hepatic injury and fibrosis during cholestasis. J Clin Invest. 2003;112:152–159. doi: 10.1172/JCI17740. [DOI] [PMC free article] [PubMed] [Google Scholar]
- 3.Canbay A, Taimr P, Torok N, Higuchi H, Friedman S, Gores GJ. Apoptotic body engulfment by a human stellate cell line is profibrogenic. Lab Invest. 2003;83:655–663. doi: 10.1097/01.lab.0000069036.63405.5c. [DOI] [PubMed] [Google Scholar]
- 4.Farrell GC, Larter CZ, Hou JY, Zhang RH, Yeh MM, Williams J, et al. Apoptosis in experimental NASH is associated with p53 activation and TRAIL receptor expression. J Gastroenterol Hepatol. 2009;24:443–452. doi: 10.1111/j.1440-1746.2009.05785.x. [DOI] [PubMed] [Google Scholar]
- 5.Feldstein AE, Werneburg NW, Canbay A, Guicciardi ME, Bronk SF, Rydzewski R, et al. Free fatty acids promote hepatic lipotoxicity by stimulating TNF-alpha expression via a lysosomal pathway. Hepatology. 2004;40:185–194. doi: 10.1002/hep.20283. [DOI] [PubMed] [Google Scholar]
- 6.Malhi H, Barreyro FJ, Isomoto H, Bronk SF, Gores GJ. Free fatty acids sensitise hepatocytes to TRAIL mediated cytotoxicity. Gut. 2007;56:1124–1131. doi: 10.1136/gut.2006.118059. [DOI] [PMC free article] [PubMed] [Google Scholar]
- 7.Volkmann X, Fischer U, Bahr MJ, Ott M, Lehner F, Macfarlane M, et al. Increased hepatotoxicity of tumor necrosis factor-related apoptosis-inducing ligand in diseased human liver. Hepatology. 2007;46:1498–1508. doi: 10.1002/hep.21846. [DOI] [PubMed] [Google Scholar]
- 8.Feldstein AE, Canbay A, Guicciardi ME, Higuchi H, Bronk SF, Gores GJ. Diet associated hepatic steatosis sensitizes to Fas mediated liver injury in mice. J Hepatol. 2003;39:978–983. doi: 10.1016/s0168-8278(03)00460-4. [DOI] [PubMed] [Google Scholar]
- 9.Feldstein AE, Canbay A, Angulo P, Taniai M, Burgart LJ, Lindor KD, et al. Hepatocyte apoptosis and fas expression are prominent features of human nonalcoholic steatohepatitis. Gastroenterology. 2003;125:437–443. doi: 10.1016/s0016-5085(03)00907-7. [DOI] [PubMed] [Google Scholar]
- 10.Thorburn A. Death receptor-induced cell killing. Cell Signal. 2004;16:139–144. doi: 10.1016/j.cellsig.2003.08.007. [DOI] [PubMed] [Google Scholar]
- 11.Manns M, Lawitz E, Hoepelman AIM, Choi HJ, Lee JY, Cornpropst M, et al. Short term safety, tolerability, pharmacokinetics and preliminary activity of GS-9450, a selective caspase inhibitor, in patients with chronic HCV infection. J Hepatol. 2010;52 (Suppl 1):S133. [Google Scholar]
- 12.Shiffman ML, Pockros P, McHutchison JG, Schiff ER, Morris M, Burgess G. Clinical trial: efficacy and safety of oral PF-03491390, a pancaspase inhibitor—a randomized placebo-controlled study in patients with chronic hepatitis C. Aliment Pharmacol Therapeut. 2010;31:969–978. doi: 10.1111/j.1365-2036.2010.04264.x. [DOI] [PubMed] [Google Scholar]
- 13.Hoglen NC, Chen LS, Fisher CD, Hirakawa BP, Groessl T, Contreras PC. Characterization of IDN-6556 (3-[2-(2-tert-butyl-phenylaminooxalyl)-amino]-propionylamino]-4-oxo-5-(2,3,5,6-tetrafluoro-phenoxy)-pentanoic acid): a liver-targeted caspase inhibitor. J Pharmacol Exp Ther. 2004;309:634–640. doi: 10.1124/jpet.103.062034. [DOI] [PubMed] [Google Scholar]
- 14.Canbay A, Feldstein A, Baskin-Bey E, Bronk SF, Gores GJ. The caspase inhibitor IDN-6556 attenuates hepatic injury and fibrosis in the bile duct ligated mouse. J Pharmacol Exp Ther. 2004;308:1191–1196. doi: 10.1124/jpet.103.060129. [DOI] [PubMed] [Google Scholar]
- 15.Pockros PJ, Schiff ER, Shiffman ML, McHutchison JG, Gish RG, Afdhal NH, et al. Oral IDN-6556, an antiapoptotic caspase inhibitor, may lower aminotransferase activity in patients with chronic hepatitis C. Hepatology. 2007;46:324–329. doi: 10.1002/hep.21664. [DOI] [PubMed] [Google Scholar]
- 16.Aithal GP, Thomas JA, Kaye PV, Lawson A, Ryder SD, Spendlove I, et al. Randomized, placebo-controlled trial of pioglitazone in nondiabetic subjects with nonalcoholic steatohepatitis. Gastroenterology. 2008;135:1176–1184. doi: 10.1053/j.gastro.2008.06.047. [DOI] [PubMed] [Google Scholar]
- 17.Ratziu V, Giral P, Jacqueminet S, Charlotte F, Hartemann-Heurtier A, Serfaty L, et al. Rosiglitazone for nonalcoholic steatohepatitis: one-year results of the randomized placebo-controlled Fatty Liver Improvement with Rosiglitazone Therapy (FLIRT) Trial. Gastroenterology. 2008;135:100–110. doi: 10.1053/j.gastro.2008.03.078. [DOI] [PubMed] [Google Scholar]
- 18.Sanyal AJ, Chalasani N, Kowdley KV, McCullough A, Diehl AM, Bass NM, et al. Pioglitazone, vitamin E, or placebo for nonalcoholic steatohepatitis. N Engl J Med. 2010;362:1675–1685. doi: 10.1056/NEJMoa0907929. [DOI] [PMC free article] [PubMed] [Google Scholar]
- 19.Ratziu V, Caldwell S, Neuschwander-Tetri BA. Therapeutic trials in nonalcoholic steatohepatitis: insulin sensitizers and related methodological issues. Hepatology. 2010;52:2206–2215. doi: 10.1002/hep.24042. [DOI] [PubMed] [Google Scholar]
- 20.Suzuki A, Lymp J, Sauver JS, Angulo P, Lindor K. Values and limitations of serum aminotransferases in clinical trials of nonalcoholic steatohepatitis. Liver Int. 2006;26:1209–1216. doi: 10.1111/j.1478-3231.2006.01362.x. [DOI] [PubMed] [Google Scholar]
- 21.Anstee QM, Concas D, Kudo H, Levene A, Pollard J, Charlton P, et al. Impact of pan-caspase inhibition in animal models of established steatosis and non-alcoholic steatohepatitis. J Hepatol. 2010;53:542–550. doi: 10.1016/j.jhep.2010.03.016. [DOI] [PubMed] [Google Scholar]
- 22.Witek RP, Stone WC, Karaca FG, Syn WK, Pereira TA, Agboola KM, et al. Pan-caspase inhibitor VX-166 reduces fibrosis in an animal model of nonalcoholic steatohepatitis. Hepatology. 2009;50:1421–1430. doi: 10.1002/hep.23167. [DOI] [PubMed] [Google Scholar]
- 23.Wieckowska A, Zein NN, Yerian LM, Lopez AR, McCullough AJ, Feldstein AE. In vivo assessment of liver cell apoptosis as a novel biomarker of disease severity in nonalcoholic fatty liver disease. Hepatology. 2006;44:27–33. doi: 10.1002/hep.21223. [DOI] [PubMed] [Google Scholar]
- 24.Diab DL, Yerian L, Schauer P, Kashyap SR, Lopez R, Hazen SL, et al. Cytokeratin 18 fragment levels as a noninvasive biomarker for nonalcoholic steatohepatitis in bariatric surgery patients. Clin Gastroenterol Hepatol. 2008;6:1249–1254. doi: 10.1016/j.cgh.2008.07.016. [DOI] [PMC free article] [PubMed] [Google Scholar]
- 25.Bantel H, Lugering A, Heidemann J, Volkmann X, Poremba C, Strassburg CP, et al. Detection of apoptotic caspase activation in sera from patients with chronic HCV infection is associated with fibrotic liver injury. Hepatology. 2004;40:1078–1087. doi: 10.1002/hep.20411. [DOI] [PubMed] [Google Scholar]
- 26.Feldstein AE, Wieckowska A, Lopez AR, Liu YC, Zein NN, McCullough AJ. Cytokeratin-18 fragment levels as noninvasive biomarkers for nonalcoholic steatohepatitis: a multicenter validation study. Hepatology. 2009;50:1072–1078. doi: 10.1002/hep.23050. [DOI] [PMC free article] [PubMed] [Google Scholar]
- 27.Younossi ZM, Jarrar M, Nugent C, Randhawa M, Afendy M, Stepanova M, et al. A novel diagnostic biomarker panel for obesity-related nonalcoholic steatohepatitis. Obes Surg. 2008;18:1430–1437. doi: 10.1007/s11695-008-9506-y. [DOI] [PubMed] [Google Scholar]
- 28.Jost PJ, Kaufmann T. Cancer caused by too much apoptosis—an intriguing contradiction? Hepatology. 2010;51:1110–1112. doi: 10.1002/hep.23514. [DOI] [PubMed] [Google Scholar]
- 29.Weber A, Boger R, Vick B, Urbanik T, Haybaeck J, Zoller S, et al. Hepatocyte-specific deletion of the antiapoptotic protein myeloid cell leukemia-1 triggers proliferation and hepatocarcinogenesis in mice. Hepatology. 2010;51:1226–1236. doi: 10.1002/hep.23479. [DOI] [PMC free article] [PubMed] [Google Scholar]
- 30.Lamkanfi M, Festjens N, Declercq W, Vanden Berghe T, Vandenabeele P. Caspases in cell survival, proliferation and differentiation. Cell Death Differ. 2007;14:44–55. doi: 10.1038/sj.cdd.4402047. [DOI] [PubMed] [Google Scholar]
- 31.Strasser A, Jost PJ, Nagata S. The many roles of FAS receptor signaling in the immune system. Immunity. 2009;30:180–192. doi: 10.1016/j.immuni.2009.01.001. [DOI] [PMC free article] [PubMed] [Google Scholar]
- 32.Altieri DC. Survivin, cancer networks and pathway-directed drug discovery. Nat Rev Cancer. 2008;8:61–70. doi: 10.1038/nrc2293. [DOI] [PubMed] [Google Scholar]
- 33.Ratziu V, Zelber-Sagi S. Pharmacologic therapy of non-alcoholic steatohepatitis. Clin Liver Dis. 2009;13:667–688. doi: 10.1016/j.cld.2009.07.001. [DOI] [PubMed] [Google Scholar]
- 34.Wueest S, Rapold RA, Schumann DM, Rytka JM, Schildknecht A, Nov O, et al. Deletion of Fas in adipocytes relieves adipose tissue inflammation and hepatic manifestations of obesity in mice. J Clin Invest. 2010;120:191–202. doi: 10.1172/JCI38388. [DOI] [PMC free article] [PubMed] [Google Scholar]
Associated Data
This section collects any data citations, data availability statements, or supplementary materials included in this article.