Background: Five different conditions have been employed interchangeably to down-regulate TorC1.
Results: Four of the five conditions exhibit different, hierarchially related phosphatase requirements. Gln3 responses to long-term nitrogen starvation and Msx treatment exhibit the same phosphatase requirements.
Conclusion: Previous conditions for down-regulating TorC1 are not physiologically equivalent.
Significance: The cellular responses to varying nitrogen supplies occur via multiple, distinguishable regulatory pathways.
Keywords: Amino Acid, Cell Signaling, GATA, Gating, Glutamine Synthase, Nitrogen Metabolism, Gln3, TorC1, Methionine Sulfoximine, Rapamycin
Abstract
Five different physiological conditions have been used interchangeably to establish the sequence of molecular events needed to achieve nitrogen-responsive down-regulation of TorC1 and its subsequent regulation of downstream reporters: nitrogen starvation, methionine sulfoximine (Msx) addition, nitrogen limitation, rapamycin addition, and leucine starvation. Therefore, we tested a specific underlying assumption upon which the interpretation of data generated by these five experimental perturbations is premised. It is that they generate physiologically equivalent outcomes with respect to TorC1, i.e. its down-regulation as reflected by TorC1 reporter responses. We tested this assumption by performing head-to-head comparisons of the requirements for each condition to achieve a common outcome for a downstream proxy of TorC1 inactivation, nuclear Gln3 localization. We demonstrate that the five conditions for down-regulating TorC1 do not elicit physiologically equivalent outcomes. Four of the methods exhibit hierarchical Sit4 and PP2A phosphatase requirements to elicit nuclear Gln3-Myc13 localization. Rapamycin treatment required Sit4 and PP2A. Nitrogen limitation and short-term nitrogen starvation required only Sit4. G1 arrest-correlated, long-term nitrogen starvation and Msx treatment required neither PP2A nor Sit4. Starving cells of leucine or treating them with leucyl-tRNA synthetase inhibitors did not elicit nuclear Gln3-Myc13 localization. These data indicate that the five commonly used nitrogen-related conditions of down-regulating TorC1 are not physiologically equivalent and minimally involve partially differing regulatory mechanisms. Further, identical requirements for Msx treatment and long-term nitrogen starvation raise the possibility that their effects are achieved through a common regulatory pathway with glutamine, a glutamate or glutamine metabolite level as the sensed metabolic signal.
Introduction
The target of rapamycin proteins (Tor1 and Tor2) are serine/threonine protein kinases that function as components of two global regulatory complexes, TorC1 and TorC2 (1–6). These highly conserved regulators respond to a wide variety of environmental conditions and control a similarly wide variety of cellular processes ranging from nitrogen catabolic and ribosomal protein gene transcription to autophagy, protein synthesis, and cell division. TorC1 is a dispensable complex that participates in nitrogen-responsive regulation of protein synthesis, nitrogenous compound catabolism, and reutilization, whereas the essential TorC2 complex participates in processes associated with the actin cytoskeleton, cell division, and other essential cellular processes (1, 2, 7).
Five different nitrogen-related physiological conditions have been employed more or less interchangeably in studies that down-regulate TorC1 activity and its downstream proxies: 1) nitrogen starvation (8–13); 2) nitrogen limitation (usually growing cells in or transferring them into medium with a poor nitrogen source, such as proline) (3–6, 14–19); 3) treating cells with the glutamine synthetase inhibitor methionine sulfoximine (Msx)2 (20–24); 4) treating cells with the TorC1 inhibitors rapamycin or caffeine (19, 2–28); and, most recently, leucine starvation achieved by omitting an auxotrophic requirement or treating cells with the leucyl tRNA synthesis inhibitors 1,3-dihydro-1-hydroxy-2,1-benzoxaborole (DHBB) or L-norvaline (29). Given the interchangeable use of these conditions and conclusions derived from them to develop the current paradigm describing nitrogen-responsive TorC1 regulation of downstream processes, we questioned how the above five methods came to be equivalently employed in TorC1 analyses. More importantly, we determined, in head-to-head comparisons using Gln3-Myc13 localization as the reporter of nitrogen-responsive TorC1 inactivation, whether the five conditions, in fact, generate equivalent physiological responses.
Starving Saccharomyces cerevisiae cells of nitrogen, carbon, sulfur, phosphate, or biotin arrests growth in the unbudded G1 phase of the cell cycle (8, 12). Early studies of Tor1 and Tor2 demonstrated that most cells treated for 5 h with the Tor-specific inhibitor rapamycin also arrested growth in G1 with a DNA content of 1N (10, 13), establishing the initial indirect connection between nutrients and Tor activity. A second nutrient connection derived from three observations: 1) nutrient-limited cells failed to proceed through “Start” in late G1 and, instead, entered stationary phase (30, 31); 2) rapamycin-treated or stationary phase cells (A600 > 15) contained much less of the Tor-associated protein (Tap42)-PP2A and Tap42-Sit4 complexes than did exponentially growing cells (25); and 3) TorC1-dependent Tap42 phosphorylation was required for Tap42-PP2A and Tap42-Sit4 complex formation, and rapamycin treatment caused dephosphorylation of Tap42 (32). The connection between nitrogen limitation or nitrogen catabolite repression (NCR) and Tor activity derived from the observations that rapamycin treatment, low concentrations of ammonia, or provision of proline as the sole nitrogen source all triggered the degradation of tryptophan permease (Tat2), whereas this degradation was prevented by the addition of excess nitrogen (19, 33). Subsequent genome-wide transcriptional analyses demonstrated that rapamycin treatment elicited a profile of increased NCR-sensitive catabolic gene expression similar to that found during growth with poor nitrogen sources or following the onset of short-term nitrogen starvation (15–17). These observations firmly connected Tor regulation with the well studied control of NCR-sensitive gene expression.
Nitrogen limitation gained further acceptance as a way to down-regulate TorC1 with the findings that nitrogen limitation and rapamycin treatment resulted in nuclear localization of Gln3, the GATA family transcription activator responsible for NCR-sensitive gene expression and, thereafter, one of the most often used readouts of TorC1 activity (1, 6, 14, 15). Msx entered the repertoire of methods to down-regulate TorC1 activity when it was discovered that Msx addition, like rapamycin treatment, induced nuclear Gln3 and retrograde Rtg1 localization as well as increased NCR-sensitive and retrograde gene expression (20).
It was from these initial correlations and many subsequent studies associated with them that the mechanistic outlines of nitrogen-responsive TorC1 regulation of Gln3 localization and nitrogen catabolic gene transcription arose and were concluded to be exerted through a common regulatory pathway (Refs. 1–6 provide comprehensive reviews of this literature).
In a broad, abridged outline, the overall conclusion of this combined work was that, in nitrogen, excess active TorC1 phosphorylates Tap42. Phosphorylated Tap42 formed a complex with the PP2A or Sit4 phosphatases, which bound them to the TorC1 complex, thereby maintaining them in an inactive conformation (25, 26, 29, 33). Nitrogen limitation or treating cells with rapamycin released the Tap42-phosphatase complexes from TorC1, thereby permitting the phosphatases they contained to become active (33). Thus, freed from TorC1, active Sit4 and PP2A phosphatases could dephosphorylate Gln3 and its negative regulator Ure2 resulting in their dissociation, nuclear import of dephosphorylated Gln3, and subsequent activation of NCR-sensitive transcription (14, 15, 18). Most recently, leucine-dependent signaling through the Vam6-Gtr1/2-Ego1/3 complexes has been documented to activate TorC1 activity (29).
Although rapamycin treatment and limiting nitrogen elicited the same outcomes with respect to Gln3, it became increasingly clear from the following observations that more was in play. 1) The phosphatase requirements for rapamycin and nitrogen limitation-elicited nuclear Gln3 localization were different. Sit4 was able to grossly dephosphorylate Gln3 irrespective of the nitrogen supply and, contrary to expectation, was most active in nitrogen-replete rather than nitrogen-limited medium (34, 35). 2) PP2A was required for rapamycin-elicited nuclear Gln3 localization in rich medium, but it was not required at all for a similar response elicited by nitrogen limitation, i.e. growth in minimal proline or allantoin media (36, 37). 3) Rapamycin treatment decreased gross Gln3 phosphorylation, whereas Msx treatment increased it, yet both treatments generated the same nuclear Gln3-Myc13 outcome (22, 23). 4) Gln3 dephosphorylation to the same extent as observed following rapamycin addition or in vitro phosphatase treatment was not sufficient to achieve its nuclear localization (36). 5) Rapamycin treatment elicited Ure2 dephosphorylation, whereas nitrogen limitation had little, if any, effect on Ure2 dephosphorylation (38). 6) Specific amino acid substitutions in Gln3 or Ure2 themselves abrogated the ability of Gln3 to respond to rapamycin treatment, whereas its response to nitrogen limitation remained intact (38, 39).
Given the observations and conclusions cited above, it seemed important to determine the extent to which all five conditions employed to down-regulate TorC1 were or were not truly equivalent. For example, was nitrogen-starvation merely extreme nitrogen-limitation? Were the Gln3 responses to these two physiological situations following equivalent mechanisms of regulation, as largely accepted in many studies of TorC1? This was a particularly pertinent question because there are striking physiological differences between cells subjected to nitrogen limitation versus nitrogen starvation. The most profound difference is that nitrogen-limited cells continue to divide indefinitely, albeit more slowly than in rich medium, whereas nitrogen-starved cells complete their cell cycles and arrest in the G1 or G0 phases of the cell cycle (11, 12, 30, 31). Further, nitrogen-limited cells do not mobilize their vacuolar reserves of arginine and allantoin, whereas in nitrogen-starved cells, these reserve nitrogen sources are mobilized, induce transcription of the NCR-sensitive arginine and allantoin catabolic pathway genes, and are degraded to glutamate and ammonia (40). In short, the pertinent question was, were past TorC1 studies investigating five aspects of a single regulatory mechanism or five manifestations of potentially five different regulatory mechanisms leading directly or indirectly to a common outcome?
The head-to-head comparisons described below demonstrate that nitrogen limitation, short- and long-term nitrogen starvation, leucine starvation, and Msx and rapamycin treatments are not physiologically equivalent means of eliciting nuclear Gln3-Myc13 localization. Rather, they represent distinct physiological situations whose common downstream outcomes are controlled by a hierarchy of regulatory reactions. We also show that Msx treatment and long-term nitrogen starvation may participate in a common regulatory pathway.
MATERIALS AND METHODS
Strains and Culture Conditions
The S. cerevisiae strains used in this work were wild-type TB123 (MATa, leu2–3, 112, ura3–52, trp1, his4, rme1, HMLa, GLN3-MYC13(KanMX)) (14), sit4Δ TB136-2a (MATa, leu2–3,112, ura3–52, rme1, trp1, his4, GAL+, HMLa, GLN3-MYC13(KanMX), sit4::kanMX) (14), and PP2A-defective 03705d (MATα, leu2–3,112, ura3–52, rme1, trp1, his4, HMLα, GLN3-MYC13(KanMX), pph21::kanMX, and pph22::kanMX) (36). Growth conditions were identical to those described earlier (24, 36, 41, 42). Cultures were grown at 30 °C to mid-log phase (A600 nm = 0.4–0.5) in yeast nitrogen base (YNB) minimal medium (without ammonium sulfate or amino acids) containing the indicated nitrogen source at a final concentration of 0.1%. Appropriate supplements (120 μg/ml leucine and 20 μg/ml each of uracil, histidine, and tryptophan) were added to the medium as necessary to cover auxotrophic requirements. Where indicated, α-factor (Sigma, dissolved in water) was added to a final concentration of 2 μgm/ml, DHBB (Sigma-Aldrich, dissolved in water) was added to a final concentration of 10 μm, and L-norvaline (Sigma) was added as a dry powder to a final concentration of 10 mm. Rapamycin (+Rap) and Msx were used at final concentrations of 200 ng/ml and 2 mm, respectively.
Where indicated, cultures were transferred to YNB nitrogen-free, leucine-free, or leucine-limited media. This was accomplished using filtration to harvest mid-log-phase cells grown as described and quickly resuspending them in the second medium that was prewarmed and preaerated. Total time for the transfer ranged from 70–110 s.
Indirect Immunofluorescence Microscopy
Cell collection and fixation for indirect immunofluorescence microscopy were performed using successive modifications of the method of Schwartz et al. (43, 44). In this protocol, cells were fixed at 30 °C for 80 min following the addition of 0.55 ml of 1 m potassium phosphate buffer (pH 6.5) and 0.5 ml of 37% formaldehyde to a 5-ml aliquot of the desired culture. Following fixation, the samples were washed and resuspended in 0.1 m potassium phosphate buffer (pH 6.5) containing 1.2 m sorbitol. Zymolyase digestion of cells was performed as described in Tate et al. (34). Cells were then plated onto 0.1% poly-lysine-coated slides (poly-L-lysine hydrobromide, Sigma) and incubated overnight at 4 °C in phosphate buffer (pH 7.5) containing 0.5% bovine serum albumin (Sigma) and 0.5% Tween 20. Antibody incubations and subsequent washes were performed using this phosphate buffer. Primary antibody labeling of Gln3-Myc13 was performed using 9E10 (c-myc) monoclonal antibody (Covance, catalog no. MMS-150P, at a dilution of 1:1000) followed by secondary labeling with Alexa Fluor 594 goat anti-mouse IgG antibody (Invitrogen, dilution of 1:200).
Primary images were collected at room temperature using a Zeiss Axioplan 2 microscope with a ×100/1.40 Plan-Aprochromat oil objective, Zeiss Axio camera, and Zeiss Axiovision 4.8.1 software. Only primary, unaltered .zvi images were used for scoring of the intracellular localization of Gln3-Myc13. For microscopic images presented in the figures, .zvi files were converted to .tif files and processed using the Adobe Photoshop and Illustrator programs. γ Settings for the images were unaltered. Dark and light settings of the Adobe Photoshop Levels Adjustment option were changed minimally to retain the same clarity observed in the microscope. These changes were applied uniformly to each individual image presented and nearly uniformly to all of the images presented collectively.
Scoring Intracellular Localization of Gln3-Myc13
Intracellular scoring of Gln3-Myc13 was performed as described in Georis et al. (24). At least 200 cells were scored for each data point presented, including determination of budded versus unbudded cells. Three-category scoring (cytoplasmic, cytoplasmic fluorescence only; nuclear-cytoplasmic, cytoplasmic fluorescence and fluorescence colocalizing with DAPI-positive material; and nuclear, fluorescence colocalizing with DAPI-positive material only) was employed as described (34, 37). Extensive examples showing Gln3-Myc13 situated in each of the above three categories appear in Fig. 2 of Ref. 36. The precision of the scoring procedures has also been extensively evaluated, and the results are documented in Tate et al. (34, 36, 37, 39). All of the experiments were performed two or more times with similar results.
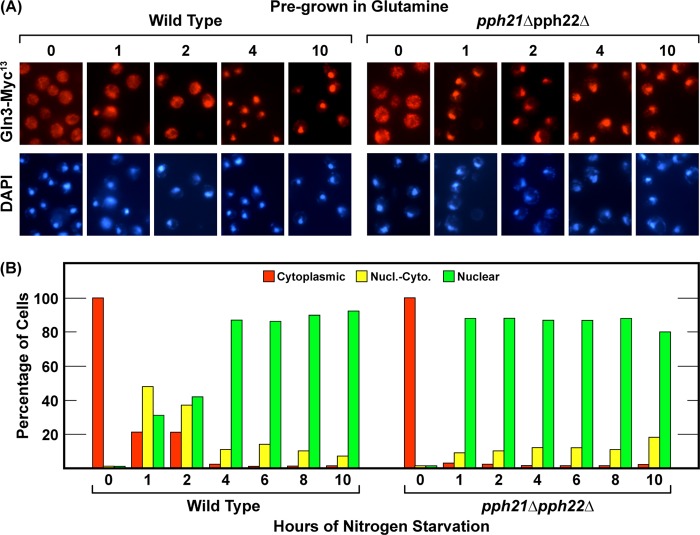
FIGURE 2.
PP2A activity is not required for nuclear Gln3-Myc13 localization in response to nitrogen limitation or nitrogen starvation. The experimental format and data presentation were the same as in Fig. 1. Wild-type (TB123) and pph21Δpph22Δ (03705d) strains were used. Pph21 and Pph22 are the catalytic subunits of phosphatase PP2A. Nucl.-Cyto., nuclear-cytoplasmic.
RESULTS
Sit4 Is Required for Nuclear Gln3-Myc13 Localization In Response to Nitrogen Limitation and Short-term but Not Long-term Nitrogen Starvation
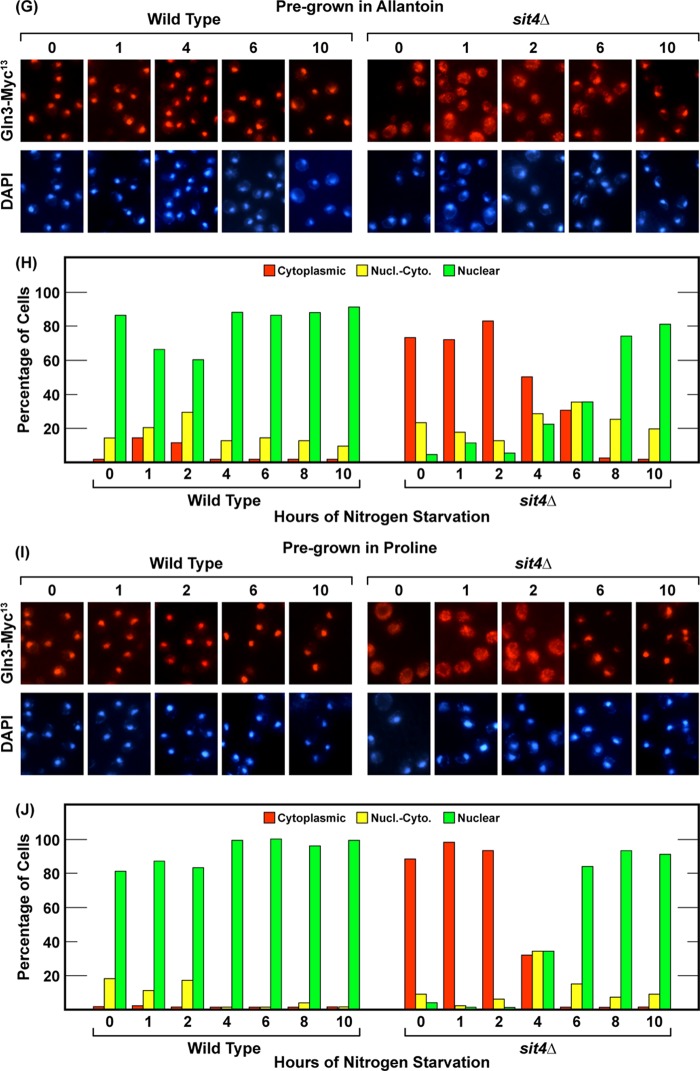
Very little is known about the consequences and requirements for nitrogen starvation. For example, how long must starvation be imposed before its effects are observed, does the time required for starvation to occur vary with the nitrogen source upon which the cells are pregrown, and are the requirements for the effects of nitrogen starvation the same for short- versus long-duration starvation? Therefore, the first objective of our experiments was to determine and compare the Gln3 outcomes and phosphatase requirements of steady-state nitrogen limitation versus short- and long-term nitrogen starvation in the same cultures. To this end, wild-type (TB123) and sit4Δ (TB136-2a) cultures were grown to mid-log phase (A600 nm = 0.5) in YNB media containing nitrogen sources ranging from highly repressive glutamine or ammonia to highly derepressive allantoin or proline. At a cell density of A600 nm = 0.5, a sample of each culture was harvested for analysis. These initial samples demonstrated steady state intracellular Gln3-Myc13 localization in each of the nitrogen sources and determined whether or not Sit4 was required to achieve that localization during steady-state logarithmic growth. Gln3-Myc13 was completely sequestered in the cytoplasm of cells provided with glutamine or ammonia, irrespective of whether the culture was wild-type or sit4Δ (Fig. 1, A–D). With glutamate, an intermediately repressive nitrogen source, Gln3-Myc13 was initially distributed in all three scoring categories, i.e. cytoplasmic, nuclear-cytoplasmic, and nuclear, in wild-type cells (Fig. 1, E and F). However, nuclear-cytoplasmic and nuclear Gln3-Myc13 localization in glutamate-grown cells required Sit4, as indicated by the fact that Gln3-Myc13 was cytoplasmic at zero time in nearly all sit4Δ cells (Fig. 1, E and F). When wild-type cells were cultured in derepressive nitrogen sources, i.e. allantoin or proline, Gln3-Myc13 was highly nuclear (Fig. 1, G–J, wild type). Again, however, there was a nearly absolute requirement for Sit4 to achieve this localization (Fig. 1, G–J, sit4Δ).
FIGURE 1.
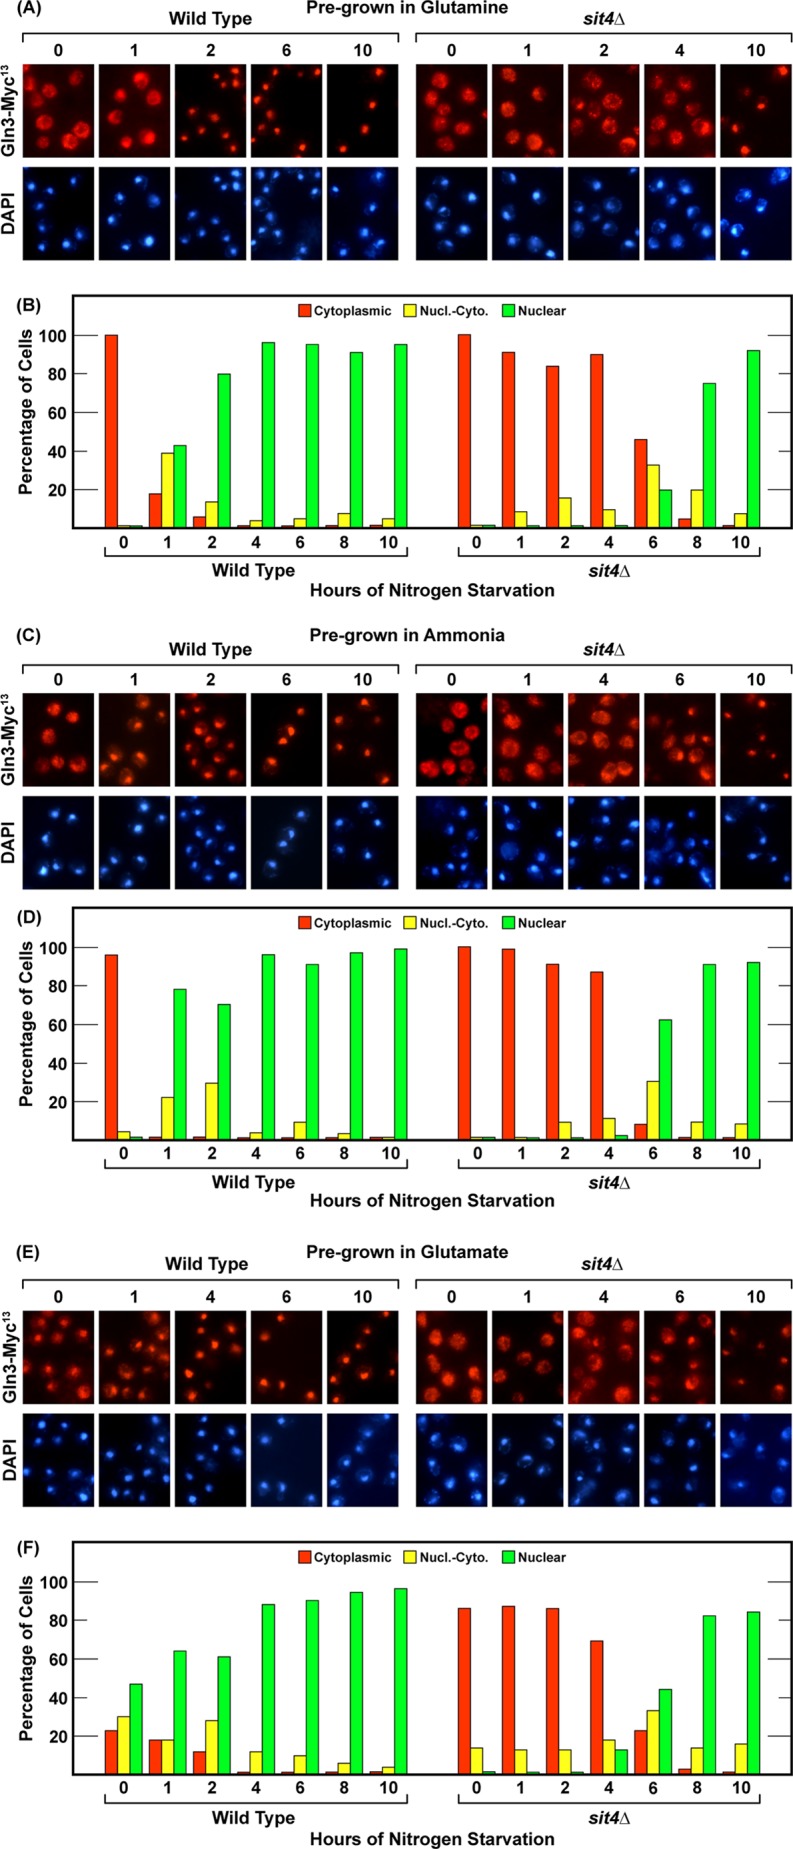
Nuclear Gln3-Myc13 localization in response to nitrogen limitation and nitrogen starvation exhibit different Sit4 phosphatase requirements. Wild-type (TB123) and sit4Δ (TB136-2a) strains were grown to mid-log phase (A600 nm = 0.5) in YNB medium (without amino acids or ammonium sulfate) containing the nitrogen source indicated at the top. After sampling, the cultures were transferred to nitrogen-free medium, and sampling continued for 10 h. Samples were prepared for microscopic examination as described under “Materials and Methods.” A, C, E, G, and I, representative images from which the corresponding histograms in B, D, F, H, and J were generated. Red bars indicate Gln3-Myc13 indirect immunofluorescence in the cytoplasm only, yellow bars indicate both cytoplasmic and nuclear fluorescence (Nucl.-Cyto.), and green bars indicate fluorescence in the nucleus only. The precision of scoring has been repeatedly characterized in detail (34, 36, 37, 39). The average error in 10 experiments performed over 9 months ranged from ± 7–8% (39). Note that representative microscopic images similar to those presented here (e.g. A) and all figures were prepared for every time point assayed. However, the particular images presented in the figure of wild-type cells do not always correspond to those in the mutant cells or conditions (note the time differences). Space limitations restricted the total number of images we could present. Therefore, we chose the images that were most evaluative for the arguments presented. Histograms depict all of the data collected. For example, in A, it is most important that Gln3-Myc13 was almost completely nuclear in wild-type cells after 2 h of starvation, whereas in the sit4Δ cultures it remained completely cytoplasmic at 4 h.
After removing these initial samples from each culture, it was transferred to prewarmed, preaerated, nitrogen-free YNB medium, and sampling continued. Within 1 h, Gln3-Myc13 began relocating to the nuclei of glutamine- or ammonia-grown wild-type cells and became completely nuclear within 2–4 h (Fig. 1, A–D, wild type). With wild-type glutamate- and allantoin-grown cells in which Gln3-Myc13 was already partially nuclear at the outset of nitrogen starvation, its localization became increasingly nuclear, becoming completely nuclear within 4 h (Fig. 1, E and F, wild type, and G and H, wild type). In wild-type, proline-grown cells, Gln3-Myc13 was already nuclear, and, therefore, nitrogen starvation had little further demonstrable effect (Fig. 1, I and J). Irrespective of the starting nitrogen source, as wild-type cells increasingly starved for nitrogen, Gln3-Myc13 relocated to the nucleus, and the times required for complete nuclear localization were relatively similar.
The Gln3-Myc13 responses when sit4Δ cultures were transferred to nitrogen-free medium were strikingly different. In glutamine-, ammonia-, and glutamate-grown sit4Δ cells, Gln3-Myc13 remained staunchly cytoplasmic for about 4 h (Fig. 1, A–F, sit4Δ). By about 6 h, it began to relocate to the nucleus. For allantoin- and proline-grown cells, Gln3-Myc13 was sequestered in the cytoplasm of sit4Δ cells for 2 h. However, significant Gln3-Myc13 relocation was observed by 4 h, i.e. it occurred somewhat more quickly than in cells pregrown in glutamine, ammonia, or glutamate (Fig. 1, G–J, sit4Δ). Irrespective of the nitrogen source, however, Gln3-Myc13 was almost completely nuclear by 8–10 h of nitrogen starvation in all of the sit4Δ cultures.
The strong Sit4 requirements we observed early in starvation and their subsequent loss as starvation increased prompted us to query whether PP2A phosphatase was also required to achieve these outcomes. Therefore, we repeated the nitrogen starvation experiment in a pph21Δpph22Δ double mutant lacking both catalytic subunits of PP2A. This mutant was grown in YNB-glutamine prior to being transferred to nitrogen-free medium. Because there is no PP2A requirement for nuclear Gln3-Myc13 localization in cells provided with derepressive nitrogen sources (36), we assayed only glutamine-pregrown cells as the most extreme case with the greatest likelihood of a PP2A requirement. Neither short- nor long-term nitrogen starvation-elicited nuclear Gln3-Myc13 localization required PP2A (Fig. 2, A and B). Further, eliminating PP2A from cells during nitrogen starvation significantly hastened Gln3-Myc13 localization to the nucleus relative to the wild type (compare Fig. 1, A and B, with Fig. 2, A and B). Whether or not the faster relocation derived from smaller nitrogen reserves in the PP2A-defective strain or some other, more regulatorily relevant reason is not known. It was clear that the Sit4 requirement at the onset of nitrogen starvation was identical to that observed in steady-state, nitrogen-limited, proline-grown cells and that this requirement was completely lost as the duration of starvation was extended.
Sit4-independent Nuclear Gln3-Myc13 Localization Positively Correlates with G1 Cell Cycle Arrest
Loss of the absolute Sit4 requirements for nuclear Gln3-Myc13 localization during extended nitrogen starvation raised a question. Why had the Sit4 requirement disappeared, and what had changed? The time required for this loss to occur prompted us to determine whether the time course of nitrogen starvation-elicited Gln3-Myc13 nuclear entry correlated with changes in cell morphology. This was pertinent because, at some point following the onset of nitrogen starvation, limited internal nitrogen reserves run out and cells then G1-arrest to better survive the adverse environment (30, 31). Further, sequestered vacuolar arginine relocates to the cytoplasm when cells undergo significant nitrogen starvation (40, 46). Additionally, vacuolar arginine continuously declines for 5 h after transferring cells to nitrogen-free medium, reaching undetectable levels in both vacuolar and cytoplasmic extracts at that time (46). Interestingly, this was at about the same time that Gln3-Myc13 began entering the nucleus of nitrogen-starved sit4Δ cells. Therefore, G1 arrest of the cell cycle was a prime candidate for investigation.
For the first 4 h after transfer from YNB-proline to nitrogen-free medium, both wild-type and sit4Δ cells continued to multiply logarithmically (Fig. 3A). Thereafter, however, growth began to slow. Positively correlating with the exit from logarithmic growth, the ratio of unbudded/budded cells in the culture began to rise (Fig. 3B). Values above individual histograms indicate the percentages of unbudded cells. By 8–10 h, both cultures were highly arrested. As expected, the two cultures did not G1-arrest simultaneously because the sit4Δ cells were dividing more slowly than wild-type cells (doubling times of 4.0 and 2.2 h, respectively).
FIGURE 3.
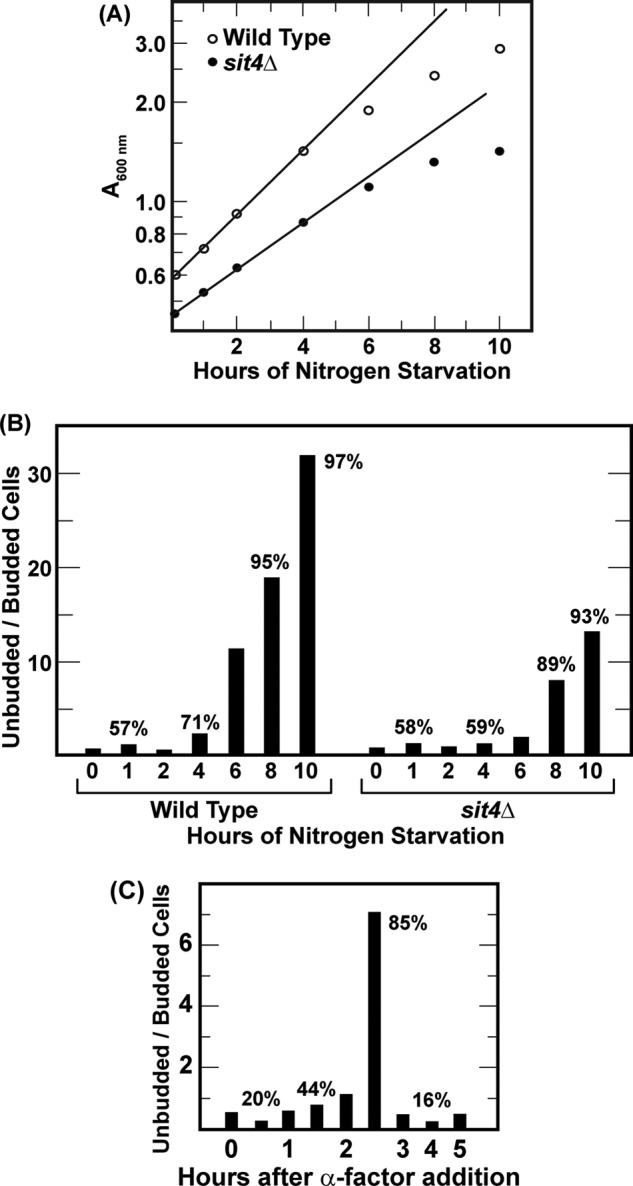
Growth and G1 arrest of wild-type and sit4Δ cells during nitrogen starvation or α-factor treatment. Wild-type (TB123) and sit4Δ (TB136–2a) were pregrown in either YNB-proline (A and B) or YNB-glutamine (C) medium. The cultures were then transferred to nitrogen-free medium (A and B) or treated with α-factor at a final concentration of 2 μgm/ml (C). Cell growth was determined by light scattering at A600 nm (A). The number of budded and unbudded cells was determined by direct microscopic inspection of more than 200 cells/point (B and C). Values above the histograms are the percentages of unbudded cells for that point.
Nuclear Gln3-Myc13 Localization Does Not Correlate with α-Factor-induced G1 Arrest
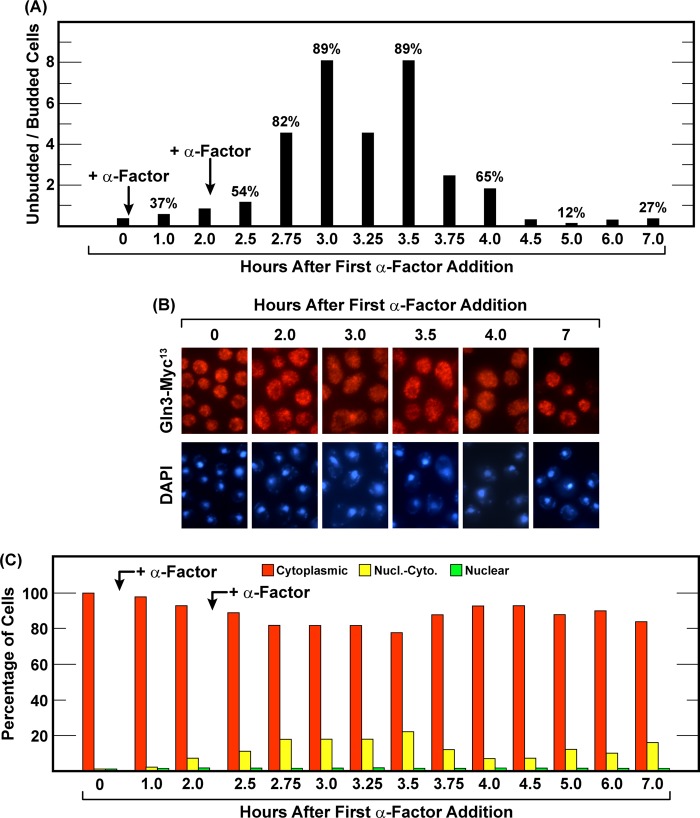
There are multiple ways to arrest cells in the G1 phase of the cell cycle, including starvation for various nutrients (11–13) and treating MATa cells with α-factor (47, 48). The second method permitted us to ask whether nitrogen starvation-elicited nuclear Gln3-Myc13 localization merely correlated with G1 arrest of the cell cycle or had G1 arrest itself elicited nuclear Gln3-Myc13 localization? To address this question, we planned to simultaneously measure Gln3-Myc13 localization and budded versus unbudded cell morphology following addition of α-factor to glutamine-grown MATa cells (TB123). To establish an effective α-factor concentration to use, we initially added synthetic α-factor to a final concentration of 2 μgm/ml. Two-and-a-half hours later, most cells (85%) had G1-arrested (Fig. 3C). Unfortunately, 30 min later (3 h), the cells synchronously budded and began traversing the cell cycle. The short duration of G1 arrest raised the likely possibility that we might miss an α-factor-dependent effect on Gln3-Myc13 localization, not because of its absence but because of our wrong choice of times to sample the culture. Therefore, we adopted a second protocol (49, 50) in which α-factor was initially added as before and then again after 2 h of incubation. The rationale was that the cells we used, being Bar plus, would rapidly degrade added α-factor (51, 52). Therefore, a second addition of α-factor would extend the time it was present in the medium. As anticipated, this second protocol extended G1 arrest from 30 min to nearly 2 h before synchronous budding began, thereby providing sufficient time to determine the intracellular localization of Gln3-Myc13 more confidently (Fig. 4A). Beyond a slight response that peaked between 2.75 and 3.5 h after the initial α-factor addition, nuclear entry of Gln3-Myc13 remained largely immune to α-factor treatment (Fig. 4, B and C). Note that Gln3-Myc13 was completely nuclear in few, if any, cells. This argued that nuclear entry of Gln3-Myc13 in response to nitrogen starvation derived from starvation itself rather than indirectly from nitrogen starvation-induced G1 arrest of the cell cycle. Together, the data suggested that the Sit4 requirement for nuclear Gln3-Myc13 localization in response to short-term nitrogen limitation differed markedly from that observed when cells actually exhaust their internal reserves to the point of being forced into G1 arrest.
FIGURE 4.
Gln3-Myc13 localization and G1 arrest of wild-type cells following the addition of α-factor are not affected in parallel. Wild-type cells were pregrown in YNB-glutamine medium and sampled at the indicated times. The bud index (A) or Gln3-Myc13 localization (B and C) were then determined. The time at which cells G1-arrested (greatest percentage of unbudded cells) was determined as in Fig. 3, B and C. α-factor (2 μgm/ml) was added to the culture immediately after the zero and 2.0 h time point samples were taken (arrows). All values were determined by scoring 200 or more cells. Nucl.-Cyto., nuclear-cytoplasmic.
Amino Acid Starvation Does Not Alter Gln3-Myc13 Localization
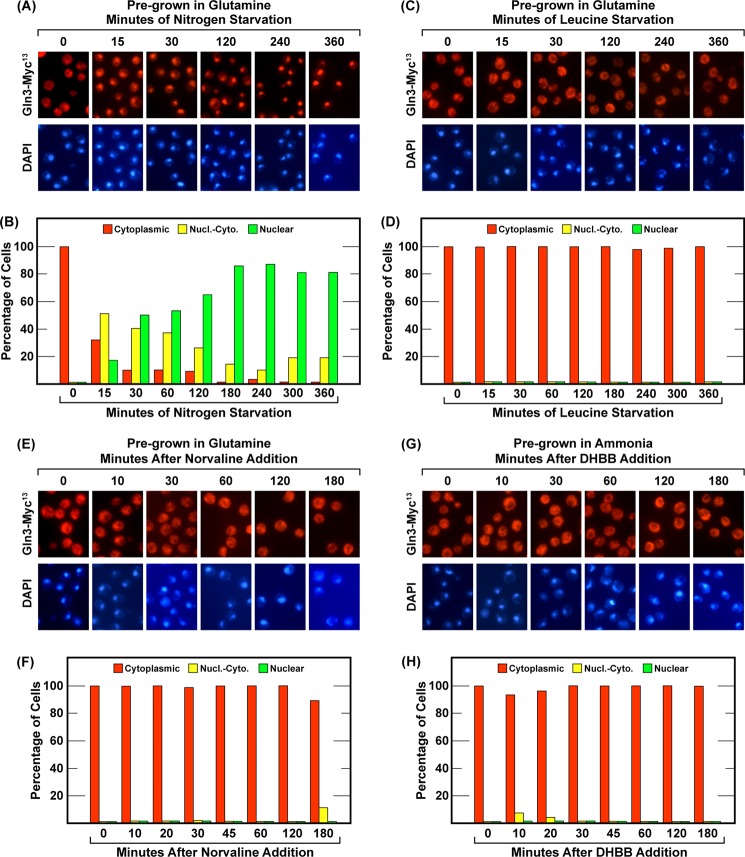
Recently, DeVirgilio convincingly demonstrated that starving a leucine auxotroph for leucine, treating cultures with the leucine analog L-norvaline, which competitively inhibits leucyl-tRNA synthetase (53, 54), or DHBB, which traps uncharged tRNALeu in the editing active site of leucyl-tRNA synthetase (55), elicits Sch9 dephosphorylation similar to that observed after treating cells with rapamycin (29, 56). These observations led to the conclusion that leucine starvation is responsible for nitrogen-responsive down-regulation of TorC1 (29). Therefore, we employed the same experimental format and conditions to ask whether leucine starvation or loss of normal leucyl-tRNA production similarly affected Gln3-Myc13 movement from the cytoplasm to the nucleus, as expected, because TorC1 activity had long been accepted to control Gln3 localization in parallel with other manifestations of TorC1 down-regulation (1, 29). First, we transferred YNB-glutamine-grown, wild-type cells provided with a normal supplement of leucine (120 μgm/ml) to the same medium devoid of leucine or to nitrogen-free medium containing 120 μgm/ml leucine (Fig. 5, A–D). Gln3-Myc13 moved from the cytoplasm to the nuclei of the nitrogen-starved cells (Fig. 5, A and B) but not in those starved for leucine (C and D). Leucine starvation had no effect on Gln3-Myc13 localization. It is important to note that the effects of leucine starvation on Sch9 dephosphorylation reported by Binda et al. (56) occurred between 30 and 90 min, and our starvation experiment extended to 6 h. Next, we treated glutamine-grown, wild-type cultures with L-norvaline (Fig. 5, E and F) or ammonia-grown cells with DHBB (G and H). Neither inhibitor had any effect on Gln3-Myc13 localization. The same results were obtained irrespective of whether YNB-glutamine- or YNB-ammonia-grown cells were used (one culture of each nitrogen source is shown; alternative nitrogen source data are not shown but are the same as those shown). Again, the results were opposite to those reported for Sch9 dephosphorylation (56). Together, these results indicated that Sch9 dephosphorylation, a proxy for down-regulation of TorC1, was not regulated in the same way as Gln3 entry into the nucleus, which is also commonly used as a proxy for down-regulation of TorC1.
FIGURE 5.
Neither leucine starvation nor treating cells with L-norvaline or DHBB elicit nuclear Gln3-Myc13 localization. Wild-type strain TB123 was used throughout. The overall experimental format was the same as in Fig. 1. A–D, cells were transferred to nitrogen-free or leucine-free medium, respectively. E–H, L-norvaline (10 mm) or DHBB (10 μm) were added, respectively, immediately after the zero time point was taken. The nitrogen sources in which the cells were grown are indicated at the top of each panel. Nucl.-Cyto., nuclear-cytoplasmic.
Slowing Growth Changes the Kinetics of Gln3-Myc13 Localization Following the Onset of Nitrogen Starvation
The fact that leucine starvation had no demonstrable effect on Gln3-Myc13 localization permitted us to test the conclusion that exhaustion of the internal nitrogen supply of the cell was responsible for abrogation of the Sit4 requirement as nitrogen starvation increased. We reasoned that if the nuclear entry of Gln3-Myc13 after transferring cells to nitrogen-free medium did indeed derive from exhausting their internal nitrogen reserves, it should be possible to delay this movement by slowing the rate at which these reserves were expended. Stated with greater specificity, in the face of limiting amounts of a required amino acid (leucine), protein synthesis and, hence, nitrogen utilization per se would slow, resulting in more time being required for the overall internal reserves of the cell to be expended. As a result, movement of Gln3-Myc13 from the cytoplasm to the nucleus of sit4Δ cells should, in turn, be delayed.
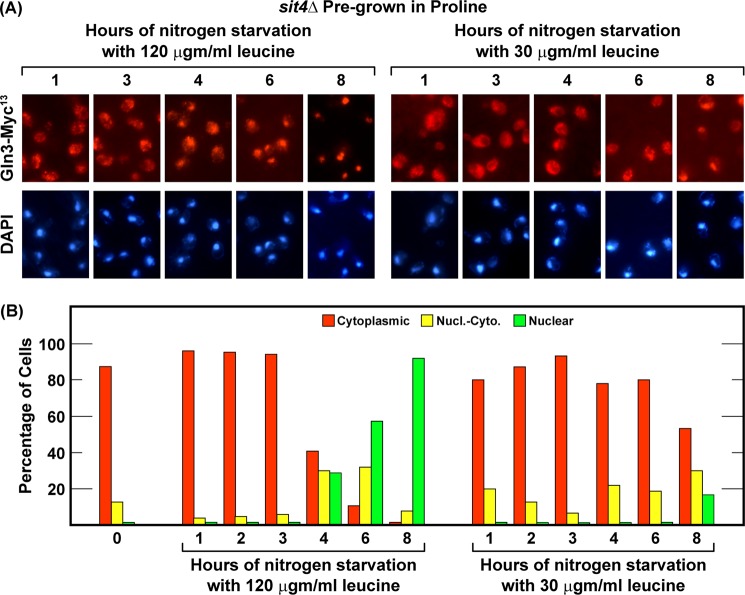
To this end, we grew a sit4Δ to mid-log phase in YNB-proline medium supplemented with the normal 120 μgm/ml of leucine. The culture was then split in two, and the two halves were transferred to nitrogen-free medium containing either 120 or 30 μgm/ml leucine. In the presence of excess leucine (120 μgm/ml), a normal nitrogen starvation response occurred, with Gln3-Myc13 remaining cytoplasmic in about 40% of the cells at 4 h and decreasing to less than 10% by 6 h (Fig. 6, A and B, left panels). However, when leucine was made limiting (30 μgm/ml), nuclear Gln3-Myc13 entry significantly slowed (Fig. 6, A and B, right sides). Gln3-Myc13 still remained cytoplasmic in about 50% of the cells 8 h post-transfer (Fig. 5, A and B, right side).
FIGURE 6.
Limiting protein synthesis delays the onset of nuclear Gln3-Myc13 localization in response to nitrogen starvation. The experimental format was the same as in Fig. 1, except that sit4Δ cells were transferred to nitrogen-free YNB medium supplemented with either 120 μg/ml or 30 μg/ml leucine. Prior to transfer, the culture medium contained the normal leucine supplement of 120 μgm/ml. Nucl.-Cyto., nuclear-cytoplasmic.
These results argued that manipulating the rate of protein synthesis and, thereby, overall utilization of internal nitrogen reserves could predictably alter the time required for Gln3-Myc13 to exhibit a nitrogen starvation-mediated response. Further, they offered additional support for the idea that Gln3-Myc13 localization was not responding to intracellular leucine concentrations; i.e. leucine limitation was not accelerating nuclear Gln3-Myc13 localization as would be expected if Gln3 and Sch9 dephosphorylation were responding in the same way to leucine availability.
Gln3-Myc13 Exits from the Nuclei of Nitrogen-limited Cells When Protein Synthesis Is Inhibited
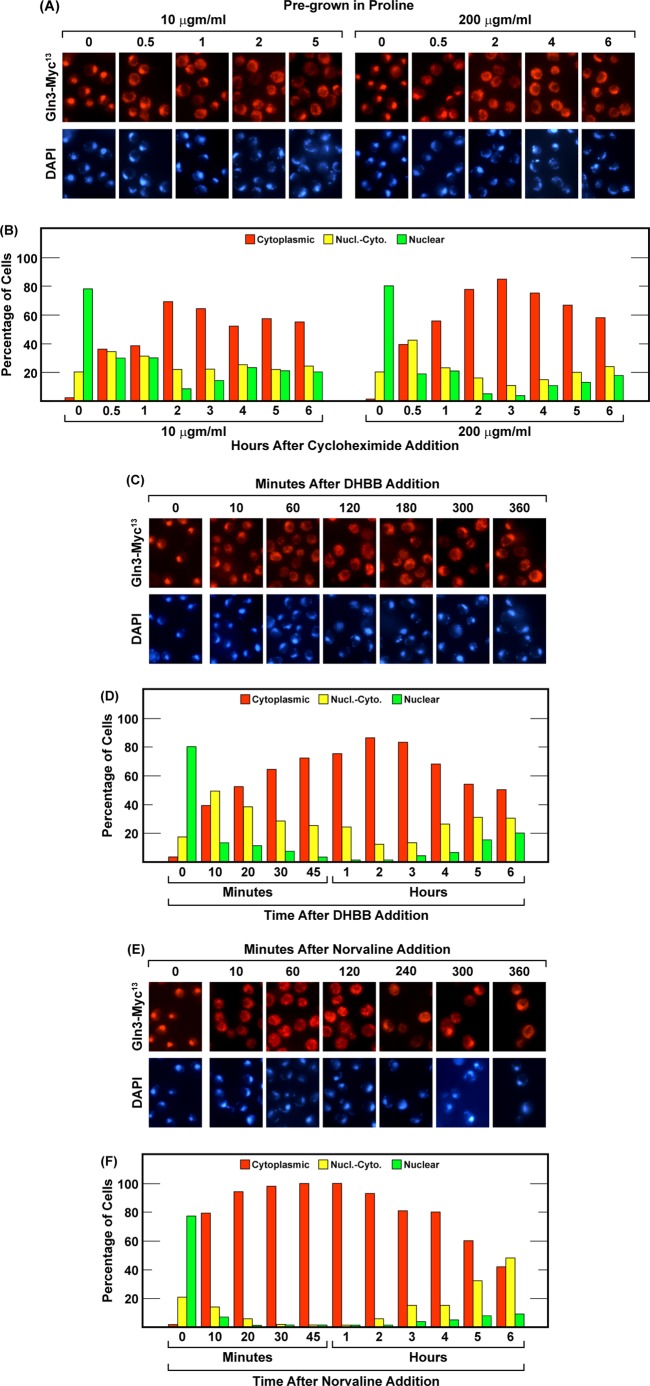
In both mammalian and yeast cells, TorC1 activity has been shown to correlate with and respond to amino acid levels (29, 56). In parallel, it has long been known that NCR-sensitive gene expression is repressed and that Gln3 is cytoplasmic when cells are grown in amino acid-rich YPD medium (1–5). Yet, in the above experiments, Gln3-Myc13 movement was found to be immune to leucine starvation that elicited Sch9 dephosphorylation (29). These observations prompted us to pose a more general question. Could increased concentrations of intracellular amino acids per se influence Gln3 localization? Unfortunately, analyses of Gln3-Myc13 localization following exogenous addition of amino acids seemed too complex an approach because adding amino acids or peptone entails the participation of multiple permeases known to be regulated differently as well as amino acid-specific effects on the cell division cycle, metabolism, and NCR-sensitive gene expression. Therefore, we cultured wild-type cells to mid-log phase in YNB proline medium, where Gln3-Myc13 is almost completely nuclear, and then aberrantly increased the overall intracellular content of amino acids by treating the cultures with cycloheximide, an approach successfully used in both mammalian and, recently, S. cerevisiae cells (29, 56–58). Low cycloheximide concentrations (10 μgm/ml) inhibit protein synthesis initiation but allow elongation with concomitant continued but temporary utilization of available amino acids. Higher concentrations of cycloheximide (200 μgm/ml) inhibit both initiation and elongation and, thereby, rapidly cut off all amino acid incorporation into protein (59).
At 10 μgm/ml cycloheximide, Gln3-Myc13 began exiting from the nucleus but then remained equally distributed in all three scoring categories for at least 1 h (Fig. 7, A and B). By 2 h, Gln3-Myc13 became cytoplasmic in ∼70% of the cells and remained at this distribution for the next 4 h. At 200 μgm/ml cycloheximide, Gln3-Myc13 moved during the initial 30 min in a manner similar to that observed at the lower cycloheximide concentration. However, thereafter, cytoplasmic Gln3-Myc13 localization increased linearly to a peak level of over 80% and then decreased linearly over the next 3 h.
FIGURE 7.
The effect of protein synthesis inhibitors on Gln3-Myc13 localization in wild-type cells cultured under nitrogen-limiting conditions. Wild-type strain TB123 was cultured in nitrogen-limited, YNB-proline medium. At zero time, the cultures were sampled, followed immediately by addition of protein synthesis inhibitor as follows: 10 and 200 μgm/ml cycloheximide (A and B, left and right panels, respectively), 10 μm DHBB (C and D), or 10 mm L-norvaline (E and F). Gln3-Myc13 localization was then determined at the indicated times as described under “Materials and Methods.” These are the same concentrations that were used by Binda et al. (56). Nucl.-Cyto., nuclear-cytoplasmic.
To eliminate the possibility of cycloheximide-specific effects, we repeated the experiment inhibiting protein synthesis with DHBB or L-norvaline, the leucine tRNA synthetase inhibitors employed previously by Bonofils et al. (29) (Fig. 7, C–F). Gln3-Myc13 redistribution in response to DHBB treatment was remarkably similar to the time course observed with 200 μgm/ml cycloheximide. Gln3-Myc13 first exited from the nucleus to the cytoplasm in a linear manner, reaching a peak value in about 2 h (Fig. 7, C and D). It then began to slowly and linearly reenter the nucleus (Fig. 7, C and D). L-norvaline treatment achieved a much faster Gln3-Myc13 movement from the nucleus to the cytoplasm, achieving more than 90% cytoplasmic localization in about 20 min. It remained at this distribution for 2 h but then began to linearly depart from the cytoplasm, as occurred with cycloheximide and DHBB (Fig. 7, E and F). These data demonstrated that Gln3-Myc13 localization responded to increased overall concentrations of intracellular amino acids in proline-grown cells. Therefore, although Gln3-Myc13 localization did not respond to leucine-specific starvation as expected from previous Sch9 phosphorylation data (29), it did respond in parallel with Sch9 phosphorylation when the overall intracellular amino acid content increased.
At present we cannot offer an explanation for the striking linear Gln3-Myc13 exit from the nucleus with two of the inhibitors and, similarly, linear reentry into the nucleus that occurred with all three inhibitors. However, such linear responses are unlikely to be serendipitous. They more likely reflect time-dependent accumulation or exhaustion of a cellular metabolite.
Gln3-Myc13 Response to Rapamycin in Untreated and Protein Synthesis-inhibited Wild-type Cells
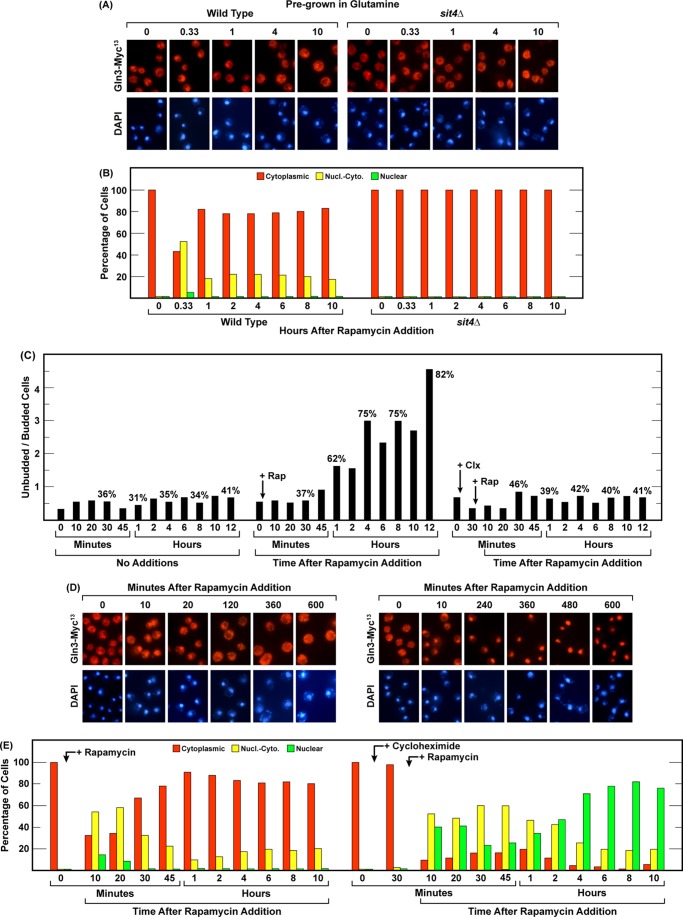
We next moved to the fourth method of down-regulating TorC1 activity, i.e. rapamycin treatment. In contrast with nitrogen starvation or nitrogen limitation, the Gln3-Myc13 response to treating wild-type cells with rapamycin was rapid, limited, and quite transient (Fig. 8, A, B, D, and E, left panels). Gln3-Myc13 began relocating from the cytoplasm to the nuclei of glutamine-grown cells within 10 min of rapamycin addition and reached peak values between 20 and 30 min. The degree of movement, however, was much more moderate than observed with nitrogen starvation or limitation. Nuclear relocation then tapered off, with the response being concluded within 45–60 min. At that time nuclear-cytoplasmic Gln3-Myc13 localization was observed in only about 10–20% of the cells and, interestingly, remained at this level for the duration of the 10-h experiment (Fig. 8, A, B, D, and E, left panels). The response was absolutely Sit4-dependent (Fig. 8, A and B, right panels). An absolute requirement of PP2A for rapamycin-elicited nuclear Gln3-Myc13 localization in glutamine-grown cells has been thoroughly documented and, therefore, was not repeated here (36, 37).
FIGURE 8.
Gln3-Myc13 localization and G1 arrest following addition of rapamycin or cycloheximide plus rapamycin to glutamine-grown cells. A and B, wild-type (TB123, left panel) and sit4Δ (TB136-2a, right panel) strains were grown in YNB-glutamine medium to an A600 nm = 0.5. The cultures were then sampled, and rapamycin (200 ng/ml) was added to both cultures. Gln3-Myc13 localization was determined at the indicated times. C–E, a wild-type glutamine-grown culture was split into three portions. Nothing was added to the first portion. It was sampled, and the ratios of unbudded/budded cells was determined at the indicated times (C, no additions). 200 ng/ml rapamycin (Rap) was added to the second portion after zero time point samples were taken for determination of both the ratio of unbudded/budded cells (C, center histogram) and Gln3-Myc13 localization (D and E, left panels). Sampling was continued for an additional 10–12 h. 200 μgm/ml cycloheximide (Clx) was added to the third portion after a zero time point sample was taken for determination of both the ratio of unbudded/budded cells (C, right histogram) and Gln3-Myc13 localization (D and E, right panels). Immediately following removal of the 30-min sample, 200 ng/ml rapamycin was added, and sampling continued as indicated. Gln3-Myc13 localization and the ratios of unbudded/budded cells were determined by microscopic visualization of 200 or more cells/point. Nucl.-Cyto., nuclear-cytoplasmic.
As recognized in the earliest studies of Tor, rapamycin addition elicited G1 arrest of cell division (Fig. 8C, compare the left and center histograms). However, this G1 arrest, which was quite substantial between 4 and 10 h, did not correlate with detectable movement of Gln3-Myc13 into the nucleus (Fig. 8, A–D), as occurred during nitrogen starvation (Fig. 1, A and B). This result further supported our conclusion that it was not G1 arrest per se but the nitrogen starvation eliciting it that was responsible for Gln3-Myc13 moving into the nucleus.
We next evaluated whether or not rapamycin elicited nuclear Gln3-Myc13 localization responded to a generalized increase in amino acids that occurs when protein synthesis is inhibited. This question was premised on the facts that because rapamycin was a specific inhibitor of TorC1 situated downstream of the Vam6 reaction through which leucine availability has been reported to regulate TorC1 activity (29, 56), its effects on Gln3 localization should be refractory to cycloheximide treatment. Therefore, we treated wild-type cells with 200 μgm/ml cycloheximide for 30 min, added 200 ng/ml rapamycin, and followed Gln3-Myc13 localization. At first, the data followed our expectation, i.e. rapamycin retained its ability to elicit nuclear Gln3-Myc13 localization in the cycloheximide-treated cells (Fig. 8, D and E). In fact, nuclear accumulation of Gln3-Myc13, over the 45-min duration of the normal rapamycin response, was greater than in the absence of cycloheximide. This is best observed by following the fraction of cells in which Gln3-Myc13 was completely nuclear. Then, in stark contrast with cells that were not pretreated with cycloheximide, Gln3-Myc13 became increasingly nuclear to the point where cells with cytoplasmic Gln3-Myc13 were nearly undetectable, and in around 80% of them, Gln3-Myc13 was completely nuclear at 4 h (Fig. 8, D and E, right panels). This intracellular distribution of Gln3-Myc13 was then sustained for the next 6 h. This response virtually mirrored that observed at four and more hours of nitrogen starvation (Fig. 1, A and B). Therefore, the combination of inhibiting both protein synthesis and TorC1 (rapamycin addition) generated conditions leading to the same outcome as long-term nitrogen starvation. Further, Gln3-Myc13 relocation to the nucleus occurred even though the rapamycin-elicited G1 arrest that normally occurs (Fig. 8C, center histogram) was prevented by the cycloheximide addition (Fig. 8C, right histogram), arguing again that it was not the G1 arrest that was responsible for nuclear Gln3-Myc13 localization.
At first these observations puzzled us. However, on further consideration they made reasonable sense. Cycloheximide specifically inhibits protein synthesis. However, many other nitrogen utilizing reactions, both anabolic and catabolic, remain intact and, in a significant number of cases, are even increased by rapamycin addition. As a result, internal nitrogen reserves would be expected to dwindle with time, eliciting the same outcomes as nitrogen starvation, and this is what occurred.
Gln3-Myc13 Responses to Inhibition of Protein Synthesis in Nitrogen-starved Cells
The above results and conclusions generated two predictions. Pretreating cells with cycloheximide prior to starving them for nitrogen should delay relocation of Gln3-Myc13 from the cytoplasm to the nucleus following transfer of the cells to nitrogen-free medium, and Gln3-Myc13 should eventually relocate to the nucleus, as occurred in cells that were not pretreated. To test this, we treated a glutamine-grown, wild-type culture with cycloheximide (200 μgm/ml) for 30 min and then transferred the cells to nitrogen-free medium that also contained 200 μgm/ml cycloheximide, i.e. the same format used in the experiment in Fig. 8, D and E, right panels. As predicted, starving cycloheximide pretreated cells substantially delayed nuclear entry of Gln3-Myc13 (Fig. 9, A and B). Gln3-Myc13 did not begin to relocate from the cytoplasm to the nucleus for 2 h compared with 15–30 min in untreated cells (Fig. 5, A and B). This was expected because the intracellular amino acids would begin decreasing immediately after transferring the untreated cells into nitrogen-free medium, whereas a similar protein synthesis-dependent decrease in amino acid concentrations would not occur in the presence of high cycloheximide.
FIGURE 9.
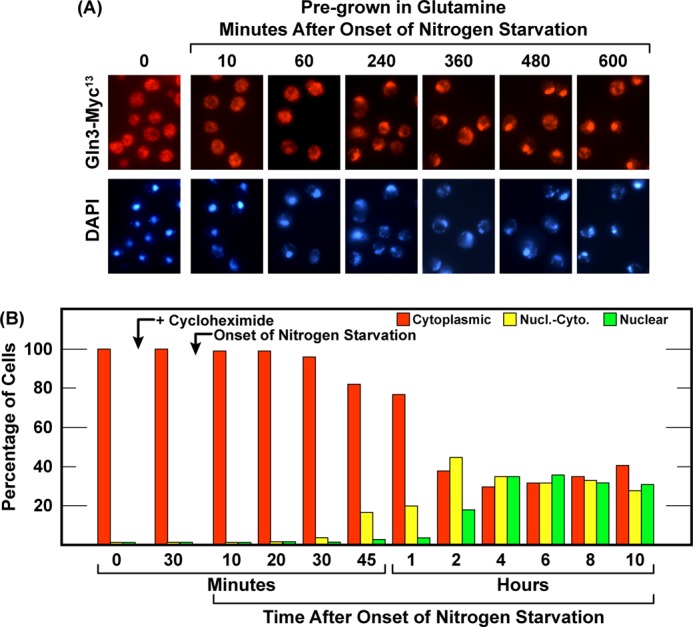
Gln3-Myc13 localization following the onset of nitrogen starvation in cycloheximide-treated cells. Wild-type (TB123) cells were grown in YNB-glutamine medium to an A600 nm = 0.5. The culture was sampled for the assay and followed immediately by the addition of 200 μgm/ml cycloheximide. After 30-min incubation, the culture was again sampled and then transferred to YNB-nitrogen-free medium containing 200 μgm/ml cycloheximide. Sampling was continued at the indicated times. Nucl.-Cyto., nuclear-cytoplasmic.
In contrast to the data in Fig. 5, nuclear Gln3-Myc13 localization continued to increase between 2 and 4 h to the point where it was equally distributed in all three scoring categories (cytoplasmic, nuclear-cytoplasmic, and nuclear). At this point, however, Gln3-Myc13 movement ceased and remained at this distribution for the next 6 h (Fig. 9, A and B). Not only was this response different from the one in Fig. 5 but also from the later time points in Fig. 8, D and E, right panels. Gln3-Myc13 appeared to complete one phase of moving into the nucleus, as we expected, but then failed to continue to become completely nuclear. By this reasoning, rapamycin was performing a function required to complete this second step. Together, these data demonstrated that the responses elicited by nitrogen starvation and rapamycin treatment did not correlate with one another either in untreated cells or in those in which protein synthesis was first inhibited.
Msx-elicited Nuclear Gln3-Myc13 Localization Is Independent of Sit4 and PP2A
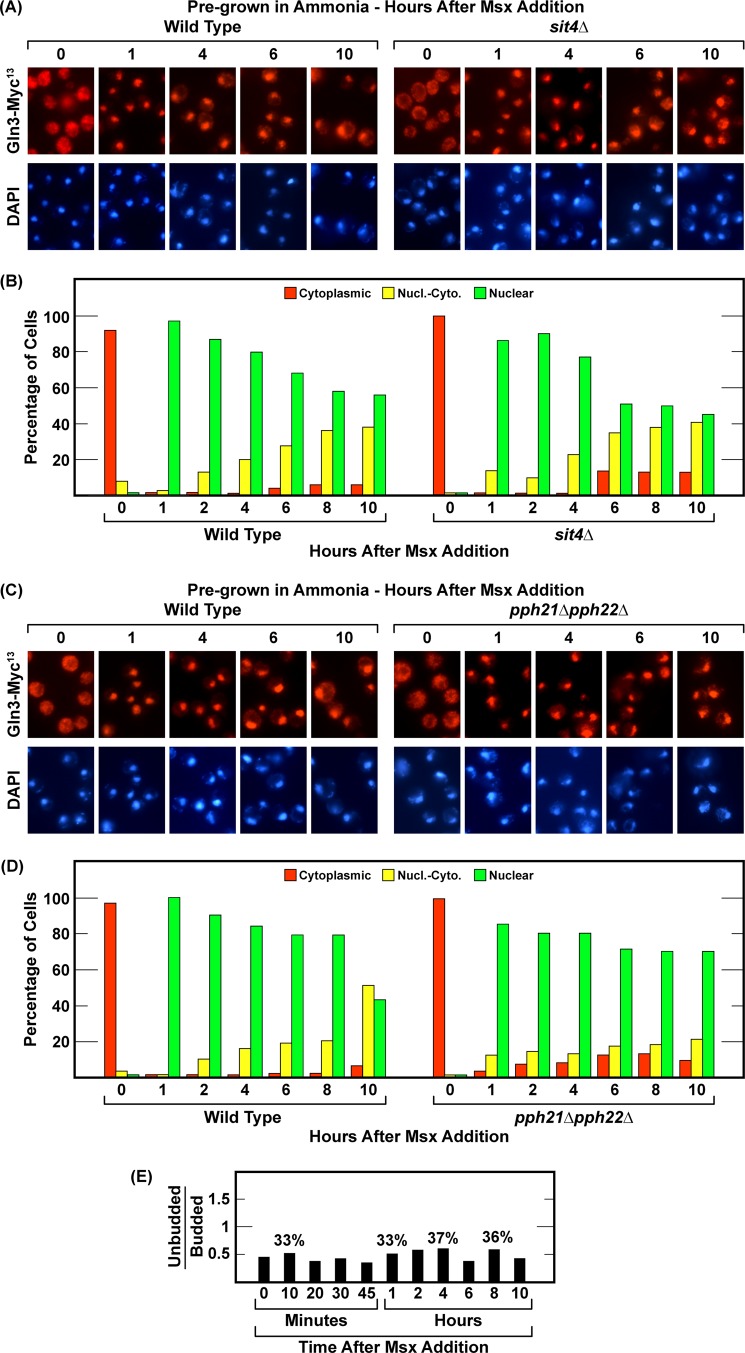
The last method used to eliciting nuclear Gln3-Myc13 localization is by treating cells with Msx (20, 22–24). Therefore, we determined the kinetics and phosphatase requirements of the Gln3 response to Msx. Msx addition to ammonia-grown wild-type and sit4Δ cultures elicited the same responses; i.e. there was no Sit4 requirement for nuclear Gln3-Myc13 localization. The response and lack of a Sit4 requirement were the same as those observed after long-term nitrogen starvation. Addition of the inhibitor resulted in prompt and nearly complete relocation of Gln3-Myc13 from the cytoplasm to the nucleus of both wild-type and sit4Δ cells (Fig. 10, A and B). There were, however, two differences compared with nitrogen-starved cells. First, Gln3-Myc13 relocated to the nuclei of Msx-treated cells much more rapidly than observed with nitrogen starvation, becoming fully nuclear in this experiment within 1 h compared with 2–4 h for a similar response after transferring the cells to nitrogen-free medium (Figs. 1 and 5, A and B). This is pertinent because, from the data above, 1 h is too short a time for cells to exhaust their overall interconvertible, internal nitrogen reserves. It might not, on the other hand, be too short a time for them to exhaust intracellular glutamine, a glutamate or glutamine metabolite. Second, in both wild-type and sit4Δ cells, there was a subsequent, slow but steady, almost linear departure of Gln3-Myc13 from the nuclei (Fig. 10, A and B).
FIGURE 10.
Nuclear Gln3-Myc13 localization in response to methionine sulfoximine addition requires neither Sit4 nor PP2A. Wild-type (TB123), sit4Δ (TB136-2a, A and B), and pph21Δpph22Δ (03705d, C and D) were grown in YNB-ammonia medium. After zero time point samples were removed from each culture, 2 mm methionine sulfoximine were added, and sampling continued for 10 h. The ratio of unbudded/budded cells was also determined at the indicated times (E). Values above the histograms indicate the percentage of unbudded cells in that sample. Nucl.-Cyto., nuclear-cytoplasmic.
A possible explanation for this slow nuclear exit derived from following the morphology of Msx-treated cells. Unlike nitrogen-starved cells, those treated with Msx did not G1-arrest their cell cycles (Fig. 10E). Although not considered previously in the literature, this is an expected result. Msx is, among other things, an effective glutamine synthetase inhibitor (21). Starving the cells for glutamine will cause the cessation of protein synthesis as the internal reserves of the amino acid are exhausted. This, in turn, will prevent G1 arrest (8, 11, 58) and cause the same Gln3-Myc13 behavior as treating the cells with cycloheximide, albeit at a much slower rate. Such conditions will, as we observed, cause Gln3-Myc13 to increasingly relocate from the nucleus to the cytoplasm.
Next, we determined whether or not PP2A was required for nuclear Gln3-Myc13 relocation following Msx addition, and, as with nitrogen starvation, no PP2A requirement could be demonstrated (Fig. 10, C and D). Together, these data indicated that the phosphatase requirements, i.e. lack of them, for nuclear Gln3-Myc13 localization elicited by long-term nitrogen starvation and Msx treatment were the same.
Gln3-Myc13 Responses to Inhibition of Protein Synthesis in Msx-treated Cells
Finally, we asked whether the responses of Msx addition to cycloheximide-treated cells were closer to those of similarly treated long-term nitrogen-starved or rapamycin-treated cells. Even though protein synthesis was inhibited by cycloheximide (200 μgm/ml), Msx still elicited relocalization of Gln3-Myc13 from the cytoplasm to the nuclei of ammonia-grown cells (Fig. 11, A and B). The level of nuclear Gln3-Myc13 attained 1 h after Msx was added to cycloheximide-treated cells was similar to that achieved following Msx addition to untreated cells and to that of cells nitrogen-starved for 3 h or more. This argued that increased amino acid levels did not affect the Msx response, an expected result if Msx inhibited a reaction downstream of the TorC1 pathway phosphatases. However, between 2 and 6 h, Gln3-Myc13 exited from the nucleus in a substantial fraction of the cells and between 6 and 10 h exhibited a uniform distribution in all three scoring categories. Thereafter, it maintained this distribution for the remaining 4 h of the experiment. This is precisely the same intracellular Gln3-Myc13 distribution that was attained 4 h after the onset of nitrogen starvation in cycloheximide-treated cells. In that case, as in this one, the uniform distribution of Gln3-Myc13 in all three scoring categories was maintained for the remaining 6 h of the experiment. Therefore, the initial responses of Gln3-Myc13 localization were not the same in nitrogen starved versus Msx-treated cells, as expected for the reasons outlined above. However, for cells pretreated with cycloheximide, the two conditions elicited identical localizations between 4 and 10 h after the perturbations were imposed on them.
FIGURE 11.
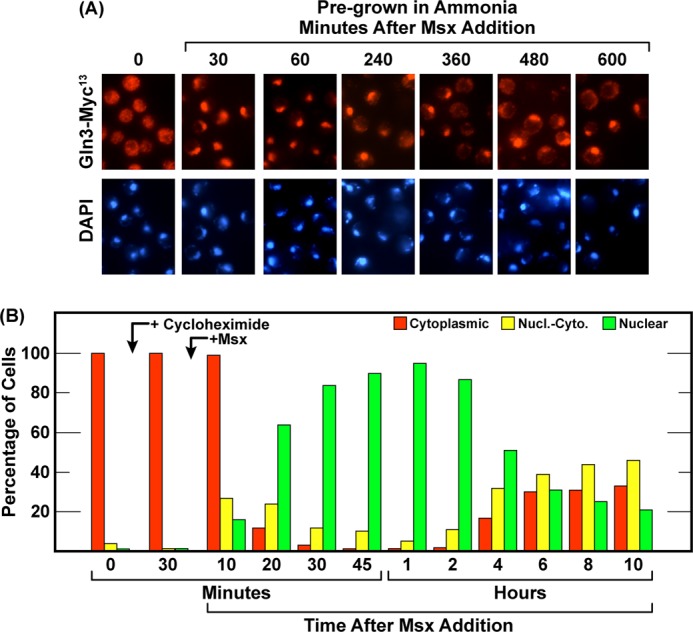
Gln3-Myc13 localization following the addition of methionine sulfoximine to cycloheximide-treated cells. The format of this experiment was the same as described in Fig. 8, D and E, except that Msx was used in place of rapamycin. Cells were pregrown in YNB-ammonia prior to addition of 2 mm Msx. Nucl.-Cyto., nuclear-cytoplasmic.
DISCUSSION
The Five Nitrogen-related Methods of Down-regulating TorC1 Are Not Physiologically Equivalent
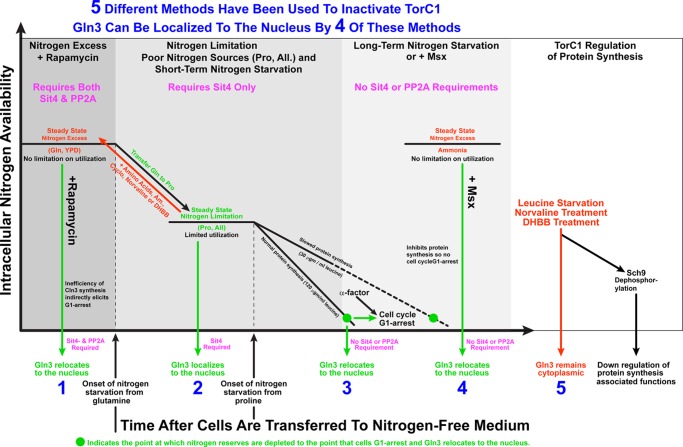
This study tested the validity of a tacit assumption underlying many of the investigations of TorC1 inactivation and downstream regulation elicited by it. The assumption was that the five conditions used to down-regulate TorC1 were, as far as TorC1 was concerned, physiologically equivalent. Our data strongly argue that they are not. Both the detailed outcomes and requirements to achieve them are specific to the experimental perturbation used to down-regulate TorC1 (Fig. 12). Two of the most often used proxies of TorC1 activation and inhibition are Sch9 phosphorylation and Gln3 localization/Gln3-mediated transcription. Yet, these two reporters responded differently to leucine starvation. Binda et al. (56) and Bonofils et al. (29) convincingly demonstrated excess leucine to be a positively acting central component in TorC1-mediated control of Sch9 phosphorylation and leucine starvation to stimulate Sch9 dephosphorylation. In contrast, we have demonstrated that leucine starvation fails to stimulate nuclear Gln3-Myc13 localization, either directly by exogenous leucine addition in amounts that limit cell growth or indirectly using the leucine tRNA synthetase inhibitors L-norvaline and DHBB, the three approaches used to establish the relationship between leucine levels and Sch9 phosphorylation (29, 56). Therefore, in this instance, the TorC1 activity reporter assayed clearly dictated the outcome (Fig. 12, method 5).
FIGURE 12.
Schematic representation of the five methods used to down-regulate TorC1 along with the downstream nuclear Gln3-Myc13 localization outcomes they elicit and phosphatase requirements they possess. The five methods used to down-regulate TorC1 activity are listed in black at the top and are labeled 1–5, with their outcomes on Gln3-Myc13 localization below the abscissa. The shaded areas demarcate the hierarchal phosphatase requirements (indicated in pink below the perturbation used) for each of the experimental perturbations employed to elicit nuclear Gln3-Myc13 localization (green arrows). Horizontal black lines at high and lower nitrogen availability denote steady-state nitrogen levels for the nitrogen sources indicated below them. Red arrows indicate increases in amino acid levels when additional nitrogen sources are added to proline-grown cells or protein synthesis is inhibited. Both conditions lead to Gln3 being sequestered in the cytoplasm. Fine vertical dotted lines indicate the points at which nitrogen starvation was imposed, and the bold dotted line indicates the extension of the time course required for starvation of cells cultured in limiting (30 μgm/ml) leucine. The green dot denotes the point at which nitrogen starvation has proceeded to the point of triggering G1 arrest of the cell cycle. At the time resolution of present experiments, it is not possible to determine whether Gln3-Myc13 begins entering the nucleus slightly prior to or concomitantly with the onset of cell cycle arrest. In sit4Δ cells, the two events appear to occur close together. It is clear, however, that G1 arrest is not required for Gln3-Myc13 to relocate to the nucleus. Therefore, we conclude that it occurs just before or at the same time as cells begin arresting. Nitrogen availability is indicated on the ordinate, whereas the abscissa indicates increasing time expiring after a given treatment (addition of nitrogen or translation inhibitors) or starvation has commenced.
Although both Sch9 phosphorylation and Gln3 localization are understandably nitrogen-responsive, they perform opposite functions, which may account for their distinct responses and differing regulation. Sch9 is central to the regulation of protein synthesis, i.e. the utilization of nitrogenous precursors. In contrast, Gln3 is central to the regulation of nitrogen-catabolic gene expression, i.e. the generation of usable nitrogenous precursors from a variety of poor nitrogen sources. From this vantage point, it is not too surprising that Gln3 and Sch9 respond differently to intracellular leucine levels. There is a good precedent for it. Gcn4 regulates protein synthesis independently of Gln3 and Gat1 involvement (60). On the other hand, there are many instances where Gln3 and Gat1 regulate NCR-sensitive transcription independently of Gcn4 (3–6). Sometimes, both Gcn4 and these GATA factors cooperatively regulate expression of a nitrogen-catabolic gene (61). Also consistent with this explanation, Sch9 is required for the proper regulation of ribosome biogenesis, translation initiation, and entry into G0 phase but not for NCR-sensitive gene expression (45).
Nitrogen-responsive Regulation Is Hierarchal
Even when a single reporter, Gln3-Myc13 localization, is considered, three of the four remaining methods of down-regulating TorC1 are not physiologically equivalent. Although each of them elicits the same outcome, nuclear Gln3-Myc13 localization, they do so restricted by distinct hierarchical requirements that correlate with the available nitrogen supply (Fig. 12). Treating cells growing in nitrogen-replete glutamine medium with rapamycin exhibited the greatest number of detectable requirements, functional Sit4 and PP2A phosphatases (Fig. 12, method 1). As the nitrogen supply became restricted to the point where it was growth-limiting, i.e. with proline as the sole nitrogen source or during short-term nitrogen starvation, the PP2A requirement was lost, and only Sit4 was required for nuclear Gln3-Myc13 localization (Fig. 12, method 2). As the internal nitrogen supply decreased still further to the point of exhaustion and triggering G1 arrest of the cell cycle, even the remaining Sit4 requirement was abrogated (Fig. 12, method 3). Indeed, long-term nitrogen starvation and Msx-elicited nuclear Gln3-Myc13 localization, the fourth and fifth methods employed previously to down-regulate TorC1, exhibited no detectable Tor pathway phosphatase requirements at all (Fig. 12, methods 3 and 4).
That nitrogen starvation and limitation (NCR) are regulated distinctly from one another makes good physiological sense because cell division is normal in the latter but not in the former. In the first case, cells are dealing with survival, whereas in the second, they are merely making the best of what is available in their environment, but they are getting by just fine. Similarly, short- and long-term nitrogen starvation are also quite distinct physiological conditions. Loss of an effective nitrogen supply short-term would limit but not abolish growth as occurs during long-term starvation. Here, internal nitrogen homeostasis mechanisms bridge such short gaps. However, as starvation progresses, the internal nitrogen reserves eventually run out, and homeostasis mechanisms can no longer keep pace with the demands, resulting in initiation of the protective G1 arrest program.
One frequently observes “nitrogen starvation” used as an experimental perturbation in the literature. However, the duration of that starvation usually ranges from 30 min to 1 or 2 h. It is clear that this is insufficient time for the experiment to be interrogating true nitrogen starvation. Responses to short-duration starvation are more mechanistically related to the effects elicited by transferring a culture from a rich to a limiting nitrogen supply than to long-term starvation (Fig. 12). Because many factors influence the rate at which the internal nitrogen supply of a cell can be exhausted, one cannot assign a particular time as the dividing line between short- and long-term starvation. However, the data in Figs. 1 and 3 suggest that a good operational distinction between the two is whether or not the cells concomitantly arrest their cycles in G1. This assumes, of course, that the perturbation does not prevent protein synthesis and, hence, G1 arrest (8, 9, 11, 12). Additionally, long-term starvation positively correlates with loss of the Sit4 requirement for nuclear Gln3-Myc13 localization.
The hierarchical relations noted above were highly dynamic. Cells growing in nitrogen-replete conditions were unable to reach starvation without passing through stages in which internal nitrogen reserves and accompanying phosphatase requirements were the same as those that exist during growth in nitrogen-limiting conditions or that exist shortly after the onset of nitrogen starvation (Fig. 11). Consistent with this idea, increasing internal amino acid levels by completely inhibiting protein synthesis (56) reversed nuclear Gln3-Myc13 localization, generating a profile like that of cells growing in excess nitrogen (Fig. 7 or 9). Conversely, slowing the rate of protein synthesis by limiting a required amino acid and, thereby, decreasing the rate of internal nitrogen utilization increased the time required for cells to pass from nitrogen limitation to starvation (Fig. 6). These metabolic dynamics were highly correlated with transitions from one set of phosphatase requirements to another.
Msx and Long-term Nitrogen Starvation May Be Participating in a Common Regulatory Pathway
The fact that nuclear Gln3-Myc13 localization elicited by long-term nitrogen starvation and Msx treatment exhibited the same phosphatase requirements suggests that the two conditions may well be involved in a common regulatory pathway. Three additional observations support this conclusion. 1) Starving wild-type cells long-term or treating them with Msx resulted in sustained (2–10 h) nuclear Gln3-Myc13 localization (Figs. 1, 5, and 10). 2) Both Msx-treated and long-term nitrogen-starved cells pretreated with cycloheximide elicited the same intracellular Gln3-Myc13 distribution profiles (4–10 h after starvation or Msx addition), profiles and kinetics that differed substantially from those observed following rapamycin addition (Figs. 8, 9, and 11). 3) Both nitrogen starvation and Msx treatment increase rather than decrease Gln3 phosphorylation (22, 23).
Relative to the second point above, we made a potentially significant observation that we have seen multiple times in the past. It may be serendipitous, but to be so would require more than a usual amount of coincidence. It is seen most clearly during 4 to 10 h following the onset of nitrogen starvation in cycloheximide-treated cells or following addition of Msx to cycloheximide-treated cells (Fig. 9, A and B, and Fig. 11, A and B). In both cases, Gln3-Myc13 was distributed roughly equally in all three scoring categories, cytoplasmic, nuclear-cytoplasmic, and nuclear. Further, that distribution was reproducibly sustained over time. Another potential case of this characteristic was observed at 0.5 and 1.0 h after treating proline-grown cells with 200 μgm/ml cycloheximide (Fig. 7). When Gln3-Myc13 is moving into or out of the nucleus, it is easily conceivable that it would briefly be equally distributed in all three of our scoring categories. What is significant about the present results is that this distribution was sustained over a significant period of time, as much as 4 to 6 h. Anecdotally, as we have manually scored Gln3-Myc13 distribution in over a half million cells, behavior such as this has not been seen often. Further, these uniform intracellular Gln3-Myc13 distributions are identical to those observed with either Gln3 truncations or serine substitutions that result in the loss of an association between Gln3 and Tor1 in a two-hybrid assay (Fig. 2, A and B, in Ref. 39). This is, in formal terms, the type of data one might expect if two regulatory processes were in play and only one of them was lost or remained.
How To Rectify Results with Gln3-Myc13 Localization with Those Measuring Sch9 Phosphorylation
There is substantial literature demonstrating that cytoplasmic Gln3-Myc13 sequestration and Sch9 phosphorylation both require active TorC1 (1, 2, 45). There is equally convincing evidence supporting the contention that high intracellular leucine is a positive regulator of TorC1 activation. One is then faced with the question of how to rectify the differing outcomes of leucine starvation with respect to Gln3-Myc13 sequestration and Sch9 phosphorylation. This paradox raises the clear possibility that nitrogen-responsive TorC1 activity is regulated in more than one way, for which there is ample precedent in mammalian cells. Also, it is likely relevant that in the work of Binda et al. (56), they note that responses similar to those obtained with leucine were also obtained with histidine and lysine and that increasing the overall intracellular levels of amino acids by inhibiting protein synthesis resulted in rapid nuclear exit of Gln3-Myc13 when cells are cultured under nitrogen-limiting conditions (Fig. 6).
Multiple Regulatory Pathways Working Together to Achieve Fine Nitrogen-responsive Regulation
A fundamental finding of this and previous work is the demonstration that distinct regulatory pathways are involved in the downstream outcomes of nitrogen-responsive regulation in S. cerevisiae. Moreover, the individual pathways, although accounting for some of the nitrogen-dependent responses, cannot account for all of them unless they are considered together. There is cross-talk and some commonality among the pathways, as seen by the hierarchical phosphatase requirements for nitrogen source-dependent nuclear Gln3-Myc13 localization. Whether other nitrogen-responsive and/or TorC1-regulated downstream outcomes will display a similar degree of regulatory diversity and flexibility remains to be seen. However, we now know that such complexity and diversity exist, and this will facilitate their potential discovery in other systems as well. Finally, the experiments in this work strongly suggest that the various conditions that elicit TorC1 activation or inhibition are not physiologically equivalent and, hence, that data derived from them addressing the regulatory mechanisms involved may not be interpreted interchangeably. This realization may, in turn, help to resolve some of the past controversies concerning the mechanisms of nitrogen-responsive regulation. Also, the common requirements of long-term nitrogen starvation and Msx addition suggest that they represent two ways of perturbing a common regulatory pathway. This interpretation may, in turn, contribute to resolving some of the controversy surrounding whether Msx and rapamycin inhibit one nitrogen-responsive regulatory pathway or two.
Acknowledgments
We thank Drs. Rajendra Rai and Michael Whitt for suggestions to improve the manuscript.
This work was supported, in whole or in part, by National Institutes of Health Grant GM-35642-23.
- Msx
- L-methionine sulfoximine
- DHBB
- 1,3-dihydro-1-hydroxy-2,1-benzoxaborole
- NCR
- nitrogen catabolite repression.
REFERENCES
- 1. Broach J. R. (2012) Nutritional control of growth and development in yeast. Genetics 192, 73–105 [DOI] [PMC free article] [PubMed] [Google Scholar]
- 2. Zaman S., Lippman S. I., Zhao X., Broach J. R. (2009) How Saccharomyces responds to nutrients. Annu. Rev. Genet. 42, 2.1–2.55 [DOI] [PubMed] [Google Scholar]
- 3. Cooper T. G. (1982) in Molecular Biology of the Yeast Saccharomyces. Metabolism and Gene Expression. (Strathern J.N., Jones E. W., Broach J.R., eds) pp. 39–99, Cold Spring Harbor Laboratory, Cold Spring Harbor, NY [Google Scholar]
- 4. Hofman-Bang J. (1999) Nitrogen catabolite repression in Saccharomyces cerevisiae. Mol. Biotechnol. 12, 35–73 [DOI] [PubMed] [Google Scholar]
- 5. Magasanik B., Kaiser C. A. (2002) Nitrogen regulation in Saccharomyces cerevisiae. Gene 290, 1–18 [DOI] [PubMed] [Google Scholar]
- 6. Cooper T. G. (2004) in Nutrient-induced Responses in Eukaryotic Cells. Topics in Current Genetics (Winderickx J., Taylor P. M., eds) pp. 225–257, Springer Verlag, Berlin [Google Scholar]
- 7. Cybulski N., Hall M. N. (2009) TOR complex 2. A signaling pathway of its own. Trends Biochem. Sci. 34, 620–627 [DOI] [PubMed] [Google Scholar]
- 8. Johnston G. C., Pringle J. R., Hartwell L. H. (1977) Coordination of growth with cell division in the yeast Saccharomyces cerevisiae. Exp. Cell Res. 105, 79–98 [DOI] [PubMed] [Google Scholar]
- 9. Unger M. W., Hartwell L. H. (1976) Control of cell division in Saccharomyces cerevisiae by methionyl-tRNA. Proc. Natl. Acad. Sci. U.S.A. 73, 1664–1668 [DOI] [PMC free article] [PubMed] [Google Scholar]
- 10. Barbet N. C., Schneider U., Helliwell S. B., Stansfield I., Tuite M. F., Hall M. N. (1996) TOR controls translation initiation and early G1 progression in yeast. Mol. Biol. Cell 7, 25–42 [DOI] [PMC free article] [PubMed] [Google Scholar]
- 11. Johnston G. C., Singer R. A., McFarlane S. (1977) Growth and cell division during nitrogen starvation of the yeast Saccharomyces cerevisiae. J. Bacteriol. 132, 723–730 [DOI] [PMC free article] [PubMed] [Google Scholar]
- 12. Williamson D. H., Scopes A. W. (1962) A rapid method for synchronizing division in the yeast Saccharomyces cerevisiae. Nature 193, 256–257 [Google Scholar]
- 13. Heitman J., Movva N. R., Hall M. N. (1991) Targets for cell cycle arrest by the immunosuppressant rapamycin in yeast. Science 253, 905–909 [DOI] [PubMed] [Google Scholar]
- 14. Beck T., Hall M. N. (1999) The TOR signalling pathway controls nuclear localization of nutrient-regulated transcription factors. Nature 402, 689–692 [DOI] [PubMed] [Google Scholar]
- 15. Bertram P. G., Choi J. H., Carvalho J., Ai W., Zeng C., Chan T. F., Zheng X. F. (2000) Tripartite regulation of Gln3p by TOR, Ure2p, and phosphatases. J. Biol. Chem. 275, 35727–35733 [DOI] [PubMed] [Google Scholar]
- 16. Cardenas M. E., Cutler N. S., Lorenz M. C., Di Como C. J., Heitman J. (1999) The TOR signaling cascade regulates gene expression in response to nutrients. Genes Dev. 13, 3271–3279 [DOI] [PMC free article] [PubMed] [Google Scholar]
- 17. Shamji A. F., Kuruvilla F. G., Schreiber S. L. (2000) Partitioning the transcriptional program induced by rapamycin among the effectors of the Tor proteins. Curr. Biol. 10, 1574–1581 [DOI] [PubMed] [Google Scholar]
- 18. Hardwick J. S., Kuruvilla F. G., Tong J. K., Shamji A. F., Schreiber S. L. (1999) Rapamycin-modulated transcription defines the subset of nutrient-sensitive signaling pathways directly controlled by the Tor proteins. Proc. Natl. Acad. Sci. U.S.A. 96, 14866–14870 [DOI] [PMC free article] [PubMed] [Google Scholar]
- 19. Beck T., Schmidt A., Hall M. N. (1999) Starvation induces vacuolar targeting and degradation of the tryptophan permease in yeast. J. Cell Biol. 146, 1227–1238 [DOI] [PMC free article] [PubMed] [Google Scholar]
- 20. Crespo J. L., Powers T., Fowler B., Hall M. N. (2002) The TOR-controlled transcription activators GLN3, RTG1, and RTG3 are regulated in response to intracellular levels of glutamine. Proc. Natl. Acad. Sci. U.S.A. 99, 6784–6789 [DOI] [PMC free article] [PubMed] [Google Scholar]
- 21. Marek E. T., Dickson R. C. (1987) Cloning and characterization of Saccharomyces cerevisiae genes that confer L-methionine sulfoximine and tabtoxin resistance. J. Bacteriol. 169, 2440–2448 [DOI] [PMC free article] [PubMed] [Google Scholar]
- 22. Tate J. J., Rai R., T. G., Cooper T. G. (2005) Methionine sulfoximine treatment and carbon starvation elicit Snf1-independent phosphorylation of the transcription activator Gln3 in Saccharomyces cerevisiae. J. Biol. Chem. 280, 27195–27204; Correction (2007) J. Biol. Chem.282, 13139 [DOI] [PMC free article] [PubMed] [Google Scholar]
- 23. Kulkarni A., Buford T. D., Rai R., Cooper T. G. (2006) Differing responses of Gat1 and Gln3 phosphorylation and localization to rapamycin and methionine sulfoximine treatment in Saccharomyces cerevisiae. FEMS Yeast Res. 6, 218–229 [DOI] [PMC free article] [PubMed] [Google Scholar]
- 24. Georis I., Tate J. J., Cooper T. G., Dubois E. (2011) Nitrogen-responsive regulation of GATA protein family activators Gln3 and Gat1 occurs by two distinct pathways, one inhibited by rapamycin and the other by methionine sulfoximine. J. Biol. Chem. 286, 44897–44912 [DOI] [PMC free article] [PubMed] [Google Scholar]
- 25. Di Como C. J., Arndt K. T. (1996) Nutrients, via the Tor proteins, stimulate the association of Tap42 with type 2A phosphatases. Genes Dev. 10, 1904–1916 [DOI] [PubMed] [Google Scholar]
- 26. Jiang Y., Broach J. R. (1999) Tor proteins and protein phosphatase 2A reciprocally regulate Tap42 in controlling cell growth in yeast. EMBO J. 18, 2782–2792 [DOI] [PMC free article] [PubMed] [Google Scholar]
- 27. Tate J. J., Cooper T. G. (2003) Tor1/2 regulation of retrograde gene expression in Saccharomyces cerevisiae derives indirectly as a consequence of alterations in ammonia metabolism. J. Biol. Chem. 278, 36924–36933 [DOI] [PMC free article] [PubMed] [Google Scholar]
- 28. Kuranda K., Leberre V., Sokol S., Palamarczyk G., François J. (2006) Investigating the caffeine effects in the yeast Saccharomyces cerevisiae brings new insights into the connection between TOR, PKC and Ras/cAMP signalling pathways. Mol. Microbiol. 61, 1147–1166 [DOI] [PubMed] [Google Scholar]
- 29. Bonfils G., Jaquenoud M., Bontron S., Ostrowicz C., Ungermann C., De Virgilio C. (2012) Leucyl-tRNA synthetase controls TORC1 via the EGO complex. Mol. Cell 46, 105–110 [DOI] [PubMed] [Google Scholar]
- 30. Werner-Washburne M., Braun E., Johnston G. C., Singer R. A. (1993) Stationary phase in the yeast Saccharomyces cerevisiae. Microbiol. Rev. 57, 383–401 [DOI] [PMC free article] [PubMed] [Google Scholar]
- 31. Gray J. V., Petsko G. A., Johnston G. C., Ringe D., Singer R. A., Werner-Washburne M. (2004) “Sleeping beauty”. Quiescence in Saccharomyces cerevisiae. Microbiol. Mol. Biol. Rev. 68, 187–206 [DOI] [PMC free article] [PubMed] [Google Scholar]
- 32. Schmidt A., Beck T., Koller A., Kunz J., Hall M. N. (1998) The TOR nutrient signalling pathway phosphorylates NPR1 and inhibits turnover of the tryptophan permease. EMBO J. 17, 6924–6931 [DOI] [PMC free article] [PubMed] [Google Scholar]
- 33. Wang H., Wang X., Jiang Y. (2003) Interaction with Tap42 is required for the essential function of Sit4 and type 2A phosphatases. Mol. Biol. Cell 14, 4342–4351 [DOI] [PMC free article] [PubMed] [Google Scholar]
- 34. Tate J. J., Feller A., Dubois E., Cooper T. G. (2006) Saccharomyces cerevisiae Sit4 phosphatase is active irrespective of the nitrogen source provided, and Gln3 phosphorylation levels become nitrogen source-responsive in a sit4-deleted strain. J. Biol. Chem. 281, 37980–37992 [DOI] [PMC free article] [PubMed] [Google Scholar]
- 35. Georis I., Tate J. J., Cooper T. G., Dubois E. (2008) Tor pathway control of the nitrogen-responsive DAL5 gene bifurcates at the level of Gln3 and Gat1 regulation in Saccharomyces cerevisiae. J. Biol. Chem. 283, 8919–8929 [DOI] [PMC free article] [PubMed] [Google Scholar]
- 36. Tate J. J., Georis I., Feller A., Dubois E., Cooper T. G. (2009) Rapamycin-induced Gln3 dephosphorylation is insufficient for nuclear localization: Sit4 and PP2A phosphatases are regulated and function differently. J. Biol. Chem. 284, 2522–2534 [DOI] [PMC free article] [PubMed] [Google Scholar]
- 37. Tate J. J., Georis I., Dubois E., Cooper T. G. (2010) Distinct phosphatase requirements and GATA factor responses to nitrogen catabolite repression and rapamycin treatment in Saccharomyces cerevisiae. J. Biol. Chem. 285, 17880–17895 [DOI] [PMC free article] [PubMed] [Google Scholar]
- 38. Feller A., Georis I., Tate J. J., Cooper T. G., Dubois E. (2013) Alterations in the Ure2 αCap domain elicit different GATA factor responses to rapamycin treatment and nitrogen limitation. J. Biol. Chem. 288, 1841–1855 [DOI] [PMC free article] [PubMed] [Google Scholar]
- 39. Rai R., Tate J. J., Nelson D. R., Cooper T. G. (2013) gln3 mutations dissociate responses to nitrogen limitation (nitrogen catabolite repression) and rapamycin inhibition of TorC1. J. Biol. Chem. 288, 2789–2804 [DOI] [PMC free article] [PubMed] [Google Scholar]
- 40. Sumrada R., Cooper T. G. (1978) Control of vacuole permeability and protein degradation by the cell cycle arrest signal in Saccharomyces cerevisiae. J. Bacteriol. 136, 234–246 [DOI] [PMC free article] [PubMed] [Google Scholar]
- 41. Cox K. H., Kulkarni A., Tate J. J., Cooper T. G. (2004) Gln3 phosphorylation and intracellular localization in nutrient limitation and starvation differ from those generated by rapamycin inhibition of Tor1/2 in Saccharomyces cerevisiae. J. Biol. Chem. 279, 10270–10278 [DOI] [PMC free article] [PubMed] [Google Scholar]
- 42. Georis I., Tate J. J., Feller A., Cooper T. G., Dubois E. (2011) Intranuclear function for protein phosphatase 2A: Pph21 and Pph22 are required for rapamycin-induced GATA factor binding to the DAL5 promoter in yeast. Mol. Cell. Biol. 31, 92–104 [DOI] [PMC free article] [PubMed] [Google Scholar]
- 43. Schwartz K., Richards K., Botstein D. (1997) BIM1 encodes a microtubule-binding protein in yeast. Mol. Biol. Cell 8, 2677–2691 [DOI] [PMC free article] [PubMed] [Google Scholar]
- 44. Cox K. H., Tate J. J., Cooper T. G. (2002) Cytoplasmic compartmentation of Gln3 during nitrogen catabolite repression and the mechanism of its nuclear localization during carbon starvation in Saccharomyces cerevisiae. J. Biol. Chem. 277, 37559–37566 [DOI] [PMC free article] [PubMed] [Google Scholar]
- 45. Urban J., Soulard A., Huber A., Lippman S., Mukhopadhyay D., Deloche O., Wanke V., Anrather D., Ammerer G., Riezman H., Broach J. R., De Virgilio C., Hall M. N., Loewith R. (2007) Sch9 is a major target of TORC1 in Saccharomyces cerevisiae. Mol. Cell 26, 663–674 [DOI] [PubMed] [Google Scholar]
- 46. Kitamoto K., Yoshizawa K., Ohsumi Y., Anraku Y. (1988) Dynamic aspects of vacuolar and cytosolic amino acid pools of Saccharomyces cerevisiae. J. Bacteriol. 170, 2683–2686 [DOI] [PMC free article] [PubMed] [Google Scholar]
- 47. Hartwell L. H. (1970) Periodic density fluctuation during the yeast cell cycle and the selection of synchronous cultures. J. Bacteriol. 104, 1280–1285 [DOI] [PMC free article] [PubMed] [Google Scholar]
- 48. Wilkinson L. E., Pringle J. R. (1974) Transient Gl arrest of S. cerevisiae cells of mating type a by a factor produced by cells of mating type a. Exp. Cell Res. 89, 175–187 [DOI] [PubMed] [Google Scholar]
- 49. Elledge S. J., Davis R. W. (1990) Two genes differentially regulated in the cell cycle and by DNA-damaging agents encode alternative regulatory subunits of ribonucleotide reductase. Genes Dev. 4, 740–751 [DOI] [PubMed] [Google Scholar]
- 50. Desany B. A., Alcasabas A. A., Bachant J. B., Elledge S. J. (1998) Recovery from DNA replicational stress is the essential function of the S-phase checkpoint pathway. Genes Dev. 12, 2956–2970 [DOI] [PMC free article] [PubMed] [Google Scholar]
- 51. Sprague G. F., Jr., Herskowitz I. (1981) Control of yeast cell type by the mating type locus. I. Identification and control of expression of the a-specific gene BAR1. J. Mol. Biol. 153, 305–321 [DOI] [PubMed] [Google Scholar]
- 52. Ciejek E., Thorner J. (1979) Recovery of S. cerevisiae a cells from G1 arrest by α factor pheromone requires endopeptidase action. Cell 18, 623–635 [DOI] [PubMed] [Google Scholar]
- 53. Ataide S. F., Ibba M. (2006) Small molecules. Big players in the evolution of protein synthesis. ACS Chem. Biol. 1, 285–297 [DOI] [PubMed] [Google Scholar]
- 54. Chen X., Ma J. J., Tan M., Yao P., Hu Q. H., Eriani G., Wang E. D. (2011) Modular pathways for editing non-cognate amino acids by human cytoplasmic leucyl-tRNA synthetase. Nucleic Acids Res. 39, 235–247 [DOI] [PMC free article] [PubMed] [Google Scholar]
- 55. Rock F. L., Mao W., Yaremchuk A., Tukalo M., Crépin T., Zhou H., Zhang Y. K., Hernandez V., Akama T., Baker S. J., Plattner J. J., Shapiro L., Martinis S. A., Benkovic S. J., Cusack S., Alley M. R. (2007) An antifungal agent inhibits an aminoacyl-tRNA synthetase by trapping tRNA in the editing site. Science 316, 1759–1761 [DOI] [PubMed] [Google Scholar]
- 56. Binda M., Péli-Gulli M. P., Bonfils G., Panchaud N., Urban J., Sturgill T. W., Loewith R., De Virgilio C. (2009) The Vam6 GEF controls TORC1 by activating the EGO complex. Mol. Cell 35, 563–573 [DOI] [PubMed] [Google Scholar]
- 57. Beugnet A., Tee A. R., Taylor P. M., Proud C. G. (2003) Regulation of targets of mTOR (mammalian target of rapamycin) signalling by intracellular amino acid availability. Biochem. J. 372, 555–566 [DOI] [PMC free article] [PubMed] [Google Scholar]
- 58. Markwardt D. D., Garrett J. M., Eberhardy S., Heideman W. (1995) Activation of the Ras/cyclic AMP pathway in the yeast Saccharomyces cerevisiae does not prevent G1 arrest in response to nitrogen starvation. J. Bacteriol. 177, 6761–6765 [DOI] [PMC free article] [PubMed] [Google Scholar]
- 59. Cooper T. G., Bossinger J. (1976) Selective inhibition of protein synthesis initiation in Saccharomyces cerevisiae by low concentrations of cycloheximide. J. Biol. Chem. 251, 7278–7280 [PubMed] [Google Scholar]
- 60. Hinnebusch A. G., Natarajan K. (2002) Gcn4p, a master regulator of gene expression, is controlled at multiple levels by diverse signals of starvation and stress. Eukaryot. Cell 1, 22–32 [DOI] [PMC free article] [PubMed] [Google Scholar]
- 61. Hernández H., Aranda C., Riego L., González A. (2011) Gln3-Gcn4 hybrid transcriptional activator determines catabolic and biosynthetic gene expression in the yeast Saccharomyces cerevisiae. Biochem. Biophys. Res. Commun. 404, 859–864 [DOI] [PubMed] [Google Scholar]


