Abstract
Current intraoperative imaging systems are typically not able to provide ‘sharp’ images over entire large areas or entire organs. Distinct structures such as tissue margins or groups of malignant cells are therefore often difficult to detect, especially under low signal-to-noise-ratio conditions. In this report, we introduce a noise suppressed multifocus image fusion algorithm, that provides detailed reconstructions even when images are acquired under sub-optimal conditions, such is the case for real time fluorescence intraoperative surgery. The algorithm makes use of the Anscombe transform combined with a multi-level stationary wavelet transform with individual threshold-based shrinkage. While the imaging system is integrated with a respiratory monitor triggering system, it can be easily adapted to any commercial imaging system. The developed algorithm is made available as a plugin for Osirix.
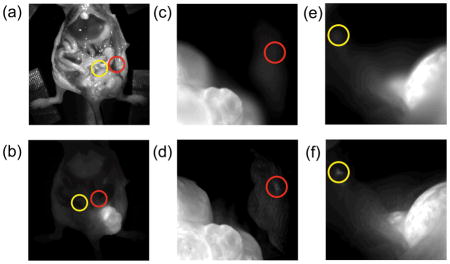
Intraoperative detection of small malignant fluorescent cells using the proposed noise suppressed multifocus image fusion system. Red/Yellow circles indicate small groups of malignant cells.
Introduction
Intravital optical imaging systems with different resolution scales are being increasingly used for both experimental as well as clinical purposes [1]. In recent years, macroscopic fluorescence reflectance optical imaging (FRI) has received particular attention due to the availability of improved targeted and activatable agents for early detection of cancer and inflammation. To achieve deeper imaging (a few millimeters into tissue), light in the near infrared (NIR) region is usually preferred since it penetrates tissue better and minimizes autofluorescence contributions, yielding higher SNR images. To date, several reports have demonstrated the power of NIR microscopy in experimental mouse imaging [2] and more recently also in human patients [3]. During typical cancer resections, tissue margins are evaluated postoperatively and patients undergo additional procedures should the margins be positive. Alternatively, real-time frozen sections are obtained during surgery but are often reserved for complex (major abdominal, brain tumor resections) or specialized (melanoma) surgeries. Both approaches naturally suffer from sampling errors, due to poor and incomplete visualization of tissue margins.
When imaging entire organs or large areas of tissue, resolution and imaging time have to be carefully balanced. While a large field of view (FOV) is useful for panoramic overviews, high magnifications are necessary for high-resolution imaging. The latter requires the area of interest to be in focus. Resected areas (often > 1cm) rarely present uniform morphology or a flat surface. As a result, simultaneous information from different focal planes of the imaging system is difficult to obtain. Images are consequently blurry, which in turn makes small structures such as groups of malignant cells, impossible to discern. Moreover, weak fluorescence intensities and/or the need for short integration times to avoid motion artifacts during in vivo imaging, create noise that ultimately affects the quality of the fluorescence signal.
There are two possible solutions to overcome the focal problem. The first is to use telecentric lenses, which can provide large focal depths [4]. The disadvantage of this approach is the very low collection efficiency these optical systems provide making them unsuitable for in vivo fluorescence imaging. The alternative solution is to use multifocus fusion algorithms, which typically involve collecting a stack of images, acquired by varying the focal plane of the imaging lens. This ensures that every feature within the field of view falls within the focal plane of at least one image in the stack. In-focus structures are then detected from individual images and used to reconstruct a final “all-in-focus” image.
Since its original report nearly 30 years ago [5], a variety of white light, multifocus fusion approaches have been proposed [6–9]. Despite the advances it still has been difficult to achieve clear images of whole organs under low signal-to-noise ratio (SNR) conditions. Herein, we present a noise suppressed fusion algorithm, used in combination with an optical imaging setup, that enables triggered acquisition of intravital fluorescence images and provides wide field, in-focus images.
During bright field or fluorescence image acquisition, the noise suppressed fusion algorithm selects the sharpest components in each image acquired at a specific focal plane, to render a single all-in-focus image. Since the algorithm is able to provide intermediate results (i.e. after collecting the n-th image, the algorithm is able to update the reconstructed image in real time using information provided up to that point), it is not necessary to wait for all images to be acquired before post-processing. This is particularly important during surgery, where time is critical. The noise suppression component of the algorithm also allows short acquisition times, overcoming artifacts arising from breathing motion. Since the proposed system is already integrated with a respiratory monitor triggering system, it is suited to most in vivo imaging situations. The algorithm’s noise suppression component can also be used during ex vivo imaging where it is most useful for low SNR applications. Finally, the resulting “all-in-focus” images can be further processed, e.g. through automatic segmentation, to delineate tissue margins or quantifying anatomical areas.
2. Methods
2.1 Experimental
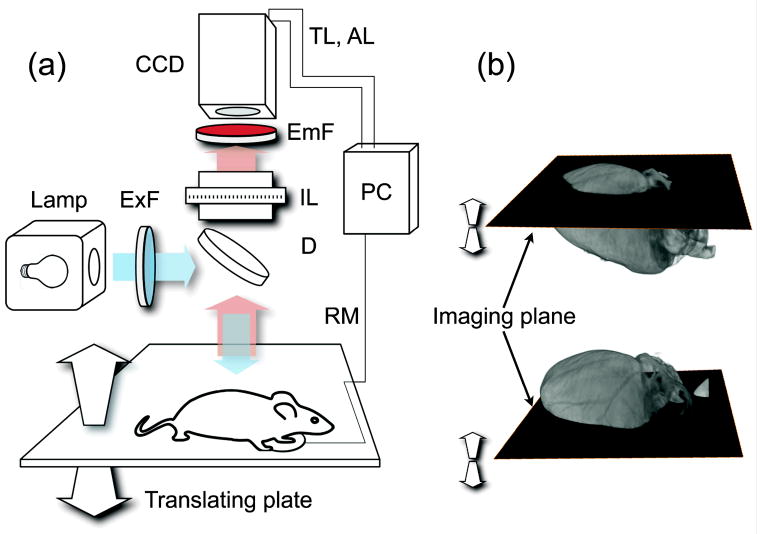
In this study, we used both a commercial (OV110, Olympus) as well as a custom-built fluorescence reflectance imaging system. While the two systems were equivalent in terms of optical characteristics (i.e. cameras, objective lens, emission and fluorescence filters), the image sensor (charge-coupled device; CCD) in the custom-built system was externally triggerable. This option is particularly useful for imaging organs affected by respiratory motion. A scheme of the experimental setup is illustrated in Fig. 1. A halogen lamp was used to provide white light illumination and fluorophore excitation. To achieve uniform illumination of the sample, light was first guided through an optical fiber bundle and then passed through a scattering element. Images were collected in epi-illumination mode using a zoom lens and recorded using the CCD camera. The height of the optical imaging plane was varied via a translation stage; a stack of images was thus acquired, with each image presenting a different area in focus within the region of interest. To minimize motion artefacts, a respiratory monitor was used to trigger the acquisitions at the end of the expiration phase. During acquisition, images were processed in real time.
Figure 1.
(a) Imaging setup. CCD: charge-coupled device; ExF: excitation filter; EmF: Emission filter; IL: imaging lens; D dichroic; RM: respiratory monitor; TL: trigger line; AL: acquisition line. (b) During imaging, the optical imaging plane is translated along the vertical direction and images are collected across the entire sample.
For in vivo imaging, mice (n=3) were anesthetized with isoflurane (2% in 2 L/min oxygen) and injected intraperitoneally with 106 LS174T cells in 50 μL PBS. After 2 weeks, mice were injected via tail vein with 30 μg of anti-A33 antibody (MAB 3080, R&D Systems) labeled with VivoTag 680 (Perkin Elmer), to target the tumor cells. Two days later, mice were re-anaesthetised, following which the abdominal cavity was exposed and tumors were imaged and resected. Images were taken using an OV110 fluorescence imaging system (Olympus) with a 200 ms exposure time and a 0.89X objective. Following in vivo imaging, mice were sacrificed.
2.2 Algorithm
The simplest way to compute image fusion is to employ a pixel-by-pixel approach using the source images. This technique, however, is limited by artifacts, primarily due to noise, which act to reduce the contrast of the reconstructed image. Several approaches for image fusion have been proposed to date, each of which are designed to work in the space domain [10], the transform domain [11] or both [12]. The first attempt to fuse images in the transform domain consisted of exploiting the gaussian pyramid structure [5]. Subsequent attempts have gone on to exploit domains such as the discrete wavelet transform (DWT)[11]. Transform domain fusion works by combining images, after they have been transformed, by processing the obtained coefficients. This DWT method has likewise been proven effective in image fusion, but has the drawback of being a non stationary transformation. Consequently, a translated version of the signal does not in general lead to a translated version of the wavelet coefficients. As a result, artifacts can occur in the resulting fused image when images are not perfectly registered, as is the case when sample movements occur. A variation of the DWT is the stationary wavelet transform (SWT) [12–13], which is a wavelet transform algorithm designed to overcome the lack of translation-invariance.
Under normal imaging conditions, low noise images can be obtained by adjusting the exposure time and/or averaging the image sequences. These strategies, however, can have severe limitations, particularly when acquiring in vivo images of either endogenous fluorescent reporters or in vivo administered fluorescence contrast agents; these usually have considerably low signal intensity. Moreover, due to respiratory and cardiac motions, it is impossible to acquire images with integration times greater than or equal to the motion’s period without inducing blurring artifacts. Short integration times are therefore necessary. However, when averaging over multiple images, the total acquisition time for each frame is increased. As a result, images with low SNRs are inevitable. In the present study, we thus explored the feasibility of an alternative solution to the problem, by integrating a fusion algorithm with a noise suppression processing scheme. Specifically, we adopt a multi-level SWT, which we combine with spatial-frequency information and a noise suppression process integrated within the fusion. Here, unlike [12], sum modified Laplacian (SML) [14] was only used to fuse the approximation signal; the maximum selection rule was instead applied to the magnitude of the detail coefficients.
In order to obtain the SWT decomposition, high and low-pass filters were applied to the data, in a similar manner to DWT but without decimation. As described in [12,15], a signal f(x) can be projected at each level of the decomposition through a scaling function φ(x) (low pass filter) that is iteratively translated and dilated. Discrete approximation of the wavelet coefficient at level j translated by k is defined as:
| (1) |
with
| (2) |
By defining φ(x) as the wavelet function, the detail signal coefficients at level 2j are
| (3) |
Since the scale function has the property
| (4) |
the coefficient cj+1,k can be obtained by
| (5) |
where h(n) is a low pass filter. Instead, due to
| (6) |
details can be computed by
| (7) |
| (8) |
where g(n) is a high pass filter. Thus so far, the formulas are identical to those used for classical DWT. Since decimation is not required for SWT, formulas can be instead written as:
| (9) |
| (10) |
In two dimensions, the transformation is separable and can be computed by applying both low and high pass filters along the x and y axes, as follows:
| (11) |
| (12) |
| (13) |
| (14) |
Such a decomposition produces sub-bands that are equal in size to the original image due to the elimination of the downsampling operation. The arising redundancy is treated by recursively applying equation (15)
| (15) |
Here, c can be interchanged with cA (the approximation coefficients) while ω1,2,3 can be replaced with cDv, cDh and cDd (vertical, horizontal, and diagonal detail coefficients, respectively).
By iteratively applying the described decomposition process, a multilevel decomposition is obtained. Coefficients can then be processed using the noise suppressing algorithm. While the iterative process leads to a redundant representation of the image at the expense of the computational speed and memory usage, it does not constitute a practical limitation for typical fluorescence in vivo imaging where images 512×512 are acquired. To note that here shot-noise is the dominant source of noise responsible for image corruption. Hence, we modelled it using a Poisson distribution, where the noise variance is related to the amplitude of the measured signal [16].
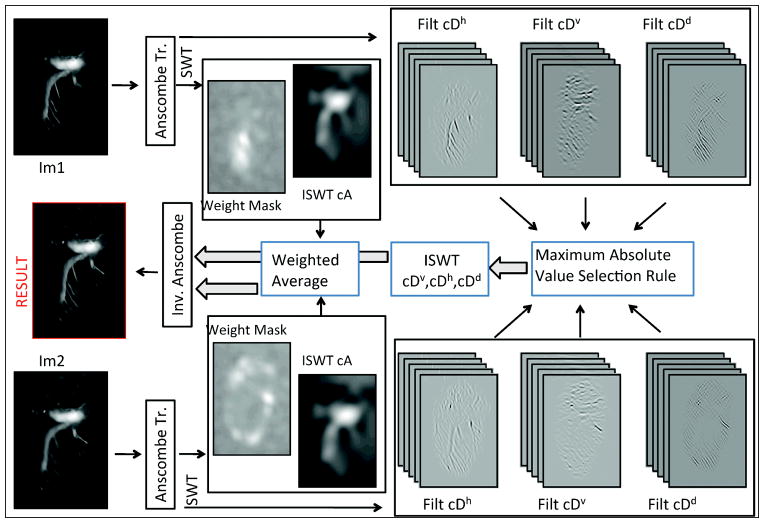
In order to improve image quality, we exploited recent advances in the numerical treatment of Shot (or Poisson) noise; these have centered, instead of direct Poisson data denoising [17], on the application of a special transformation that converts Poisson noise into noise that is approximately homoscedastic and Gaussian distributed. The Anscombe transform is a variance-stabilizing transformation often used for pre-processing data prior to the application of noise suppressing algorithms. In this transform (i.e. y = 2(x+3/8)1/2) [18], a random variable (x) with a Poisson distribution is transformed into a variable (y) with an approximately Gaussian distribution with unitary variance (as long as imaging is not performed under low photon count condition) and can thus undergo noise suppression by shrinking the wavelet coefficients. In our study, we chose to use the hard universal threshold as it is simple to compute and it is widely employed for reducing noise in the wavelet domain. Moreover, since the SWT is redundant, the noise coefficients are no longer uncorrelated and thus the threshold should be varied at each level of decomposition, as in [19]. Given that noise suppression and fusion both use the same wavelet transform, the above-described noise suppression technique is well suited to be integrated within the multifocus image fusion algorithm (Fig. 2). Accordingly each image is initially transformed in the wavelet domain and a level dependent thresholding is then applied; fusion is subsequently computed on the retained coefficients. As soon as the fusion is complete, the resulting multi-dimensional signal is transformed back using the inverse wavelet transform as well as the inverse Anscombe transform.
Figure 2.
Noise suppression-fusion. After acquisition, each image was immediately processed for noise suppression-fusion. Each image was initially transformed by the Anscombe transform and then decomposed by the stationary wavelet transform (SWT) into 5 levels. A level-dependent hard threshold was applied to cAj, cDvj, cDhj and cDdj bands, which were subsequently processed separately. To cA, the inverse SWT (ISWT) was applied and the images fused using a weighted average (approximation image). This fusion was then stored temporarily for further processing whilst a new image was being acquired. cDhj, cDvj, and cDdj were fused using a maximum absolute value selection rule. When the last image was being processed, cDhj, cDvj, and cDdj bands were then transformed using the ISWT to obtain detail information. Approximation and detail images were subsequently combined. Finally, the inverse Anscombe transform was applied to the data in order to obtain the final noise suppressed all-in-focus image.
Since the forward Anscombe transformation is nonlinear, the implementation of a direct algebraic inversion generally leads to a biased estimate. If an exact unbiased inverse is applied, however, the occurrence of this phenomenon is drastically reduced, especially under low SNR conditions. In our analysis, we used a closed-form approximation [20] of the exact unbiased inverse of the Anscombe variance-stabilizing transformation [21]:
| (14) |
where D is the pixel value of the reconstructed image prior to inversion of the Anscombe transformation, and Ic(D) is the value obtained using the approximated closed-form formula for the exact inversion of the Anscombe transformation.
Upon acquisition, each image was immediately processed for noise suppression and fusion. The noise suppression algorithm, which was applied in both real time and postacquisition data, is summarized in the following steps: 1) The Anscombe transform is first applied to the data. 2) The sum modified Laplacian SML is then calculated and used to process the approximation part of the wavelet decomposition. 3) A 5-level SWT is applied. 4) Noise suppression (shrinkage) is applied to the wavelet coefficients, using level-dependent hard thresholding. 5) The resulting approximation and detail coefficients then undergo separate processing before subsequent fusion. Inverse transform of approximate coefficients (approximation image) is fused using a modified SML obtained by filtering the SML image with a 3×3 median filter and then convolving with a Gaussian window filter (using a standard deviation of 0.75). The modified SML provides information on areas of the image likely in focus; here, the median filter acts to eliminate isolated points and reduces artifacts resulting from “hot” and “cold” pixels in the CCD camera. In contrast to the approximation coefficients, detail SWT coefficients are fused in the wavelet domain using the “maximum absolute value” selection rule. When processed in real time, these two components can be stored while waiting for the next image update; meanwhile, a temporary version of the final image can be provided to the user. The reconstruction then consists of two additional steps: calculation of the inverse SWT for detail coefficients, and fusion with the approximation image. The final fused image is then obtained by applying a closed-form approximation of the exact unbiased inverse of the Anscombe transformation.
3. Results and Discussion
The reconstruction algorithm was initially tested on two phantoms designed to mimic white light and fluorescence modes. Both phantoms were mounted on a flat glass plate on a horizontal platform. The plate was then tilted along one of its horizontal axes such that, due to limited depth of focus, only one part of the imaged phantom appeared in the focal plane of the imaging system. Stacks of blurred images were then acquired by moving the horizontal platform along the vertical direction in steps of approximately 50 microns. This was necessary in order to compare images reconstructed using the fusion algorithm with images obtained from the phantoms laying on the horizontal plane. In order to do this, a stretching factor had to be applied to the final image, along the tilting direction, with a factor equal to k = 1/tan(α), where α is the angle of the tilted plate on the horizontal platform.
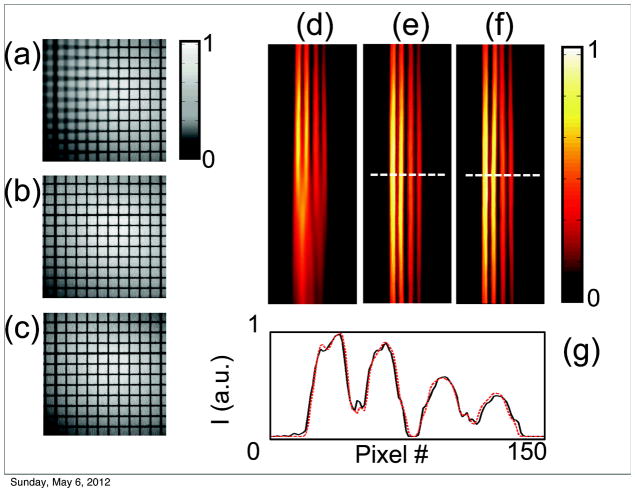
The first phantom consisted of a black and white grid printed on paper and illuminated with white light (Fig. 3a–c). This pattern was chosen for its sharp edges and flat areas, which result in high and low frequencies respectively. As shown in Fig. 3a–c, the proposed algorithm performed well, preserving both frequency components of the image as well as scaling factors.
Figure 3.
(a–c) Phantom grid reconstruction in white light mode. A flat black and white grid was tilted along one horizontal axis to produce images with only part of the grid in focus. (a) A single frame from a stack of partial in focus images. (b) An image reconstruction of all the in focus components obtained from the stack of images in (a). The same grid with no tilt was used as a reference (c). To correctly compare the processed image (b) to the reference (c), a stretching factor, perpendicular to the tilting axis, was applied. (d–g) Phantom tubes in fluorescent mode. (d) A single image from a stack of fluorescent images. As for the grid, the tubes were tilted along one horizontal axis to provide out of focus components. (e) The reconstructed fused image. (f) A reference image acquired with zero tilting. (g) A signal profile along one line to compare the fluorescent distribution of the reconstructed and reference image.
Fluorescence data fusion (Fig. 3d–f) was then tested on a second phantom, which consisted of several capillary tubes filled with a fluorescent dye (Cy7.5). The same imaging procedure was then followed as for the black and white grid. As before, a stretching correction was applied to provide appropriate scaling. To demonstrate that relative fluorescence signal counts are preserved for both images, the tubes were filled with variable concentrations of dye. Fusion reconstructions showed good agreement with the original flat image. Moreover, a comparison between cross sections taken at the same point in both the original and reconstructed fused images indicated that the relative fluorescence signal is well preserved in the fused reconstructed images.
After verifying that the algorithm preserves geometric features, high and low signal frequencies, and relative intensity signals, we subsequently applied it to small animal imaging.
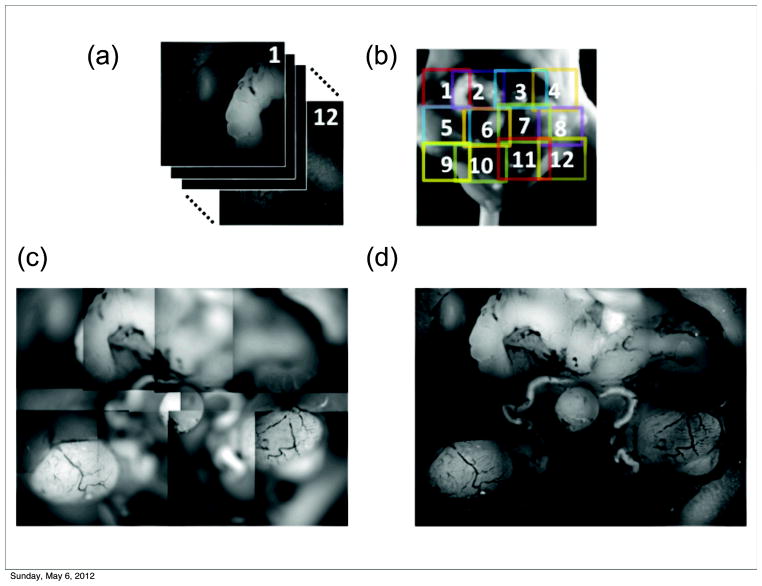
The upper panel of Fig. 4 shows ex vivo autofluorescence images of the lower portion of the mouse abdominal cavity, primarily focused on the male urogenital system. The wavelength of the excitation light was 488 nm, and emission light was collected with a bandpass filter at 540 nm. Normally, the trade-off between the size of the field of view and image resolution prevents the possibility of acquiring images of larger areas at high resolution. In order to overcome this limitation, we acquired 12 stacks of partially-in-focus images positioned at different points with a certain degree of overlap, and stitched their reconstructions together with a post-processing technique to obtain the final image. The final image is therefore the result of two processing techniques: the fusion of a single image stack by the proposed algorithm (leading to all in focus tile images), followed by the application of a tile stitching algorithm similar to that commonly used to build panoramic images in photography. Fig. 4d shows the entire mouse abdominal area in focus, where the major organs of the reproductive tract can be clearly visualized at high resolution, including the seminal vesicles (top), ductus deferens surrounding the bladder (center), and testes (bottom).
Figure 4.
In focus reconstructions of mouse organs. (a–b). A fused reconstruction of the male urogenital system in the mouse in fluorescence mode (Ex. 475/30, Em. 530/40). (c) Tiling of partially out-of-focus images. (d) Reconstructed images were fused together by stitching. The field of view for the single image could thus be extended without sacrificing resolution, which is limited by the sensor matrix.
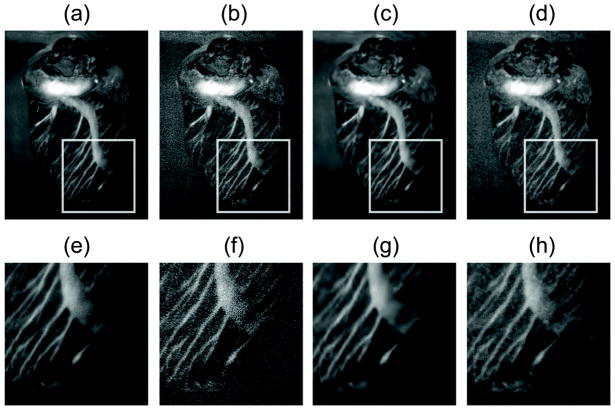
Fig. 5 shows the in-focus reconstruction of the heart vasculature of a mouse injected with a fluorescent dye (Rhodamine dextran). The probe was injected in vivo via tail vein. After one minute, the animal was euthanized, and the heart ligated so as to keep the vessels filled with the dye; the heart was then explanted and imaged. As shown in Fig. 5a–e, the heart was very well reconstructed despite its high curvature, and full in-focus images could be obtained.
Figure 5.
Reconstructions at high and low SNR. (a, e) Reconstruction of the high SNR image; (b, f) Reconstruction of the low SNR image without shot noise suppression; (c, g) Reconstruction of the low SNR image after applying the proposed algorithm; (d–h) Reconstruction of the low SNR image with a median filter for noise suppression.
The same sample was then used to demonstrate that our algorithm performs well in the presence of noise, a situation that typically arises when short integration times are used or when low fluorescence signal is present. To demonstrate this important aspect of our reconstruction modality, we used low SNR fluorescence images from the same dataset as above and directly compared them with a reference high SNR image. In Fig. 5, we show reconstructed fused images starting from a low SNR dataset using the fusion algorithm, both with (Fig. 5c,g) and without (Fig. 5b,f) noise suppression filtering. A comparison with the fused reconstructed images, obtained using a high SNR dataset, clearly demonstrated that our method is far superior to a conventional fusion approach, even when the final image is filtered using a common median filter (Fig. 5d,h).
Finally, we used the proposed method for in vivo tumor detection since this would be an attractive feature for intraoperative surgery. In order to evaluate this capability, LS174T cancer cells were implanted into a mouse and allowed to grow for 14 days. A fluorescent monoclonal antibody targeting the colon cancer associated antigen A33 [22,23] was then injected, which localized to the tumor over 2 days (Fig. 6). During surgical separation of the main tumor from the surrounding tissue, several regions of residual cells were apparent in the margins. As shown in Fig. 6d, f, the small lesions are clearly visible in the all-in-focus images. In the out-of-focus images, they are not distinguishable even when zoomed in (Fig. 6c, e). Segmentation of the residual cells with size quantification could be obtained using a Sobel filter and threshold adjustment in combination with a morphological filter. This could be useful for standardizing or quantifying resected tissue.
Figure 6.
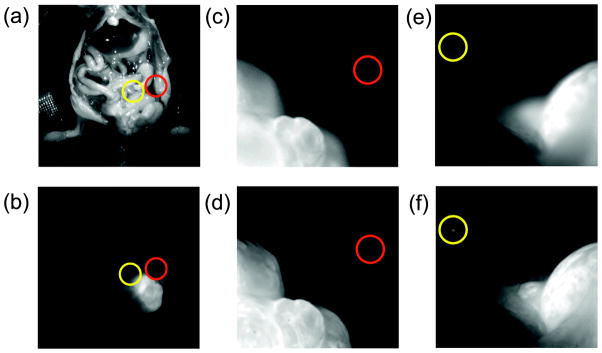
Fluorescent all-in-focus imaging for intravital surgery. During intraoperative surgery, the use of all-in-focus imaging in fluorescent mode, would enable the detection of extended tumors and small lesions within tissue margins (d,f). Panel (c,e) demonstrates the impossibility of identifying small lesions or metastases when the images are not in focus. If small tumoral masses lie at different depths, scanning along the axis of the microscope lens is necessary for accurate detection. Panels (a–b) show the location of the tumors within the mouse in white light and fluorescent mode respectively
4. Conclusion
In conclusion, we have developed a fluorescence imaging system for intraoperative surgery that consists of a numerical algorithm for noise suppression and multifocus image fusion that is compatible with both white light and fluorescence reflectance imaging.
The method is particularly suited under sub-optimal conditions, i.e. in low SNR, a situation that typically arises when imaging in vivo or in conditions where the fluorescence signal intensity is low. We have demonstrated its use for both ex vivo and in vivo applications as well as its ability to highlight tumor margins and metastases in mice. While here we have implemented a multi-level SWT, other wavelet based image fusion techniques such as the one described in [9] could be adopted when used in combination with a noise suppression processing scheme. The proposed fusion algorithm could potentially have a wide range of applications, the most significant being its likely clinical utility for intraoperative surgery. Finally, in order to facilitate its wider use in the community, we have implemented the algorithm as a plug-in for Osirix [24], an open source image software widely used in the clinical and biomedical community (http://csb.mgh.harvard.edu/bic/downloads). In its Osirix implementation the plug-in works in post-processing mode and importance was placed on ease of use. With the number of decomposition levels set to 5 and automatic estimation of noise, no parameter adjustment or estimation is required by the user.
Acknowledgments
This project was funded in part by funds from grants Nr. T32CA79443-11, 2P50CA086355-12, 2RO1EB006432, 2U24CA092782.
Biographies
Paolo Fumene Feruglio is Visiting Research Fellow at the Center for Systems Biology, Harvard Medical School and Res. Assist. at the University of Verona. He graduated in Electrical Engineering at the University of Padova and received his Ph.D in Multimodal Imaging in Biomedicine at the University of Verona. His research involves the developing of models and algorithms to process and analyze data with application to in-vivo and ex-vivo molecular imaging techniques at macro and microscopic level.
Claudio Vinegoni is currently Asst. Professor at Harvard Medical School, and works at Center for Systems Biology at Massachusetts General Hospital (MGH). He has published over 70 original publications in peer reviewed journals. His research activity involves the development of novel optical imaging instruments and techniques with applications in the clinical and biomedical arena.
Andrea Sbarbati is Full Professor of Human Anatomy at the Faculty of Medicine at the University of Verona. He is an expert in imaging methods applied to preclinical problems, in particular on animal models of disease. He has experience in the techniques of ultrastructural investigation, X-ray microanalysis, energy loss electron spectroscopic imaging, magnetic resonance spectroscopy and optical imaging.
Lioubov Fexon is a software developer at the Center for Systems Biology, Massachusetts General Hospital. MS in Applied Mathematics, graduated from Samara Aerospace University. Implementation of image processing algorithms on different platforms, GPU-related techniques, DICOM processing.

Dr. Weissleder is a Professor at Harvard Medical School, Director of the Center for Systems Biology at Massachusetts General Hospital (MGH), and Attending Clinician (Interventional Radiology) at MGH. Dr. Weissleder is also a member of the Dana Farber Harvard Cancer Center, an Associate Member of the Broad Institute (Chemical Biology Program) and a member of the Harvard Stem Cell Institute (HSCI) leading its Imaging Program. He has published over 500 original publications in peer reviewed journals and has authored several textbooks.
References
- 1.Bedard N, Pierce M, El-Naggar A, Anandasabapathy S, Gillenwater A, Richards-Kortum R. Technol Cancer Res Treat. 2010;9:211–217. doi: 10.1177/153303461000900210. [DOI] [PMC free article] [PubMed] [Google Scholar]
- 2.Frangioni JV. Curr Opin Chem Biol. 2003;7:626–634. doi: 10.1016/j.cbpa.2003.08.007. [DOI] [PubMed] [Google Scholar]
- 3.van Dam GM, Themelis G, Crane LMA, Harlaar NJ, Pleijhuis RG, Kelder W, Sarantopoulos A, de Jong JS, Arts HJG, van der Zee AGJ, Bart J, Low PS, Ntziachristos V. Nat Med. 2011;17:1315–1319. doi: 10.1038/nm.2472. [DOI] [PubMed] [Google Scholar]
- 4.Driggers RG. Encyclopedia Optical Engineering. CRC Press; 2003. p. 1068. [Google Scholar]
- 5.Adelson EH, Anderson CH, Bergen JR, Burt PJJ, Ogden M. RCA Engineer. 1984;29:33–41. [Google Scholar]
- 6.Le L, Jing Yang Jie L. Proceedings of the 9th International Conference on Electronic Measurement & In-struments; Beijing, China. 16–19 August 2009; pp. 4-417–4-421. [Google Scholar]
- 7.Song Y, Li M, Li Q, Sun L. Proceedings of the International Conference on Robotics and Biomimetics; Kunming, China. 17–20 December 2006; pp. 401–405. [Google Scholar]
- 8.Hariharan H, Koschan A, Abidi M. Proceedings of the IEEE Conference on Computer Vision and Pattern Recognition; Minneapolis, Minnesota, USA. 17–22 June 2007; pp. 1–6. [DOI] [PMC free article] [PubMed] [Google Scholar]
- 9.Forster B, Van De Ville D, Berent J, Sage D, Unser M. Microsc Res Tech. 2004;65:33–42. doi: 10.1002/jemt.20092. [DOI] [PubMed] [Google Scholar]
- 10.Shah P, Merchant SN, Desai UB. Proceedings of the IEEE International Conference on Multimedia and Expo; Barcelona, Spain. 11–15 July 2011; pp. 1–6. [Google Scholar]
- 11.Chipman LJ, Orr TM, Lewis LN. Proceeding of Conference on Image Processing; Washington D.C. 1995. pp. 248–251. [Google Scholar]
- 12.Yang J, Ma Y, Yao W, Lu WT. Proceedings of the 21st Congress of the International Society for Photo-grammetry and Remote Sensing; China, Beijing. 3–11 July 2008; pp. 1147–1150. [Google Scholar]
- 13.Pesquet JC, Krim H, Carfantan H. IEEE Trans Signal Process. 1996;44:1964–1970. [Google Scholar]
- 14.Nayar SK, Nakagawa Y. IEEE Trans Pattern Anal Mach Intell. 1994;16:824–831. [Google Scholar]
- 15.Wang XH, Istepanian RSH, Song YH. IEEE Trans Nanobioscience. 2003;2:184–189. doi: 10.1109/tnb.2003.816225. [DOI] [PubMed] [Google Scholar]
- 16.Faraji H. IEEE Trans Image Process. 2006;15:2676–2685. doi: 10.1109/tip.2006.877363. [DOI] [PubMed] [Google Scholar]
- 17.Luisier F, Vonesch C, Blu T, Unser M. Signal Processing. 2010;90:415–427. [Google Scholar]
- 18.Anscombe FJ. Biometrika. 1948;35:246–254. [Google Scholar]
- 19.Robert J, Tuntrakool S, Appalsamy M, Keller NR, Robertson D, Shiavi RG, Diedrich A. IEEE Trans Biomed Eng. 2007;54:82–93. doi: 10.1109/TBME.2006.883830. [DOI] [PMC free article] [PubMed] [Google Scholar]
- 20.Mäkitalo M, Foi A. IEEE Trans Image Process. 2011;20:2697–2698. doi: 10.1109/TIP.2011.2121085. [DOI] [PubMed] [Google Scholar]
- 21.Mäkitalo M, Foi A. IEEE Trans Image Process. 2011;20:99–109. doi: 10.1109/TIP.2010.2056693. [DOI] [PubMed] [Google Scholar]
- 22.Ackerman ME, Chalouni C, Schmidt MM, Raman VV, Ritter G, Old LJ, Mellman I, Wittrup KD. Cancer Immunol Immunother. 2008;57:1017–1027. doi: 10.1007/s00262-007-0433-x. [DOI] [PMC free article] [PubMed] [Google Scholar]
- 23.Scott AM, Lee FT, Jones R, Hopkins W, Mac Gregor D, Cebon JS, Hannah A, Chong G, Papenfuss PUA, Rigopoulos A, Sturrock S, Murphy R, Wirth V, Murone C, Smyth FE, Knight S, Welt S, Ritter G, Richards E, Nice EC, Burgess AW, Old LJ. Clin Cancer Res. 2005;11:4810–4817. doi: 10.1158/1078-0432.CCR-04-2329. [DOI] [PubMed] [Google Scholar]
- 24.Rosset A, Spadola L, Ratib O. J Digital Imag. 2004;17:205–216. doi: 10.1007/s10278-004-1014-6. [DOI] [PMC free article] [PubMed] [Google Scholar]


