Many cancers exhibit deregulated activity of protein kinase enzymes, but not all are sensitive to inhibitor drugs, largely because phosphorylation dynamics in complex tissues are not well understood.[1] Live, subcellular analysis can reveal the details of kinase signaling in mixed populations of cells.[2] Current tools to image kinase activity in situ depend on intensity-based measurements (such as fluorescence and Förster resonance energy transfer) that can be limited by spectral bleed-through and photobleaching.[3] We report a cell-penetrating peptide biosensor for dynamic monitoring of phosphorylation by Abl kinase based on fluorescence lifetime imaging microscopy (FLIM).[4] FLIM, which is not confounded by photobleaching or cellular autofluorescence, was applied to detect phosphorylation-dependent fluorophore lifetime shifts (1–2 ns) in intact, living cells (Fig. 1). We established the dependence of the fluorophore lifetime shift on phosphorylation specifically by Abl kinase, mapped the fluorophore intensity and lifetime components to quantify subcellular phosphorylation, and monitored kinase inhibition in real time. This approach should be generalizable to other kinases and provides a new method for interrogating real-time, subcellular signaling activities in cell populations that are not amenable to expression of genetically engineered biosensor proteins.
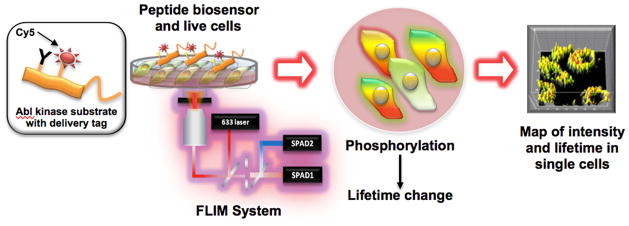
Figure 1. FLIM to detect phosphorylation-dependent fluorophore lifetime shifts for biosensors in intact, live cells.

A fluorophore labeled peptide substrate is delivered to live cells via a cell-penetrating peptide. Phosphorylation of the substrate results in observation of increased fluorophore lifetime via FLIM.
Measuring subcellular kinase activity in living cells remains a major challenge. Genetically encoded Förster resonance energy transfer (FRET) biosensors can be used for this purpose in simple cell-based assays and basic research applications.[3, 5] These sensors take advantage of binding between phosphorylated sequences and phosphopeptide binding domains to bring two fluorescent proteins close enough for energy transfer to occur. However, expressing genetically engineered proteins in cells has challenges, including a) uniform transfection and expression of protein fluorophores (a roadblock for applications in primary patient-derived cells or tissues) and b) the large labels which can affect substrate function and interaction with a kinase.[5–6] Small molecule fluorophores are able in principle to be less disruptive to function, and many are available for which excitation and emission do not overlap with expressible fluorophores (enabling multiplexed co-localization experiments).[7] These have been applied to detect phosphorylation in cells via fluorescence intensity increases.[8]
Low signal to noise is a limitation of FRET, and intensity-based fluorescence is confounded by photobleaching when experiments are conducted over long time periods, making it difficult to interpret subcellular fluctuations at high spatial and temporal resolution.[6] FLIM is not affected by photobleaching or intensity and has the potential for single molecule monitoring.[4, 9] Also, time-correlated single photon counting FLIM is capable of highly resolved discrimination between species exhibiting very small differences in lifetimes (even sub-nanosecond), facilitating the mapping of exquisite detail in subcellular images. Here we describe the first demonstration of a FLIM-based phosphorylation biosensor technology that has the potential to circumvent key technological gaps as a new strategy for studying intracellular signaling biology.
We combined the delivery of organic fluorophore-tagged kinase substrate peptide probes with time-resolved FLIM to visualize the details of kinase activity in live, intact cells (Fig. 1). The biosensor consists of an Abl substrate peptide containing the “Abltide” substrate sequence[10] tagged with a Cy5 fluorophore and a cell penetrating peptide (Abl-TAT: GGEAIYAAPCCy5GGRKKRRQRRRPQ) (Fig. 2).[11] The substrate portion (bold) is relatively selective for the c-Abl kinase (Abl1) over other tyrosine kinases, however it is phosphorylated by the Abl family member named Abl-related gene (Arg, also known as Abl2).[12] Abl1 and Abl2 are highly homologous and share many functions in normal cells.[13] In this work, “Abl kinase” denotes both Abl1 and Abl2. We used FLIM instrumentation with picosecond pulsing lasers[9a, 9b] to measure Cy5 lifetime for the unphosphorylated biosensor and a phosphorylated derivative in solution and in live cells.
Figure 2. Peptide-based Abl kinase biosensor.

The biosensor contains an Abl substrate sequence linked to the TAT peptide for cellular delivery. A Y→;F mutated analog was used to test for tyrosine phosphorylation dependence; a synthetically phosphorylated derivative was used as a positive control.
In solution, lifetime differences between the phosphorylated and unphosphorylated Abl-TAT peptide species were not significant (see supporting information, Fig. S1a), indicating that phosphorylation alone is not sufficient to elicit a change in the rate of fluorescence signal decay for the Abl-TAT peptide sensor. However, in the presence of c-Abl kinase at 1:1 ratio, robust lifetime differences were observed, and this phenomenon was blocked by pre-incubation of the kinase with higher ratios of unlabelled phosphopeptide (Fig. S1b). This effect likely arises from the more drastic change in the local environment of the fluorophore that could occur upon binding of the phosphopeptide with the protein, probably through the kinase SH2 domain.[14]
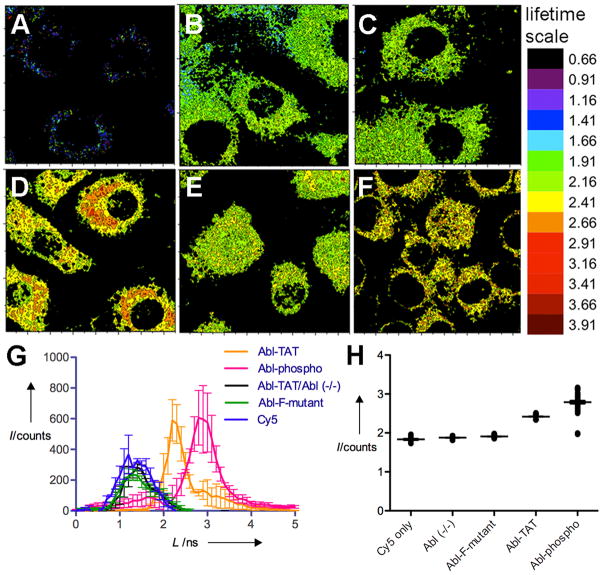
Since the physiochemical basis for the lifetime shift was still somewhat unknown, standards were established in NIH3T3 immortalized mouse embryonic fibroblast cells (MEFs)[15] to assess phosphorylation- and Abl kinase-dependence of the lifetime shifts by using three key negative controls (which exhibited lower lifetimes in cells): Cy5 alone, a non-phosphorylatable Y→F peptide sensor analog (Abl-F-mutant) (both in control MEFs expressing Abl kinase) and the Abl-TAT biosensor in Abl(−/−) knockout cells[15] (Fig. 3B, C and E and Fig. S2). Average lifetimes per cell for multiple cells were calculated and plotted to show the distribution of lifetimes observed for the biosensor and each control (Fig. 3G). The distributions were determined to be non-Gaussian, so non-parametric ANOVA with a Dunn’s post-test (described in the Methods section) was used to evaluate statistical significance (P<0.05) for differences in the mean lifetimes. There was no significant difference between the Cy5, Abl(−/−) or Abl-F-mutant experiments, however each of these controls exhibited significantly lower mean lifetimes than both Abl-TAT (in MEFs expressing Abl kinase) and Abl-phospho (positive control). The mean lifetime for Abl-phospho was also significantly longer than that of Abl-TAT, consistent with enrichment of the phosphorylated form of the substrate. These experiments confirmed that the increase in Cy5 lifetime was specific and due to Abl dependent phosphorylation of the biosensor peptide on tyrosine. As another control to support the interpretation of phosphorylation dependence for lifetime increases in cells, we used immunocytochemistry to show colocalization between the Abl-TAT biosensor and phosphotyrosine (see supporting information, Fig. S3).
Figure 3. FLIM mapping of biosensor phosphorylation.
WT MEF cells (unless otherwise indicated) were cultured on cover slips and incubated with the biosensor peptide or a control (as indicated, 50 nM for each) for 24 h, then imaged using the FLIM system. Data were extracted from raw FLIM images and represented as lifetime maps A–F: (A) autofluorescence, (B) Cy5 only, (C) Abl-TAT in Abl (−/−) MEFs, (D) Abl-TAT in WT MEFs, (E) Abl-F-mutant, (F) Abl-phospho. Full color scale for the lifetime range is shown at right. Raw FLIM images and lifetime color maps with intensity indicated on the z-axis are shown in Figure S2. (G) Fluorophore lifetime per cell was averaged for at least 20 cells in 3–5 replicate experiments and is plotted as a distribution of lifetimes observed in each condition. Error bars represent standard error of the mean for each lifetime value. H) Aligned scatter plots of lifetimes for pixels in selected regions of interest (ROIs) within similar subcellular locations for cells represented in G. I = intensity, L = lifetime. Error bars represent SEM.
We tested sequestration of the biosensor in endosomes by staining for an endosomal marker. Minimal, non-exclusive colocalization of the biosensor with endosomes was observed, indicating that the biosensor peptide was not sequestered (Fig. S3). We also examined peptide degradation, a potential issue in some cell types[16] but not all, as demonstrated from our prior work.[11a] Controls using fluorescence correlation spectroscopy (FCS) measured Cy5 alone vs. the Abl-TAT biosensor in MEFs (supporting information, Figure S4), providing evidence that for MEFs, the signal observed for the Abl-TAT biosensor arose from peptide that was not degraded to free Cy5.[17]
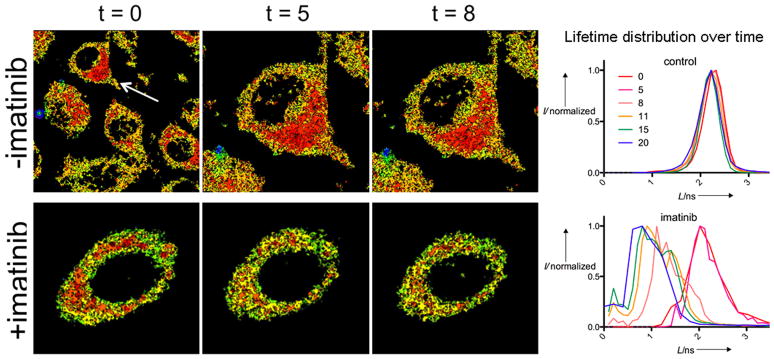
To quantitatively address the distribution and level of biosensor phosphorylation in different subcellular regions we separated the intensity and lifetime components of the signal arising from the FLIM measurements and plotted lifetime values in 2D using MatLab (as shown in Fig. 3A–F). We did not observe phosphorylation-dependent intensity increases for this biosensor either in solution or in cells (Fig. S2A) (in contrast to what has been observed by others).[8a, 18] We then used the Abl-TAT biosensor to image Abl kinase inhibition with the kinase inhibitor imatinib in control MEFs (Fig. 4). MEFs stably expressing a nuclear-enriched Abl kinase mutant, FKBP-Abl(NUK),[15] were also analysed in the presence of imatinib (see time lapse movie shown in Fig. S5). Over the course of 70 min we detected a general trend towards decreased lifetime overall (e.g. Fig. 4 and Fig. S5) and negative lifetime shifts in multiple areas of the cell within the first few minutes of incubation (Fig. S6), consistent with kinase inhibition and dephosphorylation of the biosensor by phosphatase enzymes (previously observed[11a]). In the absence of imatinib, biosensor lifetime was dynamic but overall no significant decrease in lifetime was observed (Fig. 4).
Figure 4. Subcellular Abl inhibition by imatinib.

MEFs were treated with the biosensor and imaged before (t = 0) or after (t = 5, 8 min) adding the Abl inhibitor imatinib. Arrow shows selected control cell (top panels). B) Plot of lifetime distribution for cells shown as well as longer timepoints (0–20 min). Additional timepoint images, and plots for several subcellular ROIs for multiple cells, are shown in the supporting information.
These experiments demonstrate that fluorescence lifetime shifts measured for the cell-deliverable kinase biosensor are phosphorylation-dependent, yielding dynamic information about the localization of kinase (and potentially phosphatase) activity in single living cells. This could make it possible to examine heterogeneous mixtures of cells to dissect subsets of signaling phenotypes and responses to inhibitors. This approach should also be generalizable to other kinase substrates and fluorophores, enabling the future possibility of analyzing more than one kinase-targeted FLIM biosensor at a time. Currently, we are developing other kinase substrate biosensors (e.g. for the Syk kinase[19]) to expand the application of this strategy and achieve simultaneous detection of multiple kinase activities in situ.
Experimental Section
Cell culture
Control (vector only), FKBP-Abl(NUK) and Abl (−/−) immortalized mouse embryonic fibroblast (MEF) cell lines[15] were a kind gift from Prof. Jean Y. Wang (University of California-San Diego). Cells were maintained in Dulbecco’s modified Eagle medium (DMEM) supplemented with 1% penicillin/streptomycin and 10% Fetal Bovine Serum (Atlanta Biologicals, Inc.).
Peptide synthesis
Peptides were prepared to >90% purity using Fmoc solid phase peptide synthesis as previously described, and labelled with Cy5-maleimide (Lumiprobe, Inc., Hallendale Beach, FL, USA) as described in the supporting information.[11a] Characterization details for labelled material are provided in the supporting information.
FLIM experiments
Imaging was performed using scanning confocal time resolved microscopy (Microtime 200 from Picoquant GmbH, Berlin, Germany).[20] A 633 nm 20 MHz picosecond pulse laser source was used for excitation and emission was separated from the excitation beam by a dual band dichroic (z467/638rpc, Chroma) and collected through an apochromatic 60X, 1.2 NA water immersion objective. A 50 μm pinhole was used to reject off-focus photons from the excitation volume, and the overall fluorescence was collected and separated accordingly using a dichroic beam splitter (600 cxr, AHF, Chroma) and filtered by emission filters (670±10 nm) before being detected by two single photon avalanche photodiodes (SPAD) (SPCM-AQR, PerkinElmer Inc.). Fluorescence was measured using the time-correlated single photon counting (TCSPC) time-tagged time-resolved (TTTR) mode (Time Harp200, PicoQuant). Fluorescence lifetime was calculated by fitting TCSPC histograms for each pixel (150x150 pixels total) with a multiexponential model until no pattern of residual is observed (for example see supporting information Figure S7). The 150x150 pixel lifetime images were then converted into a matrix form and exported to MATLAB R2011b. The data in the matrices were separated and classified into lifetime and intensity images for visualization and analysis. Notably, images with higher lifetime but lower intensity thresholds are not easily interpreted using conventional FLIM data, thus this extraction process enables quantitative analysis.
After this conversion, the intensity components for each experiment were compared to those of a baseline control (autofluorescence from the cells) to remove background. Autofluorescence for 3T3 cells ranged from 50–100 intensity counts and this value was used as a threshold to remove components from the lifetime image with intensity counts under 80 to minimize contribution to the signal from autofluorescence. After this background removal the 2D images were reconstructed using MATLAB and Image J v. 1.42. Regions of interest (ROIs) comprising an area equivalent to 5x5–10x10 pixels were chosen for the same general subcellular compartment for different cells (see supporting information Figure S8 for example). At least 20 (20–80) different fitted points in each cell from at least 3 cells per view were used, and the data were combined for 3–5 replicate experiments to construct the fitted data comparison shown in Fig. 3G and H in conjunction with representative images (Fig. 3A–F and Fig. S2A).
Biosensor lifetime analyses
For in cell analysis, MEFs were plated on cover slips in 12-well plates at 70% confluency and allowed to recover for 24 h. Wells were washed gently with PBS (3 × 1 ml) and treated with probe or controls (Abl-TAT, Abl-phospho, Abl-F-mutant, Cy5 alone) (50 nM) in DMEM with FBS for 24 h. Cover slips were washed with PBS and imaged immediately. For imatinib experiments, images were taken before the addition of imatinib to the buffer in which the cover slips were incubated followed by time lapse imaging after addition of imatinib. Control experiments were conducted without imatinib to evaluate the potential for and effect of photobleaching over the experimental time.
Supplementary Material
Acknowledgments
We acknowledge financial support from the National Institutes of Health (R00CA127161 to L.L.P.) and grants from the Purdue Center for Cancer Research and Indiana Clinical and Translational Sciences Institute (NIH/NCRR TR000006) to J.M.K.I.
Footnotes
Supporting information for this article is available on the WWW under http://www.angewandte.org or from the author.
Contributor Information
Prof. Laurie L. Parker, Email: llparker@purdue.edu.
Prof. Joseph M. K. Irudayaraj, Email: josephi@purdue.edu.
References
- 1.Zhang L, Daly RJ. Crit Rev Oncog. 2012;17:233–246. doi: 10.1615/critrevoncog.v17.i2.70. [DOI] [PubMed] [Google Scholar]
- 2.a Zheng XT, Li CM. Chem Soc Rev. 2012;41:2061–2071. doi: 10.1039/c1cs15265c. [DOI] [PubMed] [Google Scholar]; b Cabarcas SM, Mathews LA, Farrar WL. Int J Cancer. 2011;129:2315–2327. doi: 10.1002/ijc.26312. [DOI] [PMC free article] [PubMed] [Google Scholar]
- 3.Gao X, Zhang J. Chembiochem. 2010;11:147–151. doi: 10.1002/cbic.200900594. [DOI] [PubMed] [Google Scholar]
- 4.Levitt JA, Matthews DR, Ameer-Beg SM, Suhling K. Curr Opin Biotechnol. 2009;20:28–36. doi: 10.1016/j.copbio.2009.01.004. [DOI] [PubMed] [Google Scholar]
- 5.Zhang J, Allen MD. Mol Biosyst. 2007;3:759–765. doi: 10.1039/b706628g. [DOI] [PubMed] [Google Scholar]
- 6.Ni Q, Zhang J. Adv Biochem Eng Biotechnol. 2010;119:79–97. doi: 10.1007/10_2008_48. [DOI] [PubMed] [Google Scholar]
- 7.Wysocki LM, Lavis LD. Curr Opin Chem Biol. 2011;15:752–759. doi: 10.1016/j.cbpa.2011.10.013. [DOI] [PubMed] [Google Scholar]
- 8.a Yeh RH, Yan X, Cammer M, Bresnick AR, Lawrence DS. J Biol Chem. 2002;277:11527–11532. doi: 10.1074/jbc.M111300200. [DOI] [PubMed] [Google Scholar]; b Dai Z, Dulyaninova NG, Kumar S, Bresnick AR, Lawrence DS. Chem Biol. 2007;14:1254–1260. doi: 10.1016/j.chembiol.2007.10.007. [DOI] [PMC free article] [PubMed] [Google Scholar]
- 9.a Chen J, Irudayaraj J. Anal Chem. 2010;82:6415–6421. doi: 10.1021/ac101236t. [DOI] [PubMed] [Google Scholar]; b Chen J, Miller A, Kirchmaier AL, Irudayaraj JM. J Cell Sci. 2012;125:2954–2964. doi: 10.1242/jcs.101592. [DOI] [PMC free article] [PubMed] [Google Scholar]; c Vidi PA, Chen J, Irudayaraj JM, Watts VJ. FEBS Lett. 2008;582:3985–3990. doi: 10.1016/j.febslet.2008.09.062. [DOI] [PubMed] [Google Scholar]
- 10.Songyang Z, Carraway KL, Eck MJ, Harrison SC, Feldman RA, Mohammadi M, Schlessinger J, Hubbard SR, Smith DP, Eng C, Lorenzo MJ, Ponder BAJ, Mayer BJ, Cantley LC. Nature. 1995;373:536–539. doi: 10.1038/373536a0. [DOI] [PubMed] [Google Scholar]
- 11.a Placzek EA, Plebanek MP, Lipchik AM, Kidd SR, Parker LL. Anal Biochem. 2010;397:73–78. doi: 10.1016/j.ab.2009.09.048. [DOI] [PMC free article] [PubMed] [Google Scholar]; b Soughayer JS, Wang Y, Li H, Cheung SH, Rossi FM, Stanbridge EJ, Sims CE, Allbritton NL. Biochemistry. 2004;43:8528–8540. doi: 10.1021/bi036296d. [DOI] [PubMed] [Google Scholar]
- 12.Wu D, Sylvester JE, Parker LL, Zhou G, Kron SJ. Biopolymers. 2010;94:475–486. doi: 10.1002/bip.21401. [DOI] [PMC free article] [PubMed] [Google Scholar]
- 13.Colicelli J. Sci Signal. 2010;3:re6. doi: 10.1126/scisignal.3139re6. [DOI] [PMC free article] [PubMed] [Google Scholar]
- 14.Liao X, Su J, Mrksich M. Chemistry. 2009;15:12303–12309. doi: 10.1002/chem.200901345. [DOI] [PMC free article] [PubMed] [Google Scholar]
- 15.Jin H, Wang JY. Mol Biol Cell. 2007;18:4143–4154. doi: 10.1091/mbc.E07-01-0085. [DOI] [PMC free article] [PubMed] [Google Scholar]
- 16.Proctor A, Wang Q, Lawrence DS, Allbritton NL. Analyst. 2012;137:3028–3038. doi: 10.1039/c2an16162a. [DOI] [PMC free article] [PubMed] [Google Scholar]
- 17.Ruttekolk IR, Verdurmen WP, Chung YD, Brock R. Methods Mol Biol. 2011;683:69–80. doi: 10.1007/978-1-60761-919-2_6. [DOI] [PubMed] [Google Scholar]
- 18.Wang Q, Zimmerman EI, Toutchkine A, Martin TD, Graves LM, Lawrence DS. ACS Chem Biol. 2010;5:887–895. doi: 10.1021/cb100099h. [DOI] [PMC free article] [PubMed] [Google Scholar]
- 19.Lipchik AM, Killins RL, Geahlen RL, Parker LL. Biochemistry. 2012 doi: 10.1021/bi300970h. [DOI] [PMC free article] [PubMed] [Google Scholar]
- 20.Varghese LT, Sinha RK, Irudayaraj J. Anal Chim Acta. 2008;625:103–109. doi: 10.1016/j.aca.2008.07.021. [DOI] [PubMed] [Google Scholar]
Associated Data
This section collects any data citations, data availability statements, or supplementary materials included in this article.


