Abstract
Paper spray has been developed as a fast sampling ionization method for direct analysis of raw biological and chemical samples using mass spectrometry (MS). Quantitation of therapeutic drugs in blood samples at high accuracy has also been achieved using paper spray MS without traditional sample preparation or chromatographic separation. The paper spray ionization is a process integrated with a fast extraction of the analyte from the raw sample by a solvent, the transport of the extracted analytes on the paper, and a spray ionization at the tip of the paper substrate with a high voltage applied. In this study, the influence on the analytical performance by the solvent-substrate systems and the selection of the elution methods was investigated. The protein hemoglobin could be observed from fresh blood samples on silanized paper or from dried blood spots on silica-coated paper. The on-paper separation of the chemicals during the paper spray was characterized through the analysis of a mixture of the methyl violet 2B and methylene blue. The mode of applying the spray solvent was found to have a significant impact on the separation. The results in this study led to a better understanding of the analyte elution, on-paper separation, as well as the ionization processes of the paper spray. This study also help to establish a guideline for optimizing the analytical performance of paper spray for direct analysis of target analytes using mass spectrometry.
Keywords: Mass spectrometry, paper spray ionization, on-paper separation, therapeutic drug monitoring, elution method, hemoglobin, blood analysis
INTRODUCTION
Paper is a material that is produced by pressing together moist fibers (normally composed of cellulose) and drying them into flexible sheets. Various types of papers have been made with suitable modifications for chemical separation or permeability and numerous paper-based analytical techniques have been developed. For example, in-paper size exclusion separation has been developed using filter papers [1, 2]. Paper chromatography has been well developed and applied since 1940s [3]. Paper was used as a chromatographic substrate for rapid separation and identification of pigment mixtures based on the differences in the chemical affinity [3–5]. Substantial progresses in chemical analysis have been achieved with on-paper separation methods through sophisticated derivatization of the paper substrates.[6–8] Combinations of the on-paper separation with other analytical techniques have also been wildly used, among which the mass spectrometry (MS) is a major method for the qualitative and quantitative analysis after the chemical separation [7, 9–11].
Mass spectrometry (MS) is a powerful technique for chemical identification owing to its high sensitivity and specificity. To avoid severe matrix effects in the analysis of complex mixtures, dedicated sample preparation and chromatographic separation are typically performed prior to the analysis with a mass spectrometer. Ambient ionization techniques [12] have been developed to allow fast analysis of raw samples by mass spectrometry with little or no sample preparation.[13, 14] Recently, paper spray (PS) was developed [15, 16] as an ambient ionization method and applied for quantitative analysis of blood samples. With this method, the analytes in a raw sample spot on a paper substrate are eluted by a small amount (about 10μL) of solvent to the tip of the substrate and then ionized for MS analysis with a high voltage applied on the wetted substrate. Paper serves as a good candidate material for consumable sample substrates and the dried blood spots (DBSs) on paper have been used as a standard method for storing and transferring blood samples. One recent study showed, by applying coagulant to fresh blood sample on paper substrate, fast screening of therapeutic drugs in blood could be completed in 45s using PS-MS [17]. Besides the application for analysis of dried blood spots [18–20], PS-MS has also been demonstrated for a direct and rapid analysis of other complex samples such as urine [21], tissues [16] and food stuffs [22].
Previous studies have shown that the properties of the paper substrates and the solvents for elution and ionization have significant impacts on the PS-MS analysis results, such as the signal duration, signal intensity and the ultimate sensitivity [21, 23]. In a study of the geometry of paper substrate, spray tips of smaller angles generated higher spray currents but the highest MS signal intensity for the analyte was obtained with at 90º of the tip [24]. The solvent applied for paper spray plays an important role in both analyte elution and the spray ionization processes. The amount of the solvent used for PS affects the size of the sprayed droplets [25]. By using solvents of relatively low boiling point and polarity for a silica-coated paper substrate, limits of quantitation (LOQs) for therapeutic drugs in blood were obtained at levels better than 1 ng/mL with a commercial triple quadruple and at 10–20 ng/mL with a home-built miniature ion trap mass spectrometer [23]. The methods of applying the solvent, for example, in a gradually wicking mode or a fast dumping mode, were also found to cause the differences in the the chemical elution pattern as well as the ion signal intensity [19].
In this study, we conducted a relatively thorough investigation on the impacts by the selection of the solvents, substrates and the elution methods for the paper spray. The analyte extraction, chemical transportation and separation on the paper, as well as the ionization from the substrate, were characterized for the paper spray process.
EXPERIMENTAL
Materials
Therapeutic drugs (amitriptyline and verapamil) and the organic dyes (methylene blue and methyl violet 2B) were purchased from Sigma-Aldrich (St. Louis, MO, US) and used without further treatment. The bovine whole blood with dipotassium ethylene diamine tetraacetic acid (K2EDTA) was purchased from Innovative Research (Novi, MI, US). The silanizing agent Tridecafluoro-1,1,2,2-tetrahydrooctyl) trichlorosilane (FOTS) was obtained from UCT (Bristol, PA, US). All the organic solvents and Whatman chromatography papers (grade 1) and silica coated paper were purchased from VWR Scientific (Chicago, IL, US). Printer paper (Boise X-9, Boise Inc., ID, US) was used for the substrate comparison study.[26]
Sample preparation
Unless otherwise noted, pure chemicals used in the study were prepared in 1:1 MeOH/H2O (v/v). The blood samples with drugs were prepared by dilution of stock solutions of drugs using bovine whole blood with K2EDTA. DBS were prepared by spotting 2 μL of blood sample onto paper substrates and air drying for 4 hours before the test. The silanized paper was prepared by exposing the grade 1 chromatography paper in headspace of the solution of 50:50 methanol/FOTS (v/v) for 24 hours.
Mass spectrometry and paper spray ionization
All experiments were performed using TSQ Quantum Access Max (Thermo Scientific, San Jose, CA) in full scan and SRM mode. In both modes, the MS inlet temperature was set to 300 °C. The paper substrates were prepared by cutting the paper into triangles of 8 mm at the base and 10 mm at the height. A copper clipper was used to hold the paper substrate during the paper spray with a dc voltage of 3.5 kV applied to the clipper. If not specified, 20 μL of MeOH was used as the elution and spray solvent. For the study of the substrate-solvent systems the MS spectra were obtained with an average over the entire analysis time. No background subtraction was performed.
RESULTS AND DISCUSSION
Several types of paper were used as substrates for paper spray for a comparison study in this work. The chromatography paper was used as the material for the blood card for collecting blood samples and storing them as the dried blood spot. It has been used as a main substrate material in the paper spray development due to less chemical interference[16] and compatibility to the current blood sample collection and storage protocol. The silica coated paper has been shown to have better elution efficiency for the therapeutic drugs in blood with proper solvents used for paper spray. [23] The print paper has a much smaller pore size, but has been shown to provide improved sensitivity when used for analysis of nicotine and its metabolites in wet blood samples.[27] The silanized paper was also included in the comparison study since better signals for proteins were observed due to a less binding interaction between the highly hydrophilic compounds and the celluloses with its surface hydrophobicity increased with the silanization. The wetting property of the paper substrate is affected by both the surface hydrophobicity as well as the porosity of the paper substrate. By comparing the contact angle of a 2.5 μL blood droplet with each of the substrates, the relative wetting properties of the paper materials used in this study were evaluated as silanized paper ≪ silica-coated paper < print paper< grade 1 chromatography paper.
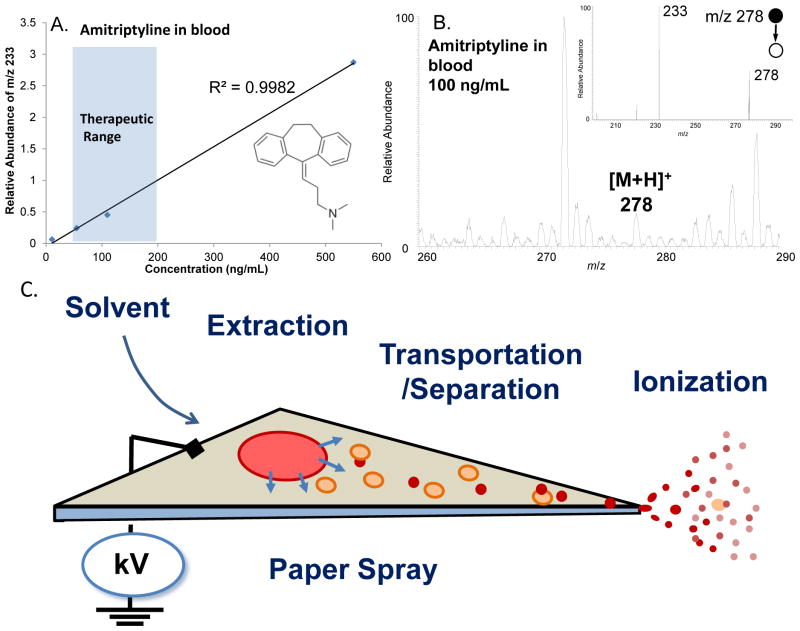
Fig. 1A and B show the PS-MS results for analysis of DBSs on paper substrates prepared with whole blood samples containing amitriptyline at concentrations from 10 to 550 ng/mL. Without any traditional sample preparation and chromatographic separation, the direct analysis of samples (each made from 2μL blood) using paper spray provided an LOD of 10 ng/mL and a linear dynamic range adequately wide for therapeutic monitoring of the amitriptyline in blood. Paper spray is a process integrated with multiple functions and steps for the chemical analysis. As a simplified model, the paper spray could be considered as a three step process, including the extraction, the transportation-separation and the ionization of the analytes in the raw sample (Fig. 1C). At the extraction step, target analytes as well as other chemical compounds in the sample matrix are extracted by the spray solvent from the sample on the substrate, such as a dried blood spot [18, 19, 23] or a biology tissue sample [16]. Differences in the extraction efficiency are expected and should be dependent on the chemical properties of the chemicals in terms of binding with the substrate and dissolving into the solvent. The chemicals extracted into the solvent are then transported toward the spray tip, driven by solvent migration along the on-paper electric field. A chromatographic separation on paper could occur during the transport due to the differences in the chemical-substrate interactions. This on-paper separation could potentially improve the sensitivity of the analysis but could also cause the loss of the analytes. This process could also be highly affected by the means of applying the solvent (to be further discussed later) [23]. When the solvent reaches the tip of the paper substrate, the electrospray occurs and the analytes contained in the solvent become ions in gas phase, which subsequently are transferred into the mass spectrometer for MS analysis. Each of the three steps could be affected by the properties of the elution-spray solvent and the substrate as well as the methods used for elution.
Fig. 1.
Analysis of therapeutic drug amitriptyline in DBS samples on grade 1 chromatography paper. (A) Calibration curve of amitriptyline, monitoring the intensity of the fragment ion m/z 233. (B) MS and MS/MS spectra of 100ng/mL amitriptyline in blood, 15 μL MeOH as elution-spray solvent. (C) Schematic of the paper spray ionization process, with three proposed steps for the process.
The solvent used for paper spray plays a role in all the three steps of analyte extraction, transportation and spray ionization. Theoretically, by altering the solvent-substrate systems, the presence of the peaks in the mass spectra would change due to the varied efficiencies for the extraction as well as the ionization for the corresponding analytes. In one experiment, 2μL blood containing 1 μg/mL verapamil was dropped on different paper substrates, including silanized, Grade 1, print, and silica-coated paper substrates, and analyzed immediately using paper spray with 20 μL MeOH without letting the sample dried (Fig. 2A–D). LODs as low as 0.1 ng/mL has been obtained for quantitation of verapamil using paper spray with MS/MS.[23] A relatively high concentration was used in this study so peaks of verapamil could be observed in MS spectra for comparison with others. The spray solution was added all in once and the spectra shown in Fig. 2 were all obtained with an average over the entire paper spray process. The peaks for protein hemoglobin could only be observed with the silanized paper, for which the hydroxyl groups on the celluloses were modified by perfluoroalkylation [28]. This resulted in a much weaker binding of the protein to the paper substrate (Fig. 2A). The peak at m/z 616 was due to the heme groups, indicating an unfolding of the hemoglobin during the paper spray process. The Grade 1, print and silica coated paper substrates are much less hydrophobic, for which peaks of lipids with much higher intensities were observed in the m/z range 700 to 900 but without any peaks observed for hemoglobin (Fig. 2B–D).
Fig. 2.
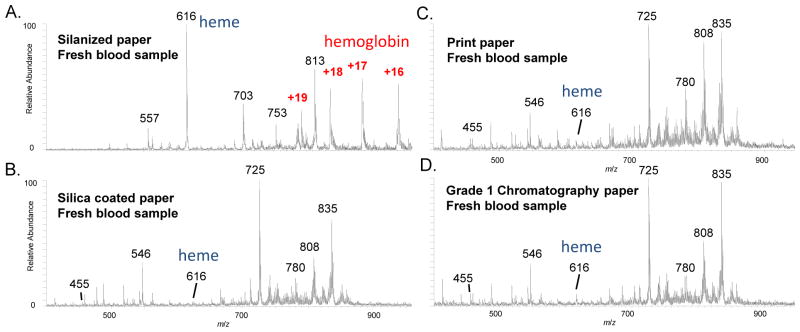
Mass spectra for analysis of fresh blood samples using different paper substrates, (A) silanized paper, (B) silica-coated paper, (C) print paper, and (D) Grad 1 chromatography paper. Dried blood spots prepared with 2 μL blood containing 1 μg/mL verapamil (m/z 455) used for each sample, 20 μL methanol used for each paper spray.
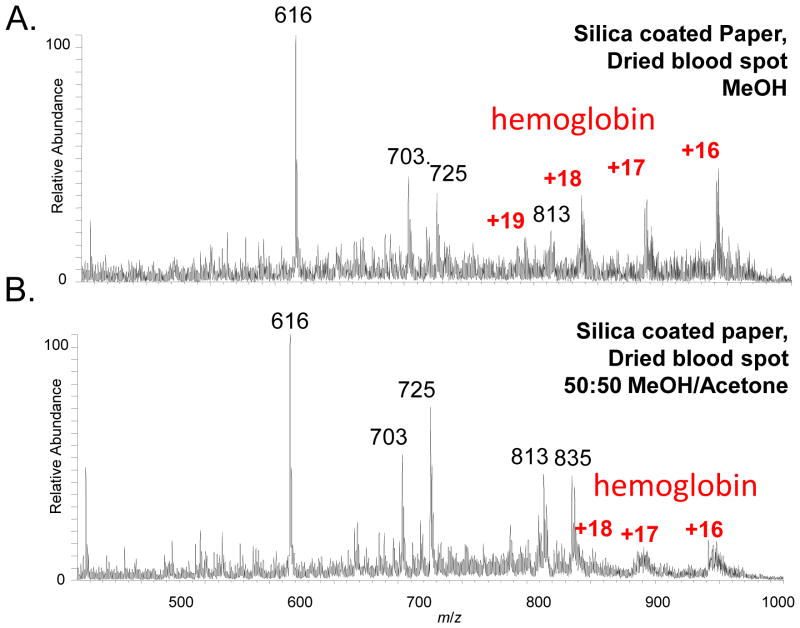
Dried blood spots each prepared with 2μL blood sample containing 1 μg/mL verapamil on silicate-coated paper substrates were also analyzed using two different solvents, the pure MeOH and 50:50 MeOH/Acetone (v/v). In comparison with the fresh blood sample (Fig. 2D), the peaks for the lipids were suppressed with the DBS sample analyzed using MeOH and peaks for hemoglobin could be observed (Fig. 3A). Using the 50:50 MeOH/acetone (v/v) solvent for the analysis of the DBS samples, the intensities of the lipid peaks were much higher (Fig. 3B). The increase in abundances of the lipids observed may be due to an increased extraction efficiency of lipids from the DBS with the acetone added in the solvent system [29]. The addition of acetone was also expected to cause the proteins to precipitate [30] [31] and subsequently a poor elution for the MS analysis (Fig. 3B). With both solvents, a heme peak of high intensities was observed.
Fig. 3.
Mass spectra for analysis of dried blood spots using silica-coated paper substrates with different solvents, 20 μL methanol (E) and methanol/acetone (50:50, v:v) (F). Dried blood spots prepared with 2 μL blood containing 1 μg/mL verapamil (m/z 455).
While hemoglobin and lipids could be the biomarkers and target analytes in the analysis, they also serve as the chemicals from blood samples that put matrix effect on analysis of other analytes, such as a therapeutic drug compound or its metabolites. The protonated verapamil m/z 455 could be observed at different intensities at various conditions used in the experiments above, except for the analysis of fresh blood sample on silanized paper using MeOH. In a separate experiment analyzing pure verapamil deposited on silanized paper using MeOH, severe retention of the verapamil by the substrate was not observed. The absence of the verapamil peak in the MS spectra shown in Figure 2A might well be due to the competition with the hemoglobin of a high abundance during the ionization process.
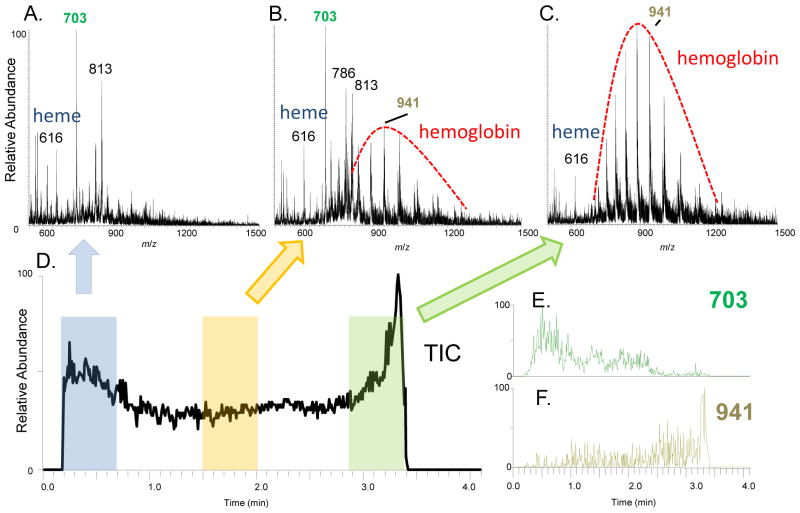
The elution patterns of different chemical species in blood samples were investigated by tracing the ion chronograms obtained in the experiments described above. An irregular bimodal pattern with a sharp peak rising at the end of the paper spray process was observed in the total ion chronogram (TIC) (Fig. 4) for the fresh blood using silanized paper and MeOH. The averaged spectra at the beginning, middle and the end of the paper spray process are shown in Fig. 4A, B, and C, respectively. The peaks due to lipids, such as m/z 703 and 813, are prominent in the spectra recorded at the beginning of the paper spray process. At the ending stage, the signals of hemoglobin became overwhelming and the signals of lipids decayed to minimum (Fig. 4C). The extracted chronograms of lipid peak at m/z 703 (Fig. 4E) and hemoglobin m/z 941 (+16 charge state, Fig. 4F) confirmed the observation. In a previous study using probe electrospray ionization (PESI) [32], a bimodal pattern was also observed for a mixture of Triton X-100 and cytochrome C and was claimed to be attributed to surfactant effect during the electrospray. In this experiment, the decay of the lipid peaks occurred much earlier than the rise of the hemoglobin peak (Fig. 4E and F), which indicates that the observed pattern might not be due to a direct competition between the lipids and the hemoglobin during the ionization step. The spray solvent was dropped on the paper substrate all in once. The fact that the rise of the protein peaks at the very end of the paper spray process, when the solvent was about to completely exhaust, indicates that smaller droplets might have been generated at this condition and a subsequent better desolvation might have helped to improve the intensity of the protein peaks.
Fig. 4.
The spectra recorded at the (A) beginning, (B)middle and (C) end of the analysis period using paper spray MS, the total ion chronogram (D) and the extracted ion chronogram for (E) m/z 703 and (F) m/z 941, 2 μL fresh blood sample on a silanized paper substrate, analyzed using paper spray with 20 μL MeOH.
The experiments discussed above were all performed by dumping the 20 μL solvent onto the paper substrate all in once. The amount of the solvent was sufficient to wet the substrate immediately and form a liquid film on the top of the substrate. In this mode of applying solvent, the interactions between the analyte and the substrate could be minimized. The flow rate for the electrospray at the substrate tip could also vary as the solvent is consumed. Paper spray could also be performed with a continues feeding of the solvent to the paper substrate, which is expected to have a different impact on the elution and transport of the analytes on the paper.
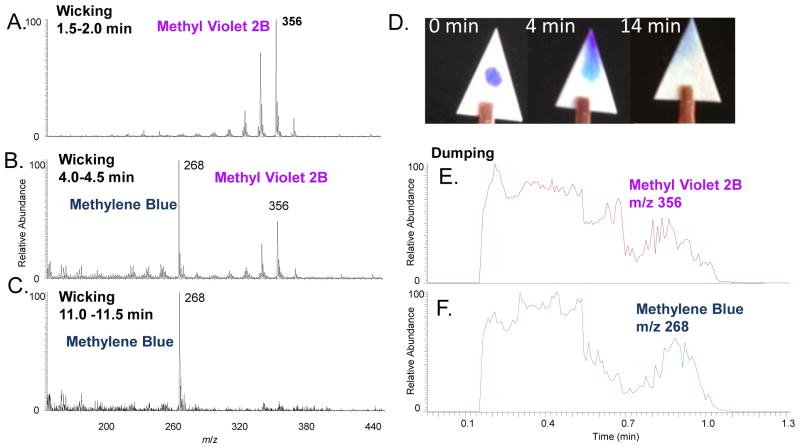
An experiment with a simple bi-component sample system with two dyes was conducted. A solution of 0.5 μL 50:50 MeOH/H2O containing methyl violet 2B and methylene blue each at 1 mg/mL was preloaded onto a grade 1 chromatography paper substrate and let dried in air. High concentrations were used for the dyes in this experiments to allow the colors to be visible. The base of the substrate was then connected to a solvent reservoir containing MeOH using a porous plastic tube. The solvent was fed to the substrate through wicking while a high voltage was applied to generate the spray. It was observed that a stable spray was formed 2 min after the wicking started, when the substrate was completed wetted. Mass spectra were constantly recorded and the averaged spectra for periods of 1.5 to 2.0 min, 4.0 to 4.5 min, and 11.0 to 11.5 min are shown in Fig. 5A, B, and C, respectively. The spectra were dominated with the peak of methyl violet 2B at m/z 268 at the starting stage (Fig. 5A) but finally overwhelmed with the peak of methylene blue at m/z 356 (Fig. 5C). The photos shown in Fig. 5D were taken before, during and after the paper spray, clearly recording the transport and separation of the dyes through the spray paper process. The methylene blue has stronger affinity to the cellulose substrate in comparison with methyl violet 2B and hence a longer elution time was observed.
Fig. 5.
The wicking (A–D) and the dumping (E–F) modes of applying the solutions for paper spray. The spectra averaged over the periods of (A) 1.5 to 2.0 min, (B) 4.0 to 4.5 min, and (C) 11.0 to 11.5 min during a paper spray with MeOH introduced in wicking mode. Dried sample spot prepared with loading 0.5 μL 50:50 MeOH/H2O containing methyl violet 2B and methylene blue each at 1 mg/mL. (D) Photos of the sample substrate before, during and after the paper spray. The extracted ion chronograms recorded using dumping mode for paper spray for (E) methyl violet 2B m/z 356 and (F) methylene blue m/z 268.
As a comparison with the wicking mode, the analysis of a similar sample substrate was done with 20 μL MeOH dumped onto the substrate all in once. The extracted ion chronograms for protonated methyl violet 2B at m/z 356 and protonated methylene blue at m/z 268 are shown in Fig. 5E and F. Similar patterns were observed for the elution of these two compounds without a clear separation between them. The solvent applied in excess formed a liquid film on the top of the substrate, which allowed a transport of the chemical in the liquid and minimized the interactions between the analytes and the paper substrate. The selection of the mode for applying the solvent could effectively set or suppress the on-paper separation during the paper spray. For analyzing extremely complex samples, applying the wicking method and averaging spectra over a selected period for target analyte might be an effective way of obtaining the best results.
CONCLUSIONS
The impacts by the paper substrate, spray solvent and elution method were studied for the direct analysis using paper spray mass spectrometry. Preferences in the substrate-solvent systems were observed for the analysis of different biological and chemical species in whole blood samples using paper spray. The on-paper separation of the extracted analytes could be selectively set by the means of applying the spray solvent. For a special application with target analytes, proper selection of the substrate-solvent system and the elution method for the paper spray would allow an optimal condition for these analytes while suppressing the matrix effects.
Acknowledgments
This work was supported by the National Science Foundation (CHE 0847205), National Science Foundation Instrumentation Development for Biological Research (DBI 0852740), National Center for Research Resources (5R21RR031246-03) and the National Institute of General Medical Sciences (8 R21 GM103454) from the National Institutes of Health, and the Alfred Mann Institute at Purdue University.
References
- 1.de Oliveira AP, de David C, Esteves PA, Spilki FR, da Silva AD, Holz C, Simonetti AB, Roehe PM. Acta Scientiae Veterinariae. 2011:39. [Google Scholar]
- 2.Pappaioanou M, Kashamuka M, Behets F, Mbala S, Biyela K, Davachi F, George JR, Green TA, Dondero TJ, Heyward WL, Ryder RW. Aids. 1993;7:483–488. doi: 10.1097/00002030-199304000-00005. [DOI] [PubMed] [Google Scholar]
- 3.Toennies G, Kolb JJ. Analytical Chemistry. 1951;23:823–826. doi: 10.1021/ac60054a002. [DOI] [Google Scholar]
- 4.Bush IE. Biochemical Journal. 1952;50:370–378. doi: 10.1042/bj0500370. [DOI] [PMC free article] [PubMed] [Google Scholar]
- 5.Zaffaroni A, Burton RB, Keutmann EH. Science. 1950;111:6–8. doi: 10.1126/science.111.2871.6. [DOI] [PubMed] [Google Scholar]
- 6.Du Toit MH, Eggen PO, Kvittingen L, Partali V, Schmid R. Journal of Chemical Education. 2012;89:1295–1296. doi: 10.1021/ed200851w. [DOI] [Google Scholar]
- 7.Teixeira LSG, Santos ES, Nunes LS. Analytica Chimica Acta. 2012;722:29–33. doi: 10.1016/j.aca.2012.02.014. [DOI] [PubMed] [Google Scholar]
- 8.Zhou C, Yuan P, Chen B, Yao SZ. Chemical Journal of Chinese Universities-Chinese. 2011;32:1733–1736. [Google Scholar]
- 9.Berezkin VG, Litvin EF, Balushkin AO, Rozylo JK, Malinowska I. Chemia Analityczna. 2005;50:349–364. [Google Scholar]
- 10.Huang YQ, You JQ, Zhang JS, Sun WJ, Ding L, Feng YQ. Journal of Chromatography A. 2011;1218:7371–7376. doi: 10.1016/j.chroma.2011.08.067. [DOI] [PubMed] [Google Scholar]
- 11.Wallach DFH, Garvin JE. Journal of the American Chemical Society. 1958;80:2157–2161. doi: 10.1021/ja01542a031. [DOI] [Google Scholar]
- 12.Cooks RG, Ouyang Z, Takats Z, Wiseman JM. Science. 2006;311:1566–1570. doi: 10.1126/science.1119426. [DOI] [PubMed] [Google Scholar]
- 13.Ouyang Z, Zhang XR. Analyst. 2010;135:659–660. doi: 10.1039/c003812c. [DOI] [PubMed] [Google Scholar]
- 14.Harris GA, Galhena AS, Fernandez FM. Analytical Chemistry. 2011;83:4508–4538. doi: 10.1021/ac200918u. [DOI] [PubMed] [Google Scholar]
- 15.Wang H, Liu JJ, Cooks RG, Ouyang Z. Angewandte Chemie-International Edition. 2010;49:877–880. doi: 10.1002/anie.200906314. [DOI] [PubMed] [Google Scholar]
- 16.Wang H, Manicke NE, Yang Q, Zheng L, Shi R, Cooks RG, Zheng O. Analytical Chemistry. 2011;83:1197–1201. doi: 10.1021/ac103150a. [DOI] [PMC free article] [PubMed] [Google Scholar]
- 17.Espy RD, Manicke NE, Ouyang Z, Cooks RG. Analyst. 2012;137:2344–2349. doi: 10.1039/c2an35082c. [DOI] [PubMed] [Google Scholar]
- 18.Manicke NE, Abu-Rabie P, Spooner N, Ouyang Z, Cooks RG. Journal of the American Society for Mass Spectrometry. 2011;22:1501–1507. doi: 10.1007/s13361-011-0177-x. [DOI] [PubMed] [Google Scholar]
- 19.Manicke NE, Yang QA, Wang H, Oradu S, Ouyang Z, Cooks RG. International Journal of Mass Spectrometry. 2011;300:123–129. doi: 10.1016/j.ijms.2010.06.037. [DOI] [PMC free article] [PubMed] [Google Scholar]
- 20.Yang Q, Manicke NE, Wang H, Petucci C, Cooks RG, Ouyang Z. Analytical and Bioanalytical Chemistry. 2012;404:1389–1397. doi: 10.1007/s00216-012-6211-4. [DOI] [PMC free article] [PubMed] [Google Scholar]
- 21.Liu JJ, Wang H, Manicke NE, Lin JM, Cooks RG, Ouyang Z. Analytical Chemistry. 2010;82:2463–2471. doi: 10.1021/ac902854g. [DOI] [PubMed] [Google Scholar]
- 22.Zhang ZP, Cooks RG, Ouyang Z. Analyst. 2012;137:2556–2558. doi: 10.1039/c2an35196j. [DOI] [PubMed] [Google Scholar]
- 23.Zhang ZP, Xu W, Manicke NE, Cooks RG, Ouyang Z. Analytical Chemistry. 2012;84:931–938. doi: 10.1021/ac202058w. [DOI] [PMC free article] [PubMed] [Google Scholar]
- 24.Ouerdane L, Meija J, Bakirdere S, Yang L, Mester Z. Analytical Chemistry. 2012;84:3958–3964. doi: 10.1021/ac203137n. [DOI] [PubMed] [Google Scholar]
- 25.Espy RD, Muliadi AR, Ouyang Z, Cooks RG. International Journal of Mass Spectrometry. 2012;325:167–171. doi: 10.1016/j.ijms.2012.06.017. [DOI] [Google Scholar]
- 26.Varnell DF. Pulp & Paper-Canada. 1998;99:37. [Google Scholar]
- 27.Wang H, Zhang Z, Manicke NE, Cooks RG, Ouyang Z. Mass Spectrometry Applications to the Clinical Lab. San Diego, CA: 2012. Direct, Quantitative Analysis of Nicotine and Its Metabolites In Biofluid Samples Using Paper Spray Mass Spectrometry. Track 3: Tobacco, 10:30 am. [Google Scholar]
- 28.Go EP, Uritboonthai W, Apon JV, Trauger SA, Nordstrom A, O’Maille G, Brittain SM, Peters EC, Siuzdak G. Journal of Proteome Research. 2007;6:1492–1499. doi: 10.1021/pr060608s. [DOI] [PMC free article] [PubMed] [Google Scholar]
- 29.Urbanova D, Adams CW. The Histochemical journal. 1970;2:1–9. doi: 10.1007/bf01003450. [DOI] [PubMed] [Google Scholar]
- 30.Barritault D, Expertbezancon A, Guerin MF, Hayes D. European Journal of Biochemistry. 1976;63:131–135. doi: 10.1111/j.1432-1033.1976.tb10215.x. [DOI] [PubMed] [Google Scholar]
- 31.Thongboonkerd V, McLeish KR, Arthur JM, Klein JB. Kidney International. 2002;62:1461–1469. doi: 10.1046/j.1523-1755.2002.00565.x. [DOI] [PubMed] [Google Scholar]
- 32.Mandal MK, Chen LC, Hiraoka K. Journal of the American Society for Mass Spectrometry. 2011;22:1493–1500. doi: 10.1007/s13361-011-0162-4. [DOI] [PubMed] [Google Scholar]


