

Abstract
The BAFF receptor (BAFF-R), encoded by the TNFRSF13C gene, is critically important for transitional B cell survival to maturity. Thus, ligation of BAFF-R by BAFF delivers a potent survival signal. Reports implicating the BAFF/BAFF-R signaling axis in the pathogenesis of autoimmune human diseases and B lineage malignancies have largely prompted studies focusing on BAFF expression; however, there is an equally critical need to better understand BAFF-R expression. Initial BAFF-R expression, although characterized in murine B cells, has not yet been reported in human B lymphopoiesis. In this study we first demonstrate that BAFF-R expression is absent from early precursors and is acquired by bone marrow B cells newly expressing the B cell receptor. We next focused on identifying the specific genomic region that controls BAFF-R expression in mature B cells, i.e., the TNFRSF13C promoter. To accomplish this, we used in silico tools examining interspecies genomic conservation in conjunction with reporter constructs transfected into malignant B and plasma cell lines. DNase protection assays using nuclear extracts from BAFF-R expressing cells suggested potential regulatory sites, which allowed the generation of EMSA probes that bound nuclear factors specific to BAFF-R-expressing cells. With a more stringent analysis of interspecies homology, these assays identified a site at which a single nucleotide substitution could distinctly impact promoter activity. Finally, ChIP assays revealed the in vivo binding of the specific transcription factor c-Rel to the most proximal genomic region, and c-Rel siRNA transfections in BAFF-R-expressing lines demonstrated a coincident knockdown of both c-Rel and BAFF-R mRNA.
Introduction
B lymphocyte activating factor (BAFF; also called BLyS; TNFSF13B) and its high affinity receptor, BAFF receptor (BAFF-R; also called BR3; TNFRSF13C), have been shown to mediate a powerful survival signal in transitional and mature B cells (1–3). Mice deficient in BAFF, BAFF-R, or A/WySnJ mice with mutant BAFF-R all show very similar defects, in particular a precipitous decline in B cells beginning at the transitional stage, indicating the essential and complementary nature of both the receptor and its ligand to the survival of mature B cells (3, 4). Recent data has clearly shown that murine developing B cells in the bone marrow first express BAFF-R on their surface at the immature stage, Hardy Fraction E (5). It is also at this critical stage in B cell development, when the cells express a complete and functional BCR on their surface, that selection must occur, culling B cells that express autoreactive receptors and, as immunoglobulin receptor usage studies have suggested, positively selecting a subset of those cells (6–8). The complicated nature of BCR signaling, which must be capable of both initiating apoptosis and of promoting survival, is coincident with the crucial survival signal initiated by the ligation of BAFF-R. The ontogenic association of these two signals has raised intriguing questions into the nature of survival of developing B cells and into the connections between these two receptors.
Recent data have suggested that BCR signaling plays a central role in the BAFF-R survival signal. Stadanlick et al. have demonstrated an essential role for tonic BCR signaling in the BAFF-R-mediated survival of murine B cells, in which the BCR’s constitutive baseline signal induction is responsible for generating the NF-κB family member p100, which serves as a substrate for the alternative NF-κB pathway essential for BAFF-R-mediated survival (5). In a complementary study, Castro et al. suggested that induced signaling of murine B cells through the BCR is additionally responsible for upregulation of the BAFF-R receptor, itself, through a c-Rel-dependent mechanism (9). The nature of the crosstalk between these two receptors may indeed include multiple complex and interacting pathways. Understanding these systems necessitates a precise examination of each component both in isolation and in context. In this study, we focused on the transcriptional regulation of BAFF-R expression in human B cells. The regulatory elements controlling BAFF-R expression at the genetic level are critically and fundamentally important in understanding the way that B cells use both the BCR and BAFF-R to survive development and enter the periphery as mature B cells, a feat only 5% of newly generated bone marrow B cells accomplish (10).
The reports linking BCR-initiated signaling pathways to BAFF-R expression are consistent with a role for NF-κB family member c-Rel in B cells with a mature BCR, since it has been demonstrated that c-Rel becomes a dominant component of nuclear NF-κB complexes only after B cells express a complete BCR, while the composition of NF-κB complexes in their immediate precursors, pre-B cells, are dominated by p50/p65 heterodimers (11). Consistent with this notion, mice deficient in c-Rel and c-Rel redundant molecule RelA showed a deficit of mature B cells (12, 13). Furthermore, such a B cell phenotype can be rescued by the over-expression of pro-survival factor Bcl-2, suggesting that cell survival is indeed the limiting factor during B cell maturation in the c-Rel/RelA double knockout mice (14). TACI-Ig-transgenic mice, which have an inhibited BAFF/BAFF-R axis due to the presence of a soluble BAFF-binding receptor in the circulation, recapitulate a very similar phenotype when their B cells are rescued by transgenic Bcl-2 expression (15).
Just as the point at which B lineage cells first express BAFF-R provides essential clues to its transcriptional control, so too does the point at which B cells no longer express BAFF-R. It is clear already that the human plasma cell population does not express this BAFF-binding receptor and that the induction of the plasma cell differentiation pathway can downregulate BAFF-R expression in vitro (16). To our knowledge, the mechanisms that extinguish BAFF-R expression on the surface of plasma cells are unknown, and in these studies we provide the first evidence that this down-regulation is an outcome dependent solely on the transcription factor network.
As there is mounting evidence that BAFF plays a key role in B cell cancers and in autoimmune illnesses (reviewed in (17, 18)), there is an urgent need to better understand the regulation of BAFF-R expression. This study establishes the developmental regulation of BAFF-R expression in human B cells and uses interspecies homology to identify a regulatory region adjacent to the TNFRSF13C gene that acts as a promoter in response to B cell intrinsic signals. The generation and application of reporter vectors coordinated with in vitro protein-DNA interaction assays, DNase protection and EMSA, identified a core promoter region under the control of B cell constitutive transcription factors and a site within that promoter that is sensitive to a single base pair substitution. The demonstration of in vivo interactions using chromatin immunoprecipitation (ChIP) and in vitro small interfering RNA- (siRNA-) mediated gene silencing demonstrated that c-Rel contributes to this purpose.
Materials and Methods
Interspecies homology
The schematic representing the human and murine genomic loci in the vicinity of TNFRSF13C was generated with the March 2006 genome assembly at the UCSC Genome Browser (genome.ucsc.edu). The histograms representing interspecies homology between the human and murine or equine loci were generated with the March 2006 genome assembly at the VISTA Genome Browser (pipeline.lbl.gov) using a calculation window of 100 bp and conservation criteria of 100 bp at 70% unless otherwise indicated.
Cells and cell lines
All cell lines were maintained in media supplemented with 10% heat-inactivated FCS, penicillin, streptomycin, glutamine, and gentamicin. EBV-negative Burkitt’s lymphoma B cell lines RAMOS and Loukes were maintained in RPMI, while KAS-6/1 (19) and ALMC-1 (20) myeloma lines were maintained in IMDM supplemented with IL-6. Culture conditions for the ALMC-1 line also included insulin-like growth factor 1.
Mononuclear cells were isolated from normal donor peripheral blood, tonsillar tissue from routine tonsillectomies, and bone marrow (BM) of patients undergoing spine surgeries without coincident B lineage malignancies. Written informed consent was obtained in accordance with the Declaration of Helsinki, and all human protocols were approved by the Mayo Clinic Institutional Review Board. When isolated for nuclear extraction, B cells were purified with a negative selection protocol (StemCell) using a RoboSep, and were routinely greater than 98% pure as revealed by CD19 expression. BM cells analyzed for BAFF-R expression were first purified through CD19 positive selection and also costained with a fluorescently tagged CD19 antibody to ensure that the appropriate population was identified.
Luciferase reporter constructs, siRNA and transient transfections
We used the pGL3-Basic firefly luciferase vector as the backbone for the putative BAFF-R promoter reporter and the pRL-TK Renilla luciferase plasmid as a normalization control (Promega). The promoter was cloned from BAC clone RP11-101F24 (Empire Genomics) with primers listed in Table I, designed with flanking restriction sites (KpnI at the 5′ end and HindIII at the 3′ end) compatible with the appropriate orientation ligation into the KpnI- and HindIII-digested pGL3-Basic backbone. The deletion reporters were generated from the pGL3-Basic −0.5 kb reporter with site-directed mutagenesis using PfuUltra (Stratagene) and 50 bp complementary oligonucleotides flanking the region to be deleted.
TABLE I.
Primer sequences for cloning the genomic region upstream of TNFRSF13C.
| −2.5 kb +KpnI 5′ | 5′ GAATCA GGTACC TATGTGGGTGGCAGGGTTATGGC 3′ |
| −2.0 kb +KpnI 5′ | 5′ GAATCA GGTACC GCTCAGAATCTCCCTCCTACCC 3′ |
| −1.5 kb +KpnI 5′ | 5′ GAATCA GGTACC AGATAGACAGGAGGGGCCCGC 3′ |
| −1.0 kb +KpnI 5′ | 5′ GAATCA GGTACC CTGGGCACTGTGGCTTCACACC 3′ |
| −0.5 kb +KpnI 5′ | 5′ GAATCA GGTACC ACACCTCCCAGCACCCAGCAG 3′ |
| −0 kb +HindIII 3′ | 5′ GAATCA AAGCTT CGACGCCGCCGCACAAGCTGC 3′ |
Primers used to clone the region upstream of TNFRSF13C for the promoter reporter constructs. The numbering in the name of each probe indicates its approximate position relative to the TNFRSF13C transcriptional start site (TSS) followed by the restriction enzyme cleavage site added to the sequence. The added restriction site is underlined and separated from the neighboring nucleotides by spaces.
Stealth Select siRNA directed to c-Rel (HS109157, HSS109158, HSS184261) and GC-content-matched controls were purchased from Invitrogen.
For each transfection, cells were washed twice in PBS before being resuspended in serum-free RPMI. Five million cells were then incubated with 30 μg of the test firefly luciferase plasmid and 0.6 μg of the control Renilla luciferase plasmid or 5 μL of 20 μM siRNA in a total of 300 μL RPMI. Using an Electro Square Porator T 820 (BTX), cells were electroporated with a 10 ms pulse at a voltage optimized to the cell line (300 V, 310 V, 320 V, and 325 V for RAMOS, KAS-6/1, ALMC-1, and Loukes, respectively) in 0.4 mm electroporation cuvettes. The cells subsequently recovered for 10 min at room temperature before being added to 10 mL of warm, prepared media in a 6-well plate. At 48 h, the cells were tested using the Promega Dual-Luciferase Reporter kit. Briefly, the cells were harvested and then lysed at room temperature for 20 min with gentle shaking in 150 μL Passive Lysis Buffer. These lysates were kept at −20°C until analysis, at which time 20 μL were removed and analyzed for luciferase activity in a Centro XS plate-reading luminometer (Berthold Technologies).
Flow cytometric analyses
BM CD19+ cells were stained with fluorescently conjugated antibodies CD19-AlexaFluor700 (BD Biosciences), CD34-PerCP (BD Biosciences), CD10-APC (BD-Biosciences), immunoglobulin (Ig) light chain (LC) kappa-FITC (BD Biosciences), Ig LC lambda-FITC (BD Biosciences), and BAFF-R-PE (eBioscience). The antibodies were incubated with the cells for 25 min at 4°C before two washes and fixation in PBS containing 1% paraformaldehyde. Data were collected on a FACS Vantage or Aria (BD Biosciences) and analyzed with Flow Jo software (Tree Star).
DNase protection assay
Probes were generated by digesting the BAFF-R putative promoter-containing pGL3-Basic vector with various restriction enzymes. Probe 1 (−289 — +33) and Probe 2 (−722 — −239) were cut from the plasmid with enzyme pairs NcoI and SfoI and EcoRV and XmaI (NEBiolabs), respectively, to generate 5′overhangs to be labeled by filling in with radioactive nucleotides. After 10 pmol of plasmid were digested for 2 h at 37°C in NEB Buffer 4, the probes were labeled by the addition of Klenow, 100 μCi of 32P-labeled dCTP, and an excess of unlabeled dATP, dTTP, and dGTP. After 25 min, an excess of all four cold dNTPs was added. The labeled probe was then resolved on a non-denaturing 6% polyacrylamide gel prepared in 0.5X Tris/Borate/EDTA (TBE), and isolated by the crush-and-soak method (21).
Nuclear extracts prepared with NE-PER Nuclear and Cytoplasmic Extraction reagents (Pierce) were diluted in Tris/NaCl protein dilution buffer before combining with 15,000 cpm of labeled probe. After an incubation of 20 min at room temperature, DNase was added and incubated with the probes for 1 min before stopping with an EDTA/formamide loading buffer. The samples were then denatured for 3 min at 90°C and loaded on a 6% denaturing polyacrylamide sequencing gel in TBE. GA trackers were prepared by incubating labeled probe in 2mM EDTA, 0.2mM NaOH, 0.02% Bromophenol Blue, 16% formamide for 40 min at 100°C.
Transcription factor binding sites
Putative transcription factor binding sites were identified with P-Match (gene-regulation.org), which queries the TransFac database, filtering for vertebrate transcription factors and using the provided algorithm that minimizes false negative results.
Chromatin immunoprecipitation (ChIP)
ChIP was performed as described by Bell, et al. (22). Immunoprecipitation used Pax5, c-Rel or control antibodies (Santa Cruz antibodies SC-13146, SC-6955, and SC-2025, respectively). Following elution, the DNA was treated with NaCl for 4h at 65°C to reverse the formaldehyde-generated cross-links before isolation of the DNA by phenol:chloroform extraction and ethanol precipitation. The DNA was then re-suspended in 10 μL water and analyzed by real-time quantitative PCR (qPCR) on a Lightcycler 2.0 (Roche) with the SYBR Green PCR kit (Qiagen). The primers used for amplifying regions upstream of the BAFF-R gene are summarized in Table II.
TABLE II.
Primers used in the ChIP assay.
| Region of Primer (Relative to TSS) | Direction | Sequence, 5′ — 3′ |
|---|---|---|
| −2447 | Forward | TATGTGGGTGGCAGGGTTAT |
| −2119 | Reverse | AAGGTTCACAAAGAACCCCA |
| −1996 | Forward | GACCCTTGCAGGTACAGCTC |
| −1633 | Reverse | GCAGAGAGCATGGGGTTAAA |
| −1713 | Forward | CTCCTCTCACTGTGCTTCCC |
| −1358 | Reverse | GAGTGAGGGAACTGTGACTGC |
| −1483 | Forward | AGCAGAGATAGACAGGAGGGG |
| −1137 | Reverse | TGAAGTGTTTGCCAGATGGA |
| −1235 | Forward | CTCCCTGGACTTCCTGTTTG |
| −935 | Reverse | CTCCCAAAGTGCTGGGATTA |
| −430 | Forward | TGGGGAACCACAGGTAGAAA |
| −64 | Reverse | CCTGCTGGGTGGGACC |
Primers used in the real-time quantitative PCR of the ChIP assay to amplify regions upstream of the TNFRSF13C gene enriched by IP. The primers are identified by their position relative to the TNFRSF13C TSS.
Electrophoretic mobility shift assay (EMSA)
Nuclear extracts were prepared as for the DNase protection assays, using NE-PER Nuclear and Cytoplasmic Extraction reagents (Pierce). Probes were generated by annealing complementary single-stranded, 3′-biotinylated (with 3′-biotinTEG-DPG kit, Glen Research) 20 bp oligonucleotides encompassing the core transcription factor binding site. The sequences are listed in Table III. EMSA was performed according to the NuShift c-Rel kit (Active Motif).
TABLE III.
EMSA probes.
| Region of Probe (Relative to TSS) | Direction | Sequence, 5′ — 3′ |
|---|---|---|
| −69 — −88 | Forward | GCGAGCTCGGTCCCACCCAG |
| −69 — −88 | Reverse | CTGGGTGGGACCGAGCTCGC |
| −49 — −68 | Forward | CAGGCGGGGGCGGGGCAGGG |
| −49 — −68 | Reverse | CCCTGCCCCGCCCCCGCCTG |
| −28 — −48 | Forward | CAGAGTGCTCCCCCCGCCCCC |
| −28 — −48 | Reverse | GGGGGCGGGGGGAGCACTCTG |
| −1 — −27 | Forward | CGCTTCCTCCCCGAGGGCCCCGGAGCC |
| −1 — −27 | Reverse | GGCTCCGGGGCCCTCGGGGAGGAAGCG |
| +22 — +1 | Forward | CAGCTCAGCCTCAGTCCCCGCA |
| +22 — +1 | Reverse | TGCGGGGACTGAGGCTGAGCTG |
| +40 — +23 | Forward | GCTTGTGCGGCGGCGTCG |
| +40 — +23 | Reverse | CGACGCCGCCGCACAAGC |
Pairs of complementary oligonucleotides used to create the double-stranded probes employed in the EMSA. In each case, the forward probe was biotinylated at the 3′ end before annealing.
Immunoblotting
Nuclear extracts prepared as for the DNase protection assays and EMSAs were resolved by SDS-PAGE (30–40 μg/lane) and transferred to Immobilon-P membranes (Millipore) for immunoblotting. Membranes were blocked for 1 h at 37°C in 5% Blotto (Santa Cruz Biotechnology) supplemented with 0.2% Tween 20 and then blotted overnight with anti-c-Rel Ab (Millipore #09-040) or anti-Histone H1 Ab (Millipore #05-457) following the manufacturer’s protocol. Immunoreactive proteins were detected using an ECL detection system (Super Signal; Pierce) and autoradiography.
Real-time quantitative RT-PCR for c-Rel and BAFF-R
RNA was isolated from cells using TRIzol reagent (Invitrogen) followed by phenol:chloroform extraction, isopropanol precipitation and a 70% ethanol wash. 2 μg of RNA were converted to cDNA with the 1st Strand cDNA Synthesis Kit (GE Healthcare). The cDNA was diluted to 50 μL with diethylpyrocarbonate-treated molecular grade water before using 2 μL in each real-time quantitative RT-PCR (qRT-PCR) reaction performed in duplicate with the RT2 SYBR green/Rox qPCR Master Mix (SABiosciences) in an ABI Prism 7900HT Real Time System. cDNA was diluted 1:200 before use in the 18S control reaction to preserve the linearity of amplification in an appropriate threshold cycle range greater than 10. C-Rel was amplified with primers forward 5′-CCTGTTGTCTCGAACCCAAT and reverse 5′-TCTCCTCCTCTGACACTTCC. BAFF-R was amplified with primers forward 5′-GGTCCTGGTGGGTCTGGTGAG and reverse 5′-ACCTTGTCCAGGGGCTCTGGG. 18S rRNA was amplified with primers forward 5′-CGGCTACCACATCCAAGGAA and reverse 5′-GCTGGAATTACCGCGGCT.
Statistical analysis
Within the luciferase reporter assays performed with the truncated promoter vectors (Fig. 3B), normality was determined with the Kolmogorov-Smirnov test, and then statistical analysis was performed using either the two-tailed one-sample t-test or the Wilcoxon signed-rank test with a null hypothesis of relative luciferase activity equal to that of the empty reporter vector transfection. In the luciferase assays using the reporter deletion and mutant vectors (Fig. 3C and 6), each vector was compared to the activity of the complete −0.5 kb promoter reporter vector with a repeated measures ANOVA. In all cases, values of p < 0.05 were considered to be significant.
FIGURE 3. Luciferase reporter activity in human B lineage cell lines.

A, Surface expression of BAFF-R (empty histogram) on Loukes and RAMOS B cell lines and on ALMC-1 and KAS-6/1 plasma cell lines versus isotype-matched staining (filled histogram). B, Luciferase reporter activity in the cell lines 48 h after transfection with the pGL3-Basic reporters in which the 5′ regions adjacent to the TNFRSF13C gene have been inserted. The upstream regions begin at approximately 2.5, 2.0, 1.5, 1.0, and 0.5 kb upstream of the gene’s transcriptional start site (TSS) and each end 40 bp 3′ of the TSS, 6 bp upstream of the coding sequence. The activity is measured as the ratio of specific promoter activity to empty vector normalized to Renilla luciferase activity in the same cells. Asterisks indicate statistically significant differences between the activity of the promoter insert and the empty pGL3-Basic reporter, p < 0.05. C, Luciferase reporter activity in the RAMOS and Loukes cell lines 48 h after transfection with the pGL3-Basic reporter with the complete −0.5 kb TNFRSF13C promoter inserted, inserts with specific regions of the −0.5 kb promoter deleted, or no insert. Activity was measured as in B. Asterisks represent statistically significant differences in the reporter vectors when compared with the complete −0.5 kb reporter, p < 0.05.
FIGURE 6. Mutant luciferase reporter activity in human B lineage cell lines.
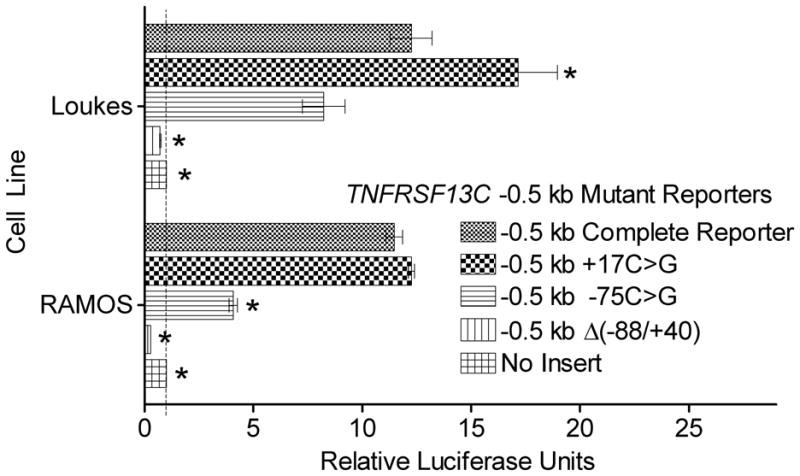
Luciferase reporter activity in the RAMOS and Loukes cell lines 48 h after transfection with the pGL3-Basic reporter with the complete −0.5 kb TNFRSF13C promoter (“Complete Reporter”), the region of highest activity deleted (Δ( −88/+40)), point mutations at specific conserved sites (−75C>G, +17C>G), or no insert. Activity was measured as in Fig. 3B. Asterisks represent statistically significant differences in the reporter vectors when compared with the complete −0.5 kb reporter, p < 0.05.
Results
BAFF-R expression in human B cell ontogeny
Before undertaking an analysis of the regulatory control of the expression of TNFRSF13C in mature human B cells, it was essential to define the expression pattern during normal human ontogeny. To accomplish this goal, purified CD19+ BM B cells were stained to identify pro-B, pre-B, immature transitional B, and mature recirculating B cells and characterize their surface expression of BAFF-R (Fig. 1A).
FIGURE 1. BAFF-R surface expression on bone marrow B cell populations.
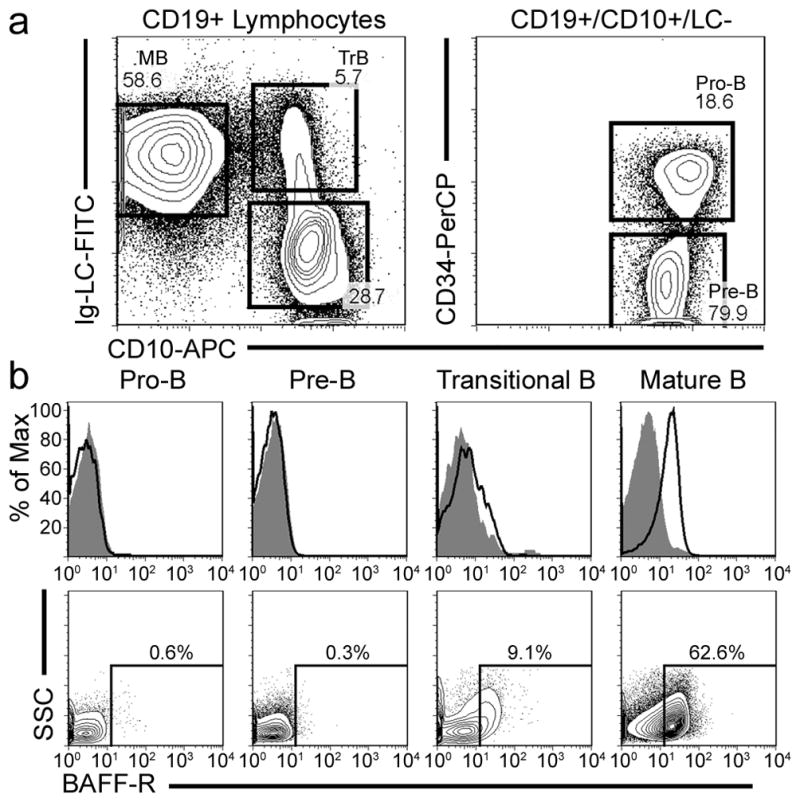
A, Gating strategy identifying BM B lineage cell subpopulations. B lineage cells were first identified with CD19 expression. Mature recirculating B cells were identified through light chain (LC) expression and the absence of CD10, while immature transitional B cells were identified as LC+ and CD10+. Earlier B lineage cells were LC− and CD10+. These early B cells were segregated to a pro-B population characterized by surface CD34, and a pre-B population identified by its lack of CD34. B, The B cell populations were co-stained for the above markers as well as for BAFF-R surface expression or an isotype-matched control antibody. The upper row depicts the BAFF-R surface staining (empty histogram) compared to the isotype control (filled histogram) for that population. The lower row shows a contour plot of the BAFF-R staining in these same populations with gating around the BAFF-R+ population. The data are representative of four independently stained bone marrow samples.
In all four normal BM samples, the CD19+/CD10+/LC− developing B cell pool in the BM consisting of pro-B and pre-B cells showed absolutely no BAFF-R expression, as shown in both the histograms and the dotplots of Fig. 1B. In stark contrast, the CD19+/CD10−/LC+ mature recirculating B cell population shows a uniform shift in the BAFF-R histogram toward a distinctly BAFF-R+ phenotype. The intervening developmental population of CD19+/CD10+/LC+ immature transitional B cells showed an intermediate phenotype between these two extremes. While the immature transitional B cell population did consistently demonstrate the coincident expression of a complete BCR and BAFF-R on the cell surface, the immature population’s distinct but relatively minor shift in BAFF-R surface expression could represent either a small shift in the whole population toward a BAFF-Rlow phenotype, or a small shift toward a BAFF-R+ phenotype of only a subset of these BCR+ cells. In either case, it is clear that BAFF-R expression first appears on the surface of developing B cells in the subpopulation that also expresses a complete BCR.
Interspecies homology at the TNFRSF13C locus reveals conserved sequences of regulatory interest
Our finding that BAFF-R expression on developing human B cells first occurs at the immature transitional stage is similar to expression in their mouse counterparts and suggests that TNFRSF13C, the gene encoding BAFF-R, is regulated by similar mechanisms across mammalian species. We, therefore, hypothesized that the transcriptional elements acting both in cis and in trans are conserved in both humans and mice. To explore the conserved transcriptional mechanisms, we set out to identify potential regulatory elements through interspecies homology at the TNFRSF13C locus. The gene is separated from each of its nearest known neighbors, CENPM and SREBF2, by over 10 kb in both the human and mouse genomes (Fig. 2A). These flanking neighbors code for the seemingly unrelated centromere protein M, a centromere assembly factor, and sterol regulatory element-binding protein 2, a ubiquitously expressed transcription factor. While the overall structure of the region is similar between species, there is no known coordinate regulation of TNFRSF13C with any of the other genes in the area.
FIGURE 2. Organization and conservation of the genomic TNFRSF13C locus in context.

A, Representation of the human genomic TNFRSF13C locus at 22q13.2, above the murine locus located at 15qE1, to scale. The diagram represents genes as boxes along the chromosome, represented as a line, in appropriate orientation designated by the arrows. B, VISTA Browser graph showing the percent homology of horse (upper) and mouse (lower) genomes to the human genome, which is acting as the baseline. The values of the histograms are calculated based on sequence lengths of 100 bp. Sequence lengths >100 bp with >70% sequence conservation are indicated by shading. The color of the shading corresponds to the coding, non-coding, or untranslated identity of the homologous sequence, labeled above.
In alignments of the mouse and horse genome to the human genome, each of the three TNFRSF13C exons coincided with regions of high homology defined as spans of at least 100 bp with 70% sequence conservation, which validated these minimal homology criteria. An analysis of the neighboring vicinity with these criteria revealed clear regions of conservation between mammalian species both within the gene and in the upstream non-coding sequence (Fig. 2B). While the upstream region adjacent to (i.e., within 100 bp of) the gene’s transcriptional start site (TSS) does not meet the 70%/100bp minimum required to be highlighted by the homology algorithm, this adjacent region’s distinct peak suggests a distinct preserved region. Although this first notably preserved site lacks a canonical TATA box, its relative position makes it likely to contain some positive regulatory elements and bear responsibility for assembling the transcriptional machinery, nonetheless. Within the next several kilobases upstream, the 70%/100bp criteria identify only two additional elements conserved in both of the examined mammalian species, which are located at about 2.2 and 2.9 kb upstream of the TNFRSF13C TSS. These two distal regions in conjunction with the proximal homologous region described above represent the likeliest loci of transcriptional regulatory elements based upon interspecies homology.
Validating the promoter activity of the upstream region adjacent to TNFRSF13C
The in silico analysis of preserved homology in the genomic region near TNFRSF13C underscored regions upstream of the gene with potential regulatory impact. To explore the significance of the most proximal elements of evolutionary conservation, the genomic region 2.5 kb upstream of the translational start site was cloned and ligated into firefly luciferase reporter vector pGL3-Basic. This reporter and reporters employing shorter inserts generated by serial 0.5 kb truncation from the 5′ end of the region interrogated the regulatory activity of the upstream sequence in BAFF-R-expressing and non-expressing lines.
The EBV-negative Burkitt’s lymphoma lines RAMOS and Loukes served as a model for BAFF-R-expressing B cells. Both of these lines clearly express BAFF-R on their surface (Fig. 3A) and show a striking increase in promoter-driven luciferase activity in the reporter constructs (Fig. 3B). In both lines, the smallest promoter insert, which contained only 500 bp directly adjacent to the TSS, showed a large jump in reporter activity. While the longer promoter inserts had variable and mostly additive effects, a pattern consistent between the two cell lines upon addition of a greater portion of the 5′ sequence did not emerge. Despite the region’s lack of an identifiable TATA-box and regardless of the effects of the more distal regions, it is clear that the proximal 500 bp confer a powerful positive regulatory capability upon the promoter.
To more precisely explore the promoter activity in the −0.5 kb insert, reporter vectors carrying the insert with deletions of approximately 100 bp sequences were generated and tested for activity in the BAFF-R-expressing RAMOS and Loukes cell lines (Fig. 3C). In the Loukes line, each of the five deletion reporters showed a decline in luciferase activity, with the greatest drop in the reporter lacking the 128 bp region just 6 bp upstream of the start codon, which spanned from 88 bp upstream to 40 bp downstream of the TSS. In the RAMOS line, only the two reporters that deleted the two most gene-proximal regions showed a significant drop in activity from the complete −0.5 kb reporter, and once again, the greatest drop was imparted by the loss of the 128 bp adjacent to the gene’s coding sequence.
In complementary studies performed in BAFF-R-non-expressing plasma cell lines, ALMC-1 and KAS-6/1 (Fig. 3A), generated from a primary amyloidosis and a myeloma patient, respectively, the reporters were also informative. In these cells, none of the transfected constructs displayed a significant increase in reporter activity (Fig. 3B). To the contrary, the −1.0 kb reporter in the ALMC-1 line demonstrated a significant decrease in promoter activity compared to the empty reporter vector.
DNase protection reveals protein-bound sequences within the putative promoter that contain potential transcription factor binding sites
DNase protection (footprinting) assays were performed on probes covering the entirety of the proximal putative promoter region and incubated with nuclear extracts made from tonsillar or peripheral blood B cells expressing BAFF-R. Representative excerpts from two of these assays shown in Fig. 4 highlight several protected regions, which demonstrate a disproportionate loss in digested fragments as the protein concentration is increased. The protected sites exemplified here point to regions that are likely bound by transcription factor complexes in vivo, but protect against DNase only weakly and are thus difficult to distinguish. The weakness of protection is manifested in Fig. 4 by the somewhat subtle relative depletion of the relevant bands to the surrounding bands. While a variation of the assay employing purified transcription factor proteins may produce more robust and finely delineated protected sites, such an experimental permutation abandons the transcription factor neutrality that is the assay’s greatest asset; this footprinting assay’s central strength is in its ability to uncover native polynucleotide sequences with significant affinity to nuclear proteins without the predictive bias imposed by the probe selection of EMSAs or the antibody pre-selection requisite of ChIP. Sites that demonstrated protection in at least three repetitions of the experiment are summarized in Table IV. In silico analysis of these protected sequences with the online transcription factor binding site search tool P-Match revealed the overlap of these protected sites with numerous common transcription factors (Table V). Of note, this algorithm identified numerous possible c-Rel binding sites overlapping the protected sequences. Furthermore, stringent analysis of interspecies homology, i.e., at least 5 sequential base pairs matching the sequence perfectly, represented by shading of the histogram, overlapped with the protected sites at +20 to +10 and at −69 to −85 (Fig. 5A).
FIGURE 4. DNase protection assay.

Using probes generated from the pGL3-Basic constructs created for the reporter assays in conjunction with various primary cell nuclear B cell extracts (tonsillar, peripheral blood, and splenic B cells, in repetitions of the assay), footprinting regions were identified as those which faded more quickly than surrounding bands as the DNase and protein concentration were adjusted. These footprints are noted by the solid black arrows to the right of the lanes. The far left band is a GA tracker, showing the locations of guanine and adenine bases within the sequence. The concentration of DNase during treatment is noted above, while protein concentration is noted with the wedges of increasing concentration at 0, .013, .065, and .13 mg/mL nuclear extract. A and B, Excerpts from representative exposures of two different probes following DNase digestion, probes spanning regions from −676 to −193 and −243 to +40 relative to the TSS, respectively.
TABLE IV.
DNase-protected sequences.
| 5′ | 3′ | Sequence, 5′--> 3′ |
|---|---|---|
| −354 | −302 | CGAGGCAGGTGGATCACGAGGTCAGGAGTTCAAAACCAGTCTGACCAAGATGG |
| −284 | −264 | TAAAAATACAAAAATTAGCCG |
| −254 | −236 | GTGGGCGCCTACAATCTCA |
| −231 | −224 | CTCGGGAG |
| −212 | −205 | GAATTGTT |
| −85 | −69 | AGCTCGGTCCCACCCA |
| −26 | −3 | GCTTCCTCCCCGAGGGCCCCGGAG |
| 10 | 20 | TCAGTCCCCGC |
| 26 | 32 | GTGCGGC |
Sites protected from DNase by B cell nuclear extracts in at least three experiments. The sites of protection are numbered by their position upstream of the TNFRSF13C coding sequence and their identity in standard 5′to 3′ notation.
TABLE V.
Predicted transcription factor binding sites within the protected sequences.
| 5′ | 3′ | Number of Predicted Transcription Factor Binding Sites within the Protected Sequence | |||||||||||||
|---|---|---|---|---|---|---|---|---|---|---|---|---|---|---|---|
| AP-4 | AREB6 | ARP-1 | CREB | c-Rel | E47 | Elk-1 | HLF | NF-E2 | B (p50) κ NF- | 1 α ROR | RREB-1 | ZID | |||
| Location of Protected Sites Relative to the TSS | −354 | −302 | - | 1 | 1 | 3 | 9 | - | - | 1 | 1 | - | 1 | - | - |
| −284 | −264 | - | - | - | - | 2 | - | - | - | - | - | - | - | - | |
| −254 | −236 | - | - | - | 1 | 3 | - | - | - | 1 | - | - | - | 1 | |
| −231 | −224 | - | - | - | - | 1 | - | - | - | - | - | - | - | - | |
| −212 | −205 | - | - | - | - | 1 | - | - | - | - | - | - | - | - | |
| −85 | −69 | - | - | - | - | - | - | - | - | - | - | - | 1 | - | |
| −26 | −3 | - | - | - | - | 6 | - | 1 | - | - | - | - | - | - | |
| +10 | +20 | 1 | - | - | 1 | 1 | - | - | - | - | - | - | - | - | |
| +26 | +32 | - | - | - | - | - | - | - | - | - | - | - | - | - | |
The chart depicts the number of transcription factor binding sites that overlap at all with the DNase protected sequences summarized in Table IV. The sites were identified with P-Match (gene-regulation.org) using an algorithm that filters for vertebrate transcription factors and minimizes false negatives. Only the human transcription factor binding sites are shown below.
FIGURE 5. EMSAs in the region of greatest promoter activity.

A, VISTA Browser graphs showing percent homology of the horse (upper) and mouse (lower) genomes to the human genome, which is acting as the baseline. The region shown to have the greatest promoter activity based on the luciferase reporters, from +40 to −88 bp (relative to the TNFRSF13C TSS) is shown. The values of the histograms are calculated based on sequences of 100 bp. Sequence lengths ≥5 bp with 100% sequence conservation, i.e. at least 5 consecutive bases that exactly match the human genome, are indicated by shading. As in Fig. 2B, the color of the shading corresponds to the coding, non-coding, or untranslated identity of the homologous sequence, labeled above. Beneath the histograms, regions identified by the DNase protection assays are identified in the black bars, while EMSA probes encompassing these sites and covering the entire region are shown in gray. B, EMSAs demonstrating the differential shifts of the probes encompassing the region using nuclear extracts generated from the B (Loukes, RAMOS) and plasma (ALMC-1, KAS-6/1) cell lines. Arrowheads indicate shifts present in the B cell line but not the plasma cell line extracts.
EMSAs demonstrate differential binding in BAFF-R-expressing cell lines
EMSA probes covering the entirety of the region of greatest promoter activity were incubated with nuclear extracts from the BAFF-R-expressing B cell lines and the BAFF-R-non-expressing plasma cell lines (Fig. 5B). Each shift indicates a protein:DNA complex and a specific interaction between the proteins within the nuclear extract and the probe sequence. Shifts specific to only the BAFF-R-expressing lines were identified in the +22 — +1, −49 — −68, and −69 — −88 probes. While the two latter probes showed the addition of a single band in the assay, the +22 — +1 probe showed multiple additional bands absent in the malignant plasma cell lines.
Among the probes without additional bands in the BAFF-R-expressing lines, most of the bands present were shared among all four lines, and none showed particularly prominent bands in the non-expressing lines over the BAFF-R-expressing lines. The −1 — −27 probe, which contains the sequence adjacent and 5′ to the TSS, stands out as unusual for the presence of multiple, dark bands and significant smearing, though not for showing differential shifts. This prominent result may be attributable to the presence of promiscuous binding sites with high affinity for the machinery that initiates transcription, but not the lineage-specific factors responsible for differential expression.
Point mutation reporters reveal a specific site with powerful promoter activity
Following the more detailed analysis of the adjacent region with DNase protection assays, stringent interspecies homology conservation, and EMSAs, two additional reporters were generated to interrogate specific conserved sites. The two sites both contained a cytosine conserved across the human, murine, and equine genomes that overlapped with a region of DNase protection and electrophoretic mobility shift specific to the BAFF-R-expressing lines. These cytosines, at −75 and +17, occur within sequences of similar structure, 5′-CTCGGTCCCA-3′ and 5′-CTCAGTCCCC-3′, respectively, with the latter sequence in the 5′ untranslated region (UTR) identified by transcription factor search tool P-Match as a possible c-Rel binding site. The c-Rel consensus sequence is NGGNNWTTCC (23), which imparts the selected cytosine the significance of occurring at a conserved site within a possible transcription factor binding site. The two mutant reporters use the same −0.5 kb TNFRSF13C insert but have a point mutation at the conserved cytosines, −75C>G and +17C>G.
The +17C>G mutant reporter demonstrated an insignificant change or increase in luciferase activity in the cell lines, while the −75C>G mutant reporter demonstrated a clear, significant decrease in the RAMOS line and a trend toward lower activity in the Loukes line, though the drop in activity did not achieve a p<.05 level of significance (Fig. 6). In these assays, the reporter lacking the proximal promoter region altogether, Δ( −88/+40), which lacks both of the mutated sites, still had a more dramatic drop in activity than the mutants, though a large proportion could be attributed to the loss of binding at the −75 site.
ChIP reveals in vivo interactions between the putative TNFRSF13C promoter and NF-κB subunit c-Rel
Since current literature (5, 9), the DNase protection assays (Fig. 4, Table IV), interspecies homology (Fig. 5A), and EMSA analysis (Fig. 5B) were all consistent with c-Rel playing a role in regulating the TNFRSF13C gene through upstream binding sites, we sought to investigate the role of c-Rel in vivo. We first wished to determine whether c-Rel was differentially expressed in BAFF-R vs non-BAFF-R expressing B cell lines and to do this, we used Western blot analysis (Fig. 7A). Of interest, the blot clearly showed significant expression of c-Rel in the nuclear extracts from B cell lines and primary B cells and its lack in the BAFF-R-non-expressing cell lines. We followed this initial experiment with ChIP assays, which reveal the presence of physical in vivo interactions between a protein and a specific sequence. In this case, we used an anti-c-Rel antibody, an antibody to the B cell-specific factor Pax5, and an isotype control antibody to immunoprecipitate chemically cross-linked protein-bound DNA from the BAFF-R-expressing RAMOS cell line. The ChIP assay revealed that the nearest amplified region showed enrichment following c-Rel immunoprecipitation (IP, greater than six times the amount relative to control Ab IP, Fig. 7B). Regions more distal to the TNFRSF13C gene were largely unenriched. Only two other regions showed any notable degree of enrichment: the most proximal region following Pax5 IP, and the region 1633 to 1996 bp upstream of TNFRSF13C following c-Rel IP. In both cases, the enrichment narrowly exceeded a two-fold change.
FIGURE 7. c-Rel binds TNFRSF13C genomic DNA endogenously and affects BAFF-R expression in B cell lines.

A, Western blot of the nuclear extracts of the plasma and B cell lines as well as normal primary peripheral blood (PB) B cells. Extracts were blotted for c-Rel and for Histone H1 as a nuclear control. B, Chromatin immunoprecipitation (ChIP) of the region upstream of the BAFF-R gene with c-Rel and Pax5 antibodies prepared from RAMOS cells. The enrichment values represent amounts relative to the amount of chromatin in the non-specific polyclonal Ab IP. C, Following c-Rel knockdown in Loukes and RAMOS cells with c-Rel-specific siRNA or GC-content-matched non-specific control siRNA, c-Rel and BAFF-R mRNA were measured with qRT-PCR. Amounts were calculated according to the ΔΔCT method compared to 18S rRNA and normalized to expression in the cells treated with the GC-content control non-specific siRNA. Asterisks indicate a significant change in gene expression in the test c-Rel siRNA compared to control non-specific siRNA, p < 0.05, in three replicates.
Gene silencing implicates c-Rel in the expression of TNFRSF13C
Following the ChIP assay, which indicated an in vivo interaction between c-Rel and the TNFRSF13C promoter region, we knocked down c-Rel expression through transient transfection with specific siRNA. Two days after transfection, the Loukes cells showed a significant drop in both c-Rel and BAFF-R mRNA by qRT-PCR. While the RAMOS knockdown did not achieve statistical significance, the expression of c-Rel and BAFF-R in these cells recapitulated the more dramatic trend exhibited by the Loukes cells; a drop in c-Rel expression was accompanied by a drop in BAFF-R expression.
Discussion
Explorations into the role of the BAFF:BAFF-R axis in B cell homeostasis have spurred investigations into the control of BAFF levels as a means to alter and understand humoral immunity. However, a complete model of the axis and its place in the immune system must also explore control at the receptor level. Thus, alterations on the receptor side may be as responsible as ligand levels for significant immune deviations, from autoimmunity to immune deficiency. Furthermore, investigations into receptor regulation may reveal ways that malignant cells of the B lineage dysregulate BAFF-R expression to exploit this survival pathway in a pathological way.
The point at which BAFF-R first appears on the surface of human B cells is a crucial element in understanding the way B cells regulate BAFF-R expression. Thus, the timing of this receptor’s emergence on the cell surface reveals clues as to the identity of relevant transcription factors and as to whether expression requires a BCR-dependent signal. However, there have been no reports to this point demonstrating the initial expression of BAFF-R in human B cells. For the first time, our studies reveal through surface staining that BAFF-R expression on developing human B cells is similar to that of murine B cells, which first express this receptor at the immature stage, after they have generated a complete BCR and before leaving the bone marrow (5). The absolute absence of BAFF-R on earlier precursors suggests that a complete BCR positively regulates BAFF-R expression, while the only minor shift in BAFF-R expression in the immature B population represents either a slight induction of expression in the whole population or a subgroup of BAFF-R+ cells within the immature pool. In the latter case, the emergence of a BAFF-R+ subset may represent a transitional population prepared to successfully navigate a BAFF-dependent selection process. In either case, the timing of expression highlights the role of transcription factors that are characteristic of only the last stages of B cell development and of B cell maturity in the positive regulation of the TNFRSF13C gene.
In silico analysis comparing the mouse and human genomes revealed homology within the coding elements of the gene and within a non-coding gene-adjacent region of high homology, but no upstream sequences within 2 kb that met the stringent 70%/100bp homology criteria. The reporter constructs we generated to probe the region’s promoter activity singled out the proximal (<500 bp) homologous region and divided the 2.5 kb upstream sequence into digestible parts. It has not escaped our notice that there is also homology within the 3′UTR. Preservation within the distal 3′UTR raises the tantalizing possibility that BAFF-R expression is regulated post-transcriptionally through alterations in mRNA stability or through microRNA (miR) binding. The miR searching algorithm at microrna.org (Memorial Sloan-Kettering Cancer Center) reveals several preserved possible miR target sites, including sites for hsa-mir-511, -515-3p, and -664, which do not yet have established regulatory functions.
In contrast to the well-documented and significant role BAFF-R plays in B lymphocyte survival, transcriptional regulation of the TNFRSF13C gene has not been extensively studied. Indeed, there has been only one prior report investigating the promoter of this gene (24). Of note, the scope of this work was very limited and the main finding emerging from this study was that the sequence from −1420 to +261 might contain a core promoter region responsive to cytokine stimulation. In this regard, our finding that promoter activity was highest in BAFF-R expressing B cell lines when using a reporter construct that included approximately 2.5 kb upstream of the start site of transcription is consistent with their results. However, our study goes well beyond the work by Yuan et al. (24) and makes a number of novel observations including delineation of initial BAFF-R expression during human B cell development, identification of the mechanism underlying extinction of plasma cell BAFF-R expression, and analysis and identification of key transcription factor binding motifs within the 5′ proximal sequence.
Our decision to focus on the −0.5 kb promoter was prompted by our observations that there was a consistent jump in reporter activity in both BAFF-R-expressing lines with even the shortest (−0.5 kb) insert. To begin to explore in greater depth this putative gene-adjacent region of clear regulatory significance, we employed the DNase protection assay. The DNase protection assays revealed the sequences within the putative promoter region with high affinity for proteins enriched in the nucleus of mature B cells, i.e., the cells that comprise the majority of the BAFF-R-expressing population. By combining these data with a computational analysis of the same region using P-Match, an online resource at gene-regulation.org that queries the TransFac database, the footprints revealed loci that contain and overlap with sites for c-Rel and several other transcription factors. While long stretches of the probed region lack protected sites entirely, others, particularly adjacent to the gene and in the region about 300 bp upstream, contain a high concentration of protected sequences that likely represent the regions of greatest regulatory control. Reconciling these data with the interspecies homology analysis suggests that it is the most proximal region that both binds nuclear factors and has been preserved during recent evolutionary developments.
Deletion reporters derived from the −0.5 kb reporter imparted finer precision to the identity of the positive regulatory components of the TNFRSF13C promoter. While the activity of the reporters in which the two most proximal regions were deleted showed a significant drop in both the Loukes and RAMOS cells, it was the most proximal deletion that showed the single largest decline. These data suggest that the 500 bp adjacent to the gene’s coding region contain multiple positive regulatory elements, but the most powerful of them are found within the region less than 90 bp upstream of the TSS. In the case of the RAMOS cells, one could attribute the bulk of the promoter activity of the −0.5 kb promoter to this most proximal region, as its absence renders its activity indistinguishable from the empty reporter.
EMSAs using probes encompassing the region of greatest promoter activity revealed three sequences that contain sites specifically bound by proteins found in the BAFF-R-expressing cells’ nuclear extracts but not in the nuclear extracts of the non-expressing cell lines, at +22 — +1, −49 — −68, and −69 — −88. Of these sites, both +22 — +1 in the 5′UTR and −69 — −88 overlap with sequences perfectly preserved in the human, murine, and equine genomes. Furthermore, the preserved site within the +22 — +1 probe overlaps with a putative c-Rel binding site identified by P-Match that shares sequence similarity to a site in the −69 — −88 probe.
To interrogate the significance of the specific sites identified by both the in vitro and in silico tools, mutant reporters that obliterate these proposed sites with C>G transversions were tested in the BAFF-R expressing RAMOS and Loukes lines. Only the −75C>G caused a loss of promoter activity, though not as large a reduction as caused by a deletion of the entire vicinity as in the −0.5 kb Δ(−88/+40) reporter. This drop in activity, generated from a single point mutation, shows the significant positive regulatory power of that site.
The above analyses combined with published evidence and our own unpublished data of the transcription factor expression that coincides with BAFF-R expression implicate several potential regulators. However, the recent evidence for c-Rel’s direct role in BAFF-R expression (5, 9) suggest that this NF-κB family member is uniquely positioned to control BAFF-R expression. The ChIP assay testing the endogenous binding of this factor and Pax5, a well-established B cell master regulator, to the genomic region upstream of TNFRSF13C showed that, indeed, c-Rel is bound to this promoter site in vivo. The accompanying silencing assays show that the loss of c-Rel in these cell lines is accompanied by a similar loss of BAFF-R expression.
Finally, our study also reveals novel insight into down-regulation of BAFF-R expression on plasma cells. Thus, we have used well-characterized myeloma cell lines as models of plasma cells to further pursue why myeloma/plasma cells lack BAFF-R expression. At the time of onset of these studies, it was conceivable that BAFF-R expression was actively suppressed to allow transition into a cell that only expressed the BAFF-binding receptor, BCMA (16). However, we clearly show in this study that there was an essentially complete absence of BAFF-R reporter activity in the plasma cell lines suggesting that the sequence contained within this region, in addition to conferring a positive regulatory signal to B cells through transcriptional promotion, can successfully extinguish BAFF-R expression in plasma cell lines through its selective use of the transcription factor network. The plasma cells need not rely on CpG methylation, histone modification, or post-transcriptional control, since the promoter sequence, itself, even without these mechanisms, abrogates target gene expression. It should be noted that these observations, however, appear to conflict with the work by Yuan et al. (24) as these investigators reported no differences between the B (Raji) and myeloma (KM3) lines that they tested. This rather limited foray into promoter characterization may have suffered from the inclusion in the reporter of the entirety of the gene’s first exon and a portion of the first intron, effectively eliminating the appropriate endogenous regulation by physically distancing the promoter from the target gene. Furthermore, in contrast to normal plasma cells and the myeloma lines that we tested, the KM3 line has been shown to both express BAFF-R and to lack surface BCMA (24), which makes it particularly ill-suited to these comparisons.
In summary, while there are numerous reports in the literature that have repeatedly and clearly demonstrated that BAFF-R delivers an essential survival signal to B cells during development, the transcriptional mechanisms that allow B cells to control the expression of this receptor have to this point been largely unexplored. Our study has defined essential elements of the TNFRSF13C promoter, a coordinator of transcriptional control at the heart of the B cell survival axis from the final stages of ontogeny until the B cell loses BAFF-R expression upon terminally differentiating into an antibody-secreting plasma cell. In a hematopoietic context, these regulatory mechanisms may prove to be critical components of B cell selection and thus reveal necessary mediators of effective humoral immune response generation and autoimmune pathogenesis. Furthermore, targeting this survival receptor’s expression may prove to be a useful weapon in the chemotherapeutic arsenal against mature B cell malignancies.
Acknowledgments
This work was supported by the National Institutes of Health CA105258 and CA062242 (awarded to DFJ).
We thank Renee Tschumper for experimental assistance and advice, as well as Dr. Kay Medina and Dr. Larry Pease for their illuminating discussion, reagents, and the gracious use of their laboratory facilities.
Abbreviations used in this paper
- BAFF
B cell activating factor of the TNF superfamily
- BAFF-R
BAFF-receptor
- BM
bone marrow
- ChIP
chromatin immunoprecipitation
- IP
immunoprecipitation
- LC
light chain
- qPCR
real-time quantitative PCR
- qRT-PCR
real-time quantitative RT-PCR
- siRNA
small interfering RNA
- miR
microRNA
- TBE
Tris/Borate/EDTA
- TSS
transcriptional start site
- UTR
untranslated region
Footnotes
Disclosures
The authors have no financial conflict of interest to disclose.
References
- 1.Moore PA, Belvedere O, Orr A, Pieri K, LaFleur DW, Feng P, Soppet D, Charters M, Gentz R, Parmelee D, Li Y, Galperina O, Giri J, Roschke V, Nardelli B, Carrell J, Sosnovtseva S, Greenfield W, Ruben SM, Olsen HS, Fikes J, Hilbert DM. BLyS: member of the tumor necrosis factor family and B lymphocyte stimulator. Science. 1999;285:260–263. doi: 10.1126/science.285.5425.260. [DOI] [PubMed] [Google Scholar]
- 2.Schneider P, MacKay F, Steiner V, Hofmann K, Bodmer JL, Holler N, Ambrose C, Lawton P, Bixler S, Acha-Orbea H, Valmori D, Romero P, Werner-Favre C, Zubler RH, Browning JL, Tschopp J. BAFF, a novel ligand of the tumor necrosis factor family, stimulates B cell growth. J Exp Med. 1999;189:1747–1756. doi: 10.1084/jem.189.11.1747. [DOI] [PMC free article] [PubMed] [Google Scholar]
- 3.Yan M, Brady JR, Chan B, Lee WP, Hsu B, Harless S, Cancro M, Grewal IS, Dixit VM. Identification of a novel receptor for B lymphocyte stimulator that is mutated in a mouse strain with severe B cell deficiency. Curr Biol. 2001;11:1547–1552. doi: 10.1016/s0960-9822(01)00481-x. [DOI] [PubMed] [Google Scholar]
- 4.Schiemann B, Gommerman JL, Vora K, Cachero TG, Shulga-Morskaya S, Dobles M, Frew E, Scott ML. An essential role for BAFF in the normal development of B cells through a BCMA-independent pathway.[see comment] Science. 2001;293:2111–2114. doi: 10.1126/science.1061964. [DOI] [PubMed] [Google Scholar]
- 5.Stadanlick JE, Kaileh M, Karnell FG, Scholz JL, Miller JP, Quinn WJ, 3rd, Brezski RJ, Treml LS, Jordan KA, Monroe JG, Sen R, Cancro MP. Tonic B cell antigen receptor signals supply an NF-kappaB substrate for prosurvival BLyS signaling. Nat Immunol. 2008;9:1379–1387. doi: 10.1038/ni.1666. [DOI] [PMC free article] [PubMed] [Google Scholar]
- 6.Cancro MP, Kearney JF. B cell positive selection: road map to the primary repertoire? J Immunol. 2004;173:15–19. doi: 10.4049/jimmunol.173.1.15. [DOI] [PubMed] [Google Scholar]
- 7.Levine MH, Haberman AM, Sant’Angelo DB, Hannum LG, Cancro MP, Janeway CA, Jr, Shlomchik MJ. A B-cell receptor-specific selection step governs immature to mature B cell differentiation. Proc Natl Acad Sci U S A. 2000;97:2743–2748. doi: 10.1073/pnas.050552997. [DOI] [PMC free article] [PubMed] [Google Scholar]
- 8.Wang H, Clarke SH. Evidence for a ligand-mediated positive selection signal in differentiation to a mature B cell. J Immunol. 2003;171:6381–6388. doi: 10.4049/jimmunol.171.12.6381. [DOI] [PubMed] [Google Scholar]
- 9.Castro I, Wright JA, Damdinsuren B, Hoek KL, Carlesso G, Shinners NP, Gerstein RM, Woodland RT, Sen R, Khan WN. B cell receptor-mediated sustained c-Rel activation facilitates late transitional B cell survival through control of B cell activating factor receptor and NF-kappaB2. J Immunol. 2009;182:7729–7737. doi: 10.4049/jimmunol.0803281. [DOI] [PMC free article] [PubMed] [Google Scholar]
- 10.Osmond DG. The turnover of B-cell populations.[see comment][erratum appears in Immunol Today 1993 Feb;14(2):68] Immunol Today. 1993;14:34–37. doi: 10.1016/0167-5699(93)90322-C. [DOI] [PubMed] [Google Scholar]
- 11.Grumont RJ, Gerondakis S. The subunit composition of NF-kappa B complexes changes during B-cell development. Cell Growth Differ. 1994;5:1321–1331. [PubMed] [Google Scholar]
- 12.Grumont RJ, I, Rourke J, Gerondakis S. Rel-dependent induction of A1 transcription is required to protect B cells from antigen receptor ligation-induced apoptosis. Genes Dev. 1999;13:400–411. doi: 10.1101/gad.13.4.400. [DOI] [PMC free article] [PubMed] [Google Scholar]
- 13.Grossmann M, Metcalf D, Merryfull J, Beg A, Baltimore D, Gerondakis S. The combined absence of the transcription factors Rel and RelA leads to multiple hemopoietic cell defects. Proc Natl Acad Sci U S A. 1999;96:11848–11853. doi: 10.1073/pnas.96.21.11848. [DOI] [PMC free article] [PubMed] [Google Scholar]
- 14.Grossmann M, O’Reilly LA, Gugasyan R, Strasser A, Adams JM, Gerondakis S. The anti-apoptotic activities of Rel and RelA required during B-cell maturation involve the regulation of Bcl-2 expression. Embo J. 2000;19:6351–6360. doi: 10.1093/emboj/19.23.6351. [DOI] [PMC free article] [PubMed] [Google Scholar]
- 15.Tardivel A, Tinel A, Lens S, Steiner QG, Sauberli E, Wilson A, Mackay F, Rolink AG, Beermann F, Tschopp J, Schneider P. The anti-apoptotic factor Bcl-2 can functionally substitute for the B cell survival but not for the marginal zone B cell differentiation activity of BAFF. Eur J Immunol. 2004;34:509–518. doi: 10.1002/eji.200324692. [DOI] [PubMed] [Google Scholar]
- 16.Darce JR, Arendt BK, Wu X, Jelinek DF. Regulated expression of BAFF-binding receptors during human B cell differentiation. J Immunol. 2007;179:7276–7286. doi: 10.4049/jimmunol.179.11.7276. [DOI] [PubMed] [Google Scholar]
- 17.Mackay F, Tangye SG. The role of the BAFF/APRIL system in B cell homeostasis and lymphoid cancers. Curr Opin Pharmacol. 2004;4:347–354. doi: 10.1016/j.coph.2004.02.009. [DOI] [PubMed] [Google Scholar]
- 18.Mackay F, Sierro F, Grey ST, Gordon TP. The BAFF/APRIL system: an important player in systemic rheumatic diseases. Curr Dir Autoimmun. 2005;8:243–265. doi: 10.1159/000082106. [DOI] [PubMed] [Google Scholar]
- 19.Westendorf JJ, Ahmann GJ, Greipp PR, Witzig TE, Lust JA, Jelinek DF. Establishment and characterization of three myeloma cell lines that demonstrate variable cytokine responses and abilities to produce autocrine interleukin-6. Leukemia. 1996;10:866–876. [PubMed] [Google Scholar]
- 20.Arendt BK, Ramirez-Alvarado M, Sikkink LA, Keats JJ, Ahmann GJ, Dispenzieri A, Fonseca R, Ketterling RP, Knudson RA, Mulvihill EM, Tschumper RC, Wu X, Zeldenrust SR, Jelinek DF. Biologic and genetic characterization of the novel amyloidogenic lambda light chain-secreting human cell lines, ALMC-1 and ALMC-2. Blood. 2008;112:1931–1941. doi: 10.1182/blood-2008-03-143040. [DOI] [PMC free article] [PubMed] [Google Scholar]
- 21.Sambrook J, Russell DW. Molecular cloning : a laboratory manual. Cold Spring Harbor Laboratory Press; Cold Spring Harbor, N.Y: 2001. [Google Scholar]
- 22.Bell MP, Svingen PA, Rahman MK, Xiong Y, Faubion WA., Jr FOXP3 regulates TLR10 expression in human T regulatory cells. J Immunol. 2007;179:1893–1900. doi: 10.4049/jimmunol.179.3.1893. [DOI] [PubMed] [Google Scholar]
- 23.Kunsch C, Ruben SM, Rosen CA. Selection of optimal kappa B/Rel DNA-binding motifs: interaction of both subunits of NF-kappa B with DNA is required for transcriptional activation. Mol Cell Biol. 1992;12:4412–4421. doi: 10.1128/mcb.12.10.4412. [DOI] [PMC free article] [PubMed] [Google Scholar]
- 24.Jiang P, Yueguo W, Huiming H, Hongxiang Y, Mei W, Ju S. B-Lymphocyte stimulator: a new biomarker for multiple myeloma. Eur J Haematol. 2009;82:267–276. doi: 10.1111/j.1600-0609.2008.01203.x. [DOI] [PubMed] [Google Scholar]