
Figure 4.
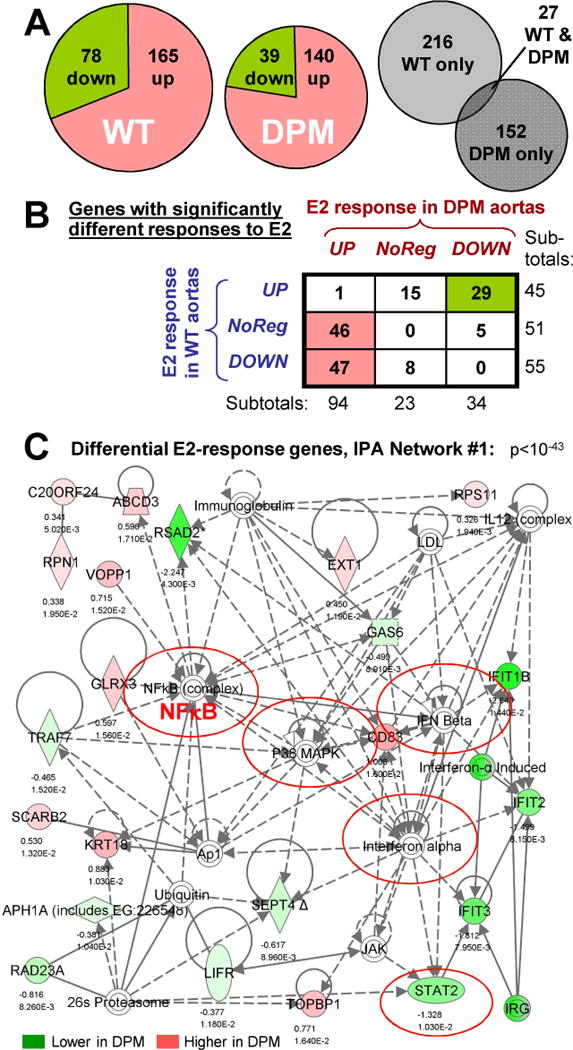
Identification of differentially E2-responsive genes in DPM versus WT by expression microarray. (A) Left & center: Pie charts showing the fraction of up- versus down-regulated genes amongst the 243 or 179 significantly E2-regulated genes in WT or DPM aortas (p<.02, fold-change > 1.25). Right: Venn diagram showing the small fraction of genes that are significantly regulated, in the same direction, by E2 in both WT and DPM mice. (B) Classification of the 151 genes showing significant differential E2 response in DPM versus WT mouse aortas. Rows: response in WT; Columns: response in DPM. (C) Top IPA network for differentially E2-regulated genes between WT and DPM. Solid lines: direct interactions. Dotted lines: indirect interactions. Arrows: regulatory action of one protein on another’s activity or expression. Lines without arrows: protein-protein interactions. Loops: self-regulatory of homo-multimerization events. Genes differentially up- or down-regulated by E2, DPM vs WT, are shown in red and green, respectively, with log2 fold change and p-value below them. Complexes of multiple proteins are indicated by concentric circles. Nodes connected to many differentially-regulated genes indicate proteins that may be involved in the coordinate regulation of these genes.