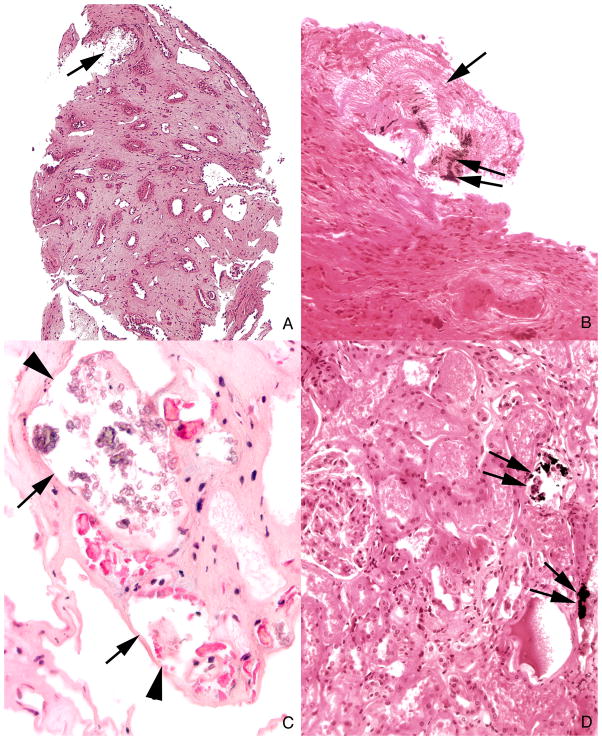
Abstract
We used a combination of intra-operative digital photography and biopsy of the renal papilla and cortex to investigate tissue changes associated with stone formation in 7 patients with ileostomy. Papillary deformity was present in four patients, and was associated with decreased estimated glomerular filtration rate (eGFR). All patients had interstitial apatite plaque, which would be predicted from their generally acid, low volume urines, and two patients had stones attached to plaque. In addition, all patients had plugging of inner medullary collecting ducts (IMCD) and Bellini ducts (BD) with crystal deposits. Despite an acid urine pH, all crystal deposits contained apatite; in addition, five patients had deposits containing sodium acid urate and ammonium acid urate. Stones were composed of either uric acid or calcium oxalate as predicted by urinary levels of supersaturation, however urines generally lacked supersaturation for calcium phosphate as brushite, sodium acid urate, or ammonium acid urate because of low pH, suggesting that local tubular pH exceeds that of bulk urine. Ileostomy patients resemble patients with obesity bypass, in whom IMCD apatite crystal plugs are found, despite low urine pH; however, they are unlike those patients, in having interstitial apatite plaque, as well. IMCD plugging with sodium acid urate and ammonium acid urate has not been found previously, and appears to correlate with formation of uric acid stones.
Keywords: Kidney calculi, ileostomy, calcium oxalate, uric acid, Randall’s plaque, infrared analysis
INTRODUCTION
Patients with ileostomy typically produce a scanty, acidic, sodium-poor urine because of abnormally large enteric losses of water and sodium alkali [1–3]. As a result they often form calcium oxalate (CaOx) and/or uric acid kidney stones even though their urine calcium, uric acid, and oxalate excretions are not themselves remarkably high [4]. Sometimes, renal function may decline because of renal uric acid crystallizations, presumably when increased enteric fluid losses reduce urine volume and pH; this is referred to as acute uric acid nephropathy [5;6]. To date, nothing has been published concerning renal papillary tissue in patients with ileostomy and recurrent renal stones; we present here our findings on 7 such patients.
These patients are an opportunity to test some mechanisms suggested by our prior studies. The common idiopathic CaOx stone former, who has no systemic disease apart from familial (idiopathic) hypercalciuria, deposits apatite plaque in the renal papillary interstitium, and stones grow on papillary surfaces attached to sites of sub-urothelial plaque [7;8]. Interstitial apatite plaque abundance is proportional to urine calcium excretion, and inverse to urine pH and volume [9] so we might expect such plaque in ileostomy patients even in the absence of hypercalciuria. Patients with high urine volumes and pH, such as brushite stone formers [10] and those with renal tubular acidosis [11], do not form plaque, even though they are hypercalciuric. Neither do patients with obesity bypass and enteric hyperoxaluria [7]; the latter have low urine pH but high urine volumes and low urine calcium. Ileostomy or colostomy lower both urine volume and pH so plaque might occur, despite the lack of hypercalciuria in these patients.
We have regularly found intra-tubular deposits of apatite in patients who form phosphate stones [10–12], not an unexpected outcome given that such patients produce an alkaline urine supersaturated with respect to phosphate phases. Cystinuria also leads to such deposits [13], which are found in tubules that are plugged with cystine. Perhaps such local obstruction reduces local acidification leading to an increase in calcium phosphate supersaturation; alkali treatment for prevention of cystine stones could also be a factor. Hyperparathyroid stone disease produces both interstitial plaque and intra-tubular deposits [12], which are reasonable given sustained and severe hypercalciuria which would foster plaque, and a higher than usual urine pH which would foster tubule deposits. However, obesity bypass patients present an anomaly in having tubule apatite deposits with an acid urine pH in which intra-tubular apatite would not be a stable phase [7;14]. For them we have been forced to postulate local tubular loss of acidification as we did for cystinuria.
In ileostomy or colostomy we would expect interstitial apatite plaque from low urine volume and pH, and uric acid deposits in collecting ducts - because of low urine, and collecting duct fluid pH. In particular we would not expect apatite deposits to form within collecting ducts, because tubule fluid must have a low pH that corresponds to the low pH of the final urine; low pH would not support apatite formation. So, in addition to presenting the tissue and clinical results, we are interested in testing these two reasonable predictions in order to clarify mechanisms for plaque and tubule deposits.
RESULTS
Patients
Seven patients (3 female) were studied (Table 1). All had undergone ileostomy and total colectomy for ulcerative colitis (5 patients), Crohn’s disease (patient 2), and cancer (patient 5). Stones were either CaOx or uric acid, and in one subject (patient 6) both were formed. Age at ileostomy ranged from 10 to 58 years, and the interval from ileostomy to our study ranged from 3 to 41 years. Rates of procedures varied from none to as many as 14, the present biopsy not included.
TABLE 1.
CLINICAL CHARACTERISTICS AND SERUM CHEMISTRIES
| Pt | Sex | Age at Colectomy (yr) | Age First Stone (yr) | Prior Stones | Age at Biopsy (yr) | ESWL | PNL | Total Procedures | Serum Creat (mg/dl) | Serum CO2 (mM/L) | Serum K (mM/L) | eGFR (ml/min) |
|---|---|---|---|---|---|---|---|---|---|---|---|---|
| 1 | F | 21 | 31 | >12/2 | 53 | 2/2 | 1/1 | 6/6 | 0.9 | 23 | 4.5 | 70 |
| 2 | M | 10 | 27 | 3/1 | 43 | 1/1 | 1/1 | 5/3 | 1.2 | 25 | 3.4 | 70 |
| 3 | F | 19 | 25 | 10/3 | 58 | 3/0 | 3/2 | 9/3 | 1 | 29 | 4.7 | 61 |
| 4 | F | 20 | 60 | 2 | 61 | 1 | 2 | 5 | 0.8 | 26 | 4.3 | 78† |
| 5 | M | 58 | 59 | 8/6 | 61 | 1/0 | 2/1 | 5/2 | 2.3 | 19 | 5.2 | 31† |
| 6 | M | 36 | 49 | 7/7 | 63 | 6/6 | 1/1 | 15/15 | 1.3 | 28 | 3.8 | 63 |
| 7 | M | 49 | 51 | 1 | 51 | 0 | 1/1 | 1/1 | 0.9 | 26 | 3.6 | 108 |
Prior stones: number of stones/number in PNL kidney; ESWL, extracorporeal shock wave lithotripsy; PNL, percutaneous nephrolithotomy; Total procedures: number procedures/procedures in PNL kidney, includes cystoscopy, open surgery, ureteroscopy as well as ESWL and PNL;. Pt 4 had a history of scleroderma, and patients 6 and 7 had diabetes. eGFR, estimated glomerular filtration rate using MDRD equation,
denotes patients with a prior history of acute renal failure.
Surgical anatomy and renal function
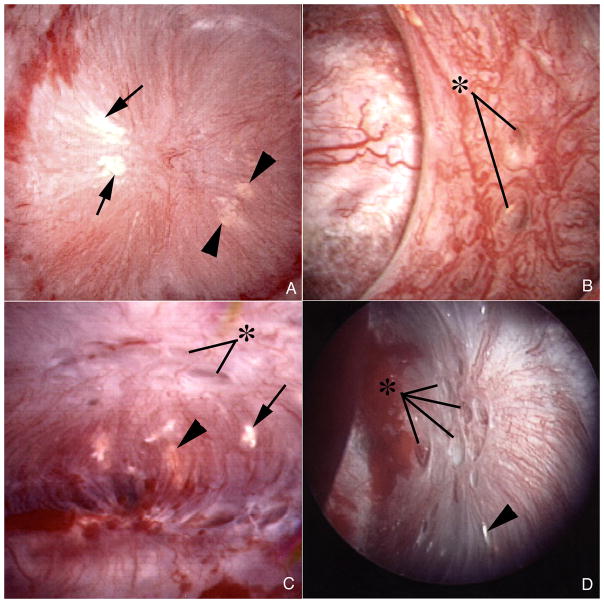
All 7 patients displayed both white (interstitial apatite) plaque (Figure 1A, C and D, Table 2), and yellow (intra-tubular crystal) plaque which was not further quantified (Figure 1A – D). The amounts of white plaque varied widely (% mean papillary surface area, Table 2). The percent of abnormal papillae varied among the patients from 0 to 25% (papillary deformity, Table 2). Some papillae with flattening and retraction also showed dilation of the mouths of ducts of Bellini (BD) (Figure 1D); but dilation and retraction were not well correlated (Table 2, Figure 1B and C).
Figure 1. Endoscopic images of papilla from ileostomy patients with kidney stones.
Papillary morphology of ileostomy patients ranged from a normal conical shape (panels a–c) to flattened and retracted (panel d). Dilated openings (asterisks) to ducts of Bellini were common in both the normal and deformed papilla (panels b–d). Variable amounts of white (arrows) and yellow (arrowheads) plaque were seen separately (panel d) or on the same papilla (panels a and c).
TABLE 2.
SURGICAL AND PATHOLOGICAL FINDINGS AND STONE TYPE
| Pt | Papillary deformity (%) | % Mean Papillary Surface Area | Stones Attached to Plaque | Hydro- nephrosis | Dilated BD | IMCD BD Deposits | Cortical Deposits | Stone Type |
|---|---|---|---|---|---|---|---|---|
| 1 | 0 | 0.5 | No | +++ | ++ | 1±1 | Yes | COM (1) |
| 2 | 0 | 4.16 | No | + | + | 7±1* | No | UA (1) |
| 3 | 10 | 5.16 | No | 0 | ++ | 15±2* | No | UA (1) |
| 4 | 10 | 1.99 | No | 0 | +++ | 26±3* | No | UA (2) |
| 5 | 25 | 1.34 | Yes | +++ | + | 8±1* | No | COM (2) |
| 6 | 10 | 0.93 | No | 0 | ++ | 19±2* | No | UA + CA (6) |
| 7 | 0 | 11.61 | Yes | 0 | + | 9±1 | Yes | COM (1) |
% Papillary deformity refers to the fraction of papillae visualized at the time of surgery with deformity; % Mean papillary surface area, percent of papillary surface covered by white plaque; Stones attached to plaque, stones found attached to papilla on plaque at surgery; Hydronephrosis, degree of renal pelvic dilatation at time of PNL, from mild (+) to marked (+++); Dilated BD, degree of dilatation of Bellini ducts; IMCD/BD, inner medullary collecting duct/Bellini duct, mean number of deposits/mm2 of tissue;
denotes deposits that contained sodium acid urate and ammonium acid urate in addition to apatite; Cortical deposits, crystal deposits found in cortical collecting ducts; Stone type: COM, calcium oxalate monohydrate, UA, uric acid, (number analyzed); UA + CA, patient 6 had one pure UA stone, 2 stones with COM and UA, 2 stones with mixed calcium oxalate (CaOx) and calcium phosphate (CaP), and 1 with CaOx, UA and ammonium acid urate.
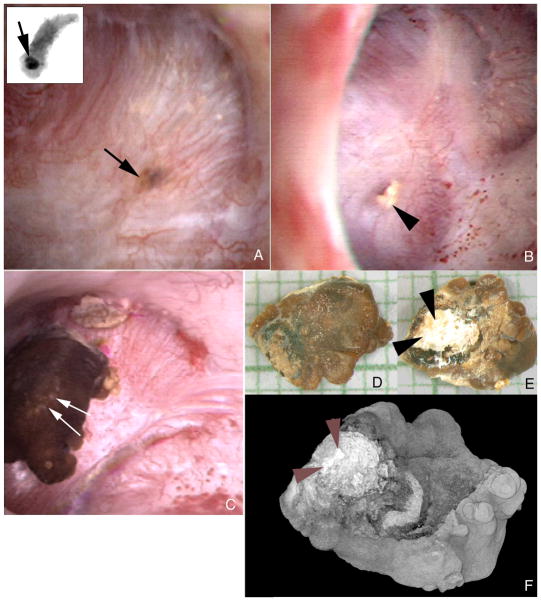
Large crystal deposits were seen beneath the urothelium filling tubular lumens (Figure 2A). Crystals occasionally protrude from dilated BD openings (Figure 2B). On some papillae in two patients (Table 2) CaOx stones were attached to the papillary surface (Figure 2C) and at sites of white plaque (Figure 2D–F). Unattached stones were found in all patients, including these two.
Figure 2. Endoscopic images showing both intraluminal plugs and attached stone in ileostomy patients.
A dark region on the papillary surface (panel a, arrow) marks a large intraluminal deposit deep to the urothelium. The insert at the upper left corner of panel a shows this same intraluminal deposit (arrow) by micro-CT in a biopsy sample removed at the site of the deposit. Mineral plugs protruding from dilated ducts of Bellini (panel b, arrowhead) were common. In addition, several stones were noted attached to sites of Randall’s plaque. Panel c shows such a stone (double arrows). This stone was removed and photographed by light microscopy (panels d and e) and scanned by micro-CT (panel f). The papillary surface of this stone (panels e and f, double arrowheads) reveals a whitish region that was determined to be hydroxyapatite by micro- CT. Magnification, x30 (d and e).
Deformity of papillae (departure from a normal conical smooth appearance) correlated roughly with loss of estimated glomerular filtration rate (eGFR). The patient with the most marked reduction of eGFR (Table 1, patient 5) had the highest percentage of abnormal papillae (Table 2). eGFR values of 61, 78 and 63 ml/min/1.73M2 were found in patients with 10% of papillae abnormal (Table 1 patients 3, 4 and 6). Those with no abnormal papillae had values of 70 or above. Of note, episodes of acute renal failure had occurred in 2 patients (Table 1, patients 4 and 5). On the other hand, we find a striking lack of correspondence between amount of deposit, and frequency of papillary deformity or dilated ducts. Patient 4 (Table 2) with the most prominent duct dilation had the most deposits, but only 10% of papillae were deformed. Patient 1 had almost no IMCD or BD deposits, and no deformed papillae, but had moderate BD dilation; her deposits were mainly in the cortex (Table 2). Of note, only one other patient (Table 2, patient 7) had deposits in the cortex, and he, also, had no deformed papillae. Plaque and attached stones also failed to correlate with each other or with laboratory findings. One of the two patients with an attached CaOx stone (Table 2, patient 7) had very extensive plaque; the other (Table 2, patient 5) with an attached CaOx stone had only modest amounts of plaque.
Although imperfect, we did find traces of our prior association of plaque with high urine calcium and low urine pH and volume (Table 3). Patients 2, 3, and 7 with the most white plaque had very low pH (3 and 7) and/or volume (2 and 3), and ample urine calcium. Patient 4, with modest amounts of plaque, had low urine calcium but also low volume and low pH. Patient 5, with very modest amounts of plaque, had low urine calcium and normal volume, and only low pH as a risk factor for plaque. Patient 1, with the least plaque, had high urine volume and low urine calcium but low urine pH. Patient 6 is the one anomaly; hypercalciuria is marked, pH is low and volume is not remarkably high; plaque abundance, however, is only modest. So, with this one outstanding exception, our patients followed the general pattern we have observed in the past.
TABLE 3.
24 HOUR URINE RESULTS
|
|
|||||||||||||||
|---|---|---|---|---|---|---|---|---|---|---|---|---|---|---|---|
| Pt | VOL | pH | CIT | CA | OX | NA | UA | NH4 | SUL | SS UA | SS CAOX | SS CAP | SS SAU | SS AAU | Wt (kg) |
| 1 | 2.59 | 5.55 | 78 | 71 | 22 | 26 | 208 | 39 | 16 | 0.36 | 2.24 | 0.12 | 0.01 | 0.01 | 90 |
| 2 | 0.53 | 5.54 | 34 | 125 | 17 | 2 | 448 | 56 | 28 | 3.70 | 12.70 | 1.75 | 0.45 | 7.43 | 61 |
| 3 | 0.95 | 5.11 | 53 | 130 | 33 | 68 | 639 | 31 | 28 | 4.71 | 10.90 | 0.30 | 1.28 | 0.43 | 59 |
| 4 | 0.46 | 5.13 | 37 | 26 | 15 | 41 | 141 | 12 | 7 | 2.10 | 7.70 | 0.12 | 0.34 | 0.06 | 44 |
| 5 | 1.85 | 5.33 | 209 | 34 | 50 | 94 | 690 | 38 | 48 | 2.25 | 2.48 | 0.06 | 0.52 | 0.19 | 160 |
| 6 | 1.68 | 5.15 | 884 | 530 | 44 | 169 | 795 | 67 | 70 | 3.12 | 12.50 | 0.76 | 1.08 | 0.35 | 100 |
| 7 | 2.23 | 4.94 | 401 | 180 | 42 | 33 | 771 | 52 | 43 | 2.78 | 7.64 | 0.01 | 0.04 | 0.05 | 84 |
Vol, volume l/d; Cit, citrate, mg/d; Ca, calcium, mg/d; Ox, oxalate, mg/d; Na, sodium, mEq/d; UA, uric acid, mg/d; NH4, ammonium, mEq/d; SUL, sulfate, mEq/d; SS, supersaturation; CAOX, calcium oxalate; CAP, calcium phosphate, SAU, sodium acid urate, AAU, ammonium acid urate. Patients 3, 5, and 6 were taking potassium citrate, and patients 1 and 6 were taking allopurinol.
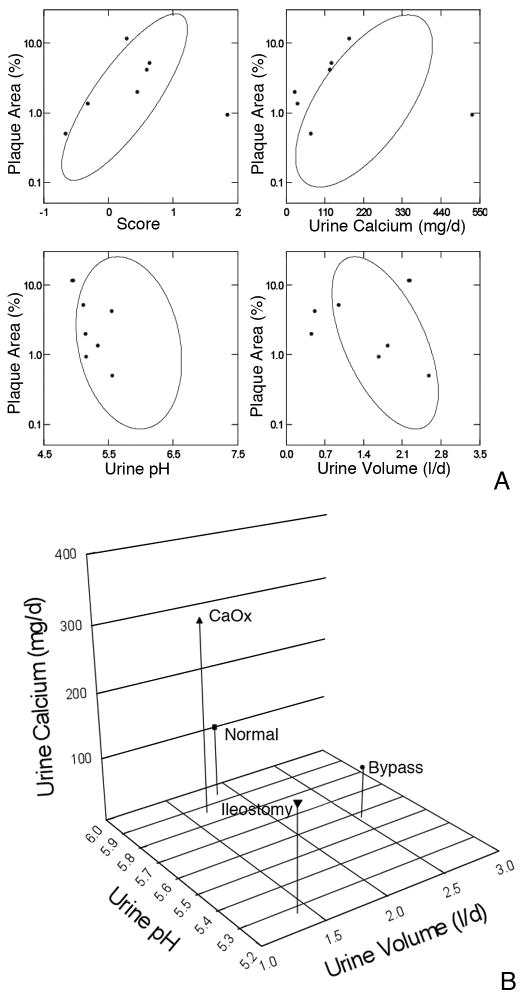
When results from the present patients are over plotted on confidence ellipses from our original report of normal subjects, calcium oxalate stone formers and patients with obesity bypass, the fit for the multivariate score (Figure 3A,) is not unreasonable with one major outlier. For calcium and pH all of the results are at the left extreme of the ellipses; for volume points scatter within and outside the ellipse. The represents, of course, the different mechanisms for plaque in ileostomy: a much lower pH and calcium excretion, and modestly lower volume, than in our original cases (Figure 3B). Given especially the pH divergence, the predictive power of our original ellipses is rather good. Of course, a score calculated with the present data would tend to include the present patients more completely. Biopsy findings
Figure 3. Comparison of present plaque data to our prior reports.
3A: Percent plaque coverage of renal papillae gauged via intra-operative digital imaging (y axes of all 4 panels) varied in our prior reports (9) of normal, idiopathic calcium stone formers and obesity bypass patients as in the elliptical confidence bands shown on each panel. The present 7 patients are over plotted in grey symbols. In general, the patients fall along or within the ellipses. 3B: Compared to our prior study cases ileostomy patients have much lower pH as a predominant cause of plaque, and moderately lower urine volume and calcium excretion. Values are means.
Tubule deposits
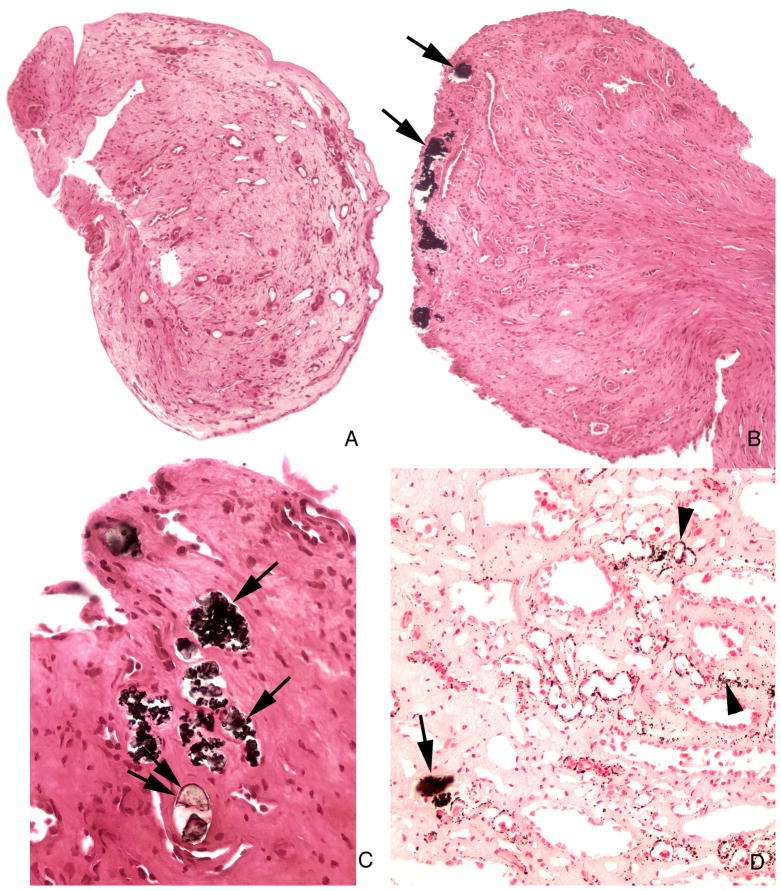
With Yasue stain that highlights calcium based crystals, scattered tubules contained deposits (Figure 4A–D) ranging from small to some large enough to dilate and destroy tubules. Some deposits did not stain with Yasue (Figure 4C) even though crystals were evident microscopically. These Yasue negative crystal deposits were most prominent in BD (Figure 5 A–C). Peritubular fibrosis was more prominent around tubules containing the non-staining vs. the Yasue staining crystals. In two patients (Table 2) Yasue positive deposits were found in cortical collecting ducts (Figure 5D). Some deposits were mixtures of Yasue positive and negative crystals (Table 2). Overall two different kinds of crystals are found, calcium and non-calcium based. Both were seen together in 5 of our patients, but usually they were spatially separated, the calcium deposits in more proximal inner medullary collecting duct (IMCD) segments, the others mainly in distal IMCD and BD.
Figure 4. Histologic images of Yasue stained sections from papillary biopsies from ileostomy patients.
The morphology of the papillary biopsies ranged from a normal architecture without deposits (panel a) to an abnormal appearance characterized by numerous dilated inner medullary collecting ducts and ducts of Bellini filled with Yasue positive (panels b, c and d, arrows) and Yasue negative deposits (panel c double arrows) always associated with a loss of lining cells (arrows) and surrounded by interstitial fibrosis. Sites of interstitial plaque (Randall’s) were noted in the basement membrane of thin loops of Henle (panel d, arrowheads). Magnification, x100 (a and b); x300 (c and d).
Figure 5. Histologic images of tubules with Yasue negative deposits in inner medulla and Yasue positive deposits in cortex.
Panels a and b each show a large deposit in a duct of Bellini (arrow) that is Yasue negative except for a very small region of Yasue positive staining (double arrow). These plugged ducts are generally very dilated, completely filled with mineral, surrounded by interstitial fibrosis and lack tubular lining cells. Several tubules filled with Yasue negative deposits (arrows) are seen at a higher magnification in panel c to show the loss of the tubular lining cells (arrowheads). Panel d shows two cortical collecting ducts stained with Yasue positive deposits (arrows). Magnification, x100 (a); x200 (b); x300 (c); x200 (d).
Nature of tubule and interstitial deposits
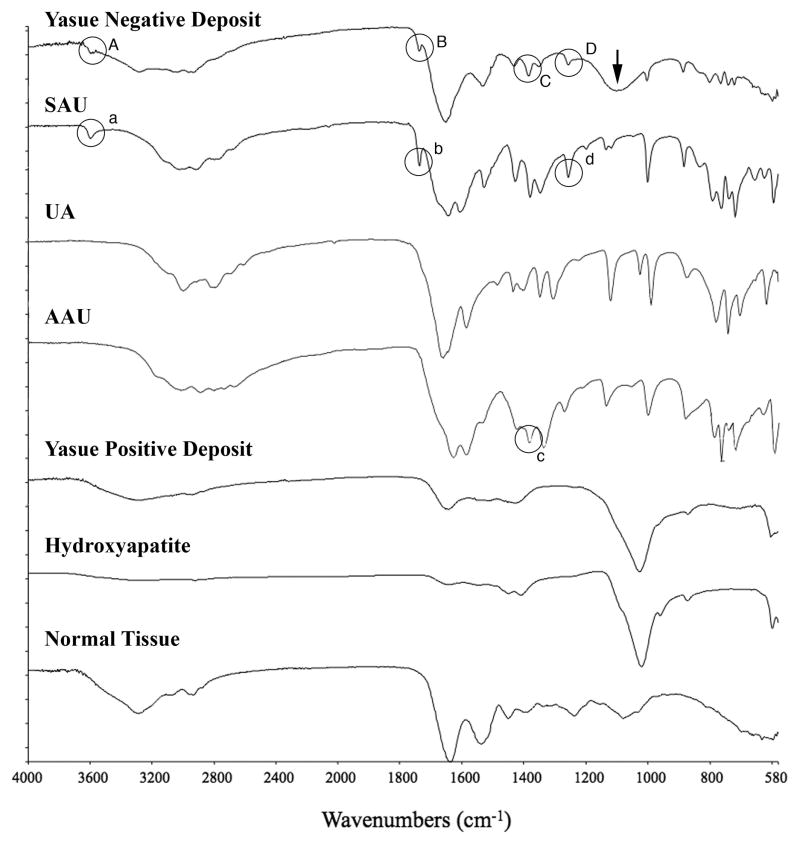
Interstitial plaque was found in all patients, and stained positive with Yasue stain (Figure 4D); by micro-Fourier transform infrared (micro-FTIR) spectroscopy we identified it as hydroxyapatite plaque, identical to the Randall’s plaque we have found in other patients. Yasue positive intra-tubular deposits were also identified as biological apatite (Figure 6), likewise identical to deposits we have described previously. The non-staining deposits, however, most prominent in terminal BD, were identified as a mixture of sodium acid urate and ammonium acid urate (Figure 6). A broad band at about 1100 in the spectrum of the non-Yasue positive deposit is suggestive of phosphate or sulfate. The presence or absence of uric acid could not be determined from the infrared data; uric acid does not display as distinctive a set of bands as do the sodium and ammonium urate salts, and the few that do exist overlap with spectral features of both other salts. So we can say that both sodium and ammonium acid urate salts are present, but we cannot say that uric acid itself is not also present.
Figure 6. Micro-FTIR spectra of Yasue negative and positive crystal deposits in ileostomy patients.
This figure illustrates a series of infrared spectra obtained for a set of standards (sodium acid urate (SAU), uric acid (UA), ammonium acid urate (AAU), and hydroxyapatite, for a site of a Yasue positive deposit in the tissue, for a site of a Yasue negative deposit in the tissue and for the normal tissue with embedding medium. The infrared spectrum of the Yasue negative deposit is consistent with SAU and AAU: Bands A, B and D highlighted by circles in the spectrum for the Yasue negative deposit correspond with bands a, b, and d, at wavenumbers 3598, 1738 and 1257 respectively in the spectrum for SAU. Band C in the spectra for the Yasue negative deposit (highlighted by a circle) corresponds with band c at wavenumber 1385 in the spectrum for AAU. A broad band at about 1100 (arrow) in the Yasue negative spectrum suggests phosphate or sulfate. The infrared spectrum of the Yasue positive deposit is consistent with hydroxyapatite as is obvious by the matching of the large band at about 1,000. Normal tissue has no bands that correspond with those for the standards.
Urine saturations, tubule deposits and stones
Although all 7 patients had intra-tubular apatite deposits, urine was undersaturated with respect to calcium phosphate (as brushite) in all but patient 2 (Table 3), meaning that the precursors of intra-tubular apatite deposits (brushite and octo-calcium phosphate) would not be a stable phase in the bulk urine for any of the other patients. Calculated supersaturation with respect to sodium acid urate was below 1 in all but patients 3 and 6, despite deposits of this phase in tubule lumens of five patients (Tables 2 and 3), and supersaturation with respect to ammonium acid urate was below 1 in all but patient 2. On the other hand urine was supersaturated with respect to uric acid in all but patient 1, and highly supersaturated with respect to CaOx in patients 2, 3, 4, 6, and 7 (Table 3), so that the combinations of uric acid and CaOx stones are reasonably easy to account for. We cannot determine if uric acid itself was present in any of the tubule deposits. Put another way, urine supersaturations match closely with stone composition, but differ from compositions of the tubule deposits.
DISCUSSION
In the main, our patients present the common and expected clinical picture of ileostomy and stones. Stones are CaOx and uric acid, a well described feature [4;15]. Urine is acidic in all cases, and shows generally high uric acid and CaOx supersaturations. These occur because of low volume and pH, for uric acid, and mainly low volume for CaOx. The one overtly hypercalciuric patient had mixed CaOx - uric acid stones, an expected result.
Interstitial apatite plaque was indeed present in all patients, though prominent in only 3 (patients 2, 3 and 7). Two patients had attached CaOx stones growing on their papillae over regions of plaque as in the idiopathic CaOx stone former. These findings confirm our prior ones in that low urine volume and pH would be expected to cause plaque, and high urine supersaturations are present to support CaOx overgrowths.
The intra-tubular deposits, however, are not easy to explain. All patients had IMCD apatite deposits, yet in 6 of the 7 urine was markedly undersaturated with respect to calcium phosphate. This resembles our findings in obesity bypass except that urine pH is even lower in these patients and therefore the presence of universal tubular apatite even more remarkable. The most reasonable assumption is that local tubule fluid pH in some ducts departs radically from that of the bulk urine pH, and is high enough to make apatite a stable phase. We presume tubule cell injury, perhaps from obstruction, crystals, or both have impaired local acidification; this is pure speculation at this time.
This idea is supported by the other surprise: the intra-tubular urate species encountered is not entirely uric acid, which makes up the stones we found, but include sodium acid urate and ammonium acid urate, salts that are stable when urine pH is high enough to assure dissociation of a majority of uric acid – around 6. Urine from the patients with urate deposits was, in all but two cases, markedly undersaturated with respect to sodium acid urate. For ammonium acid urate, supersaturation was present in only 1 patient (Patient 2, Table 3). Presumably the same local loss of normal tubule fluid acidification accounts for the multiple urate salt depositions and the apatite deposition. Whether uric acid is also present is beyond the resolution of the micro FTIR methods we used. If it is or is not present, however, the interpretation concerning intra-tubular pH remains unchanged. In other words, the intra-tubular urate we encountered is not compatible with bulk phase urine saturations, meaning that conditions within tubules that formed urate deposits must differ from those of the final urine. On the other hand, formation of uric acid stones is perfectly compatible with the final urine saturations.
Although urate salts and apatite occurred together in 5 cases, the two crystals were spatially dissociated to some extent. Urate was mainly in BD and distal IMCD, whereas apatite was found only in IMCD. This seems like cystinuria, in which cystine plugs were mainly in BD and apatite in IMCD. Perhaps BD deposits obstruct IMCD leading to loss of normal acidification that promotes apatite. However, IMCD apatite also occurred without urate altogether.
Presumably because of the multiple crystallizations in tubules, these patients, like those with brushite nephropathy, renal tubular acidosis, cystinuria, and hyperparathyroidism, can have considerable papillary scarring and retraction. Renal function, judged by eGFR, can be reduced. Episodes of acute renal failure were not rare, and probably were related to volume depletion and crystallizations; these acute injuries no doubt contributed to the tissue damage we find.
We recognize that our study does not demonstrate how the uric acid stones in patients 2–6 may have formed. We can say that none of the large uric acid stones in these patients were attached anywhere - they were free in the calyces or renal pelvis. Possibly, the tiny deposits in BD were originally uric acid, and were extruded and served as a nidus for formation of clinically significant uric acid stones. Possibly uric acid stones formed in free solution in the calyceal or pelvic urine. Possibly the tiny sodium acid urate and ammonium acid urate deposits BD deposits served as a nidus for uric acid stones.
MATERIALS AND METHODS
Clinical Measurements
Two 24-h urine samples were collected while patients were eating their free choice diet and off medications. In urine we measured volume, pH, calcium, oxalate, citrate, phosphate, uric acid, sodium, potassium, magnesium, sulfate and ammonia using methods detailed elsewhere [16], and calculated supersaturation (SS) with respect to CaOx, brushite, uric acid, sodium acid urate and ammonium acid urate using EQUIL 2 [17]. Routine clinical blood measurements were made on bloods drawn for clinical purposes.
Biopsy protocol and plaque area determination
During PNL all papillae were digitally imaged as described elsewhere [10]. Biopsies were taken from one upper pole, inter-polar and lower pole papillum and from the cortex. Using the intra-operative recordings [9], total surface area of each papilla was measured, and one of us outlined areas of white (Randall’s) plaque as well as the entire papilla on one set of prints. The white plaque and total papillary areas were converted to numbers of pixels, giving the ratio of plaque to total papillary pixels, or percent coverage with plaque. No biopsy site inspected intra operatively displayed significant hemorrhage and no post-operative complications related to the biopsy procedures occurred in any patient. The study was approved by the Institutional Review Board Committee for Clarian Health Partners (#98–073).
Tissue analysis
Light microscopy analysis
Twenty-four papillary and eight cortical biopsies were studied using light microscopy. All biopsy specimens were immersed in 5% paraformaldehyde in 0.1 mol/L phosphate buffer (pH 7.4), and were dehydrated through a series of graded ethanol concentrations to 100% ethanol prior to embedment in a 50/50 mixture of Paraplast Xtra (Fisher) and Peel-away Micro-Cut (Polysciences). Serial sections were cut at 4μ and stained with the Yasue metal substitution method for calcium histochemistry [18], hematoxalin & eosin for routine histological examination. An additional set of serial sections was cut at 7μ for infrared analysis.
Infrared analysis
Reflectance-absorption (R/A) spectra were collected with a Perkin-Elmer Spotlight 400 infrared imaging microscope interfaced to a Perkin-Elmer Spectrum One FTIR spectrometer. The system employed a 100 × 100 m liquid nitrogen cooled mercury cadmium telluride (HgCdTe) detector. Tissue samples were analyzed using an aperture size appropriate to the size of the sample being studied (e.g. 50 to 20μ in diameter). Each spectrum collected represents the average of 64 or 128 individual scans possessing a spectral resolution of 4 cm−1. A clean area on the low-E slide was employed to collect the background spectrum.
Attenuated total internal reflection (ATR) spectra were collected for all tissue samples with a Perkin-Elmer Spotlight 400 infrared imaging microscope interfaced to a Perkin-Elmer Spectrum One FTIR spectrometer. The system employed a 100 × 100 m liquid nitrogen cooled HgCdTe detector. The standard germanium internal reflection element was employed in conjunction with a 100 × 100μ or a 50 × 50μ aperture. Since the ATR measurement is essentially an immersion measurement, the sampled area using these apertures is 25 × 25 m or 12.5 × 12.5μ, respectively. Each spectrum collected represents the average of 64 or 128 individual scans possessing a spectral resolution of 4 cm−1. A clean potassium chloride surface was employed to collect the background spectrum.
Two human kidney stones known to contain uric acid, sodium acid urate or ammonium acid urate as determined by infrared analysis were used to collect control spectra for comparison with spectra collected for tissue deposits. The infrared spectra obtained from these kidney stones were validated by referencing the previous work of Dao and Daudon [19].
μCT analysis
All papillary biopsies underwent μCT analysis with the SkyScan-1072 (Vluchtenburgstraat 3, B-2630 Aartselaar, Belgium) high-resolution desk-top μCT system allowing nondestructive mapping of the location and size of the crystalline deposits within a biopsy specimen. This μCT system can generate a tissue window so that both the mineral deposit and tissue organization are seen at the same time. For this protocol, biopsies are quickly dipped in a 1:10 dilution of Hypaque (50%, Nycomed Inc., Princeton, NJ)/PBS, then coated with a thin layer of paraffin and mounted in the center of a small chuck which is then locked into place in the machine. The sample was positioned in the center of the beam, and the system configuration was set at 35 kV, 209 mA, 180° rotation, with flatfield correction. Images were saved to CD’s and reconstructed with Cone-Reconstruction software by SkyScan. These images were then reconstructed into 3D images with SkyScan’s CTAn + CTVol software. These images allowed us to properly orient each biopsy for future light microscopic analysis. Three separate scans from each patient were used to determine the number of sites of intraluminal deposits per square millimeter, except for patient 5 in which paraffin sections were used.
Acknowledgments
Funded by NIH PO1 DK56788
Footnotes
DISCLOSURE
The authors have no interests to disclose relevant to this publication.
References
- 1.Bambach CP, Robertson WG, Peacock M, Hill GL. Effect of intestinal surgery on the risk of urinary stone formation. Gut. 1981;22:257–263. doi: 10.1136/gut.22.4.257. [DOI] [PMC free article] [PubMed] [Google Scholar]
- 2.Clarke AM, Chirnside A, Hill GL, et al. Chronic dehydration and sodium depletion in patients with established ileostonies. Lancet. 1967;2:740–743. doi: 10.1016/s0140-6736(67)91945-9. [DOI] [PubMed] [Google Scholar]
- 3.Worcester EM. Stones due to bowel disease. In: Coe FL, Favus MJ, Pak CY, et al., editors. Kidney Stones: Medical and Surgical Management. chap 39. Philadelphia: Lippincott-Raven; 1996. pp. 883–903. [Google Scholar]
- 4.Parks JH, Worcester EM, O’Connor RC, Coe FL. Urine stone risk factors in nephrolithiasis patients with and without bowel disease. Kidney Int. 2003;63:255–265. doi: 10.1046/j.1523-1755.2003.00725.x. [DOI] [PubMed] [Google Scholar]
- 5.Randall RE. Urate nephropathy following chronic ileostomy acidosis. Am J Nephrol. 2002;22:372–375. doi: 10.1159/000065230. [DOI] [PubMed] [Google Scholar]
- 6.Conger JD. Acute uric acid nephropathy. Med Clin North Am. 1990;74:859–871. doi: 10.1016/s0025-7125(16)30522-3. [DOI] [PubMed] [Google Scholar]
- 7.Evan AP, Lingeman JE, Coe FL, et al. Randall’s plaque of patients with nephrolithiasis begins in basement membranes of thin loops of Henle. J Clin Invest. 2003;111:607–616. doi: 10.1172/JCI17038. [DOI] [PMC free article] [PubMed] [Google Scholar]
- 8.Evan AP, Lingeman JE, Coe FL, Worcester EM. Role of interstitial apatite plaque in the pathogenesis of the common calcium oxalate stone. Semin Nephrol. 2008;28:111–119. doi: 10.1016/j.semnephrol.2008.01.004. [DOI] [PMC free article] [PubMed] [Google Scholar]
- 9.Kuo RL, Lingeman JE, Evan AP, et al. Urine calcium and volume predict coverage of renal papilla by Randall’s plaque. Kidney Int. 2003;64:2150–2154. doi: 10.1046/j.1523-1755.2003.00316.x. [DOI] [PubMed] [Google Scholar]
- 10.Evan AP, Lingeman JE, Coe FL, et al. Crystal-associated nephropathy in patients with brushite nephrolithiasis. Kidney Int. 2005;67:576–591. doi: 10.1111/j.1523-1755.2005.67114.x. [DOI] [PubMed] [Google Scholar]
- 11.Evan AP, Lingeman J, Coe FL, et al. Renal histopathology of stone-forming patients with distal renal tubular acidosis. Kidney Int. 2007;71:795–801. doi: 10.1038/sj.ki.5002113. [DOI] [PubMed] [Google Scholar]
- 12.Evan AE, Lingeman JE, Coe FL, et al. Histopathology and surgical anatomy of patients with primary hyperparathyroidism and calcium phosphate stones. Kidney Int. 2008;74:223–229. doi: 10.1038/ki.2008.161. [DOI] [PubMed] [Google Scholar]
- 13.Evan AP, Coe FL, Lingeman JE, et al. Renal crystal deposits and histopathology in patients with cystine stones. Kidney Int. 2006;69:2227–2235. doi: 10.1038/sj.ki.5000268. [DOI] [PubMed] [Google Scholar]
- 14.Evan AP, Coe FL, Gillen D, et al. Renal intratubular crystals and hyaluronan staining occur in stone formers with bypass surgery but not with idiopathic calcium oxalate stones. Anat Rec (Hoboken) 2008;291:325–334. doi: 10.1002/ar.20656. [DOI] [PubMed] [Google Scholar]
- 15.Deren JJ, Porush JG, Levitt MF, Khilnani MT. Nephrolithiasis as a complication of ulcerative colitis and regional enteritis. Ann Intern Med. 1962;56:843–853. doi: 10.7326/0003-4819-56-6-843. [DOI] [PubMed] [Google Scholar]
- 16.Parks JH, Goldfisher E, Asplin JR, Coe FL. A single 24-hour urine collection is inadequate for the medical evaluation of nephrolithiasis. J Urol. 2002;167:1607–1612. [PubMed] [Google Scholar]
- 17.Werness PG, Brown CM, Smith LH, Finlayson B. Equil 2: a basic computer program for the calculation of urinary saturation. J Urol. 1985;134:1242–1244. doi: 10.1016/s0022-5347(17)47703-2. [DOI] [PubMed] [Google Scholar]
- 18.Yasue T. Histochemical identification of calcium oxalate. Acta Histochem Cytochem. 1969;2:83–95. [Google Scholar]
- 19.Dao NQ, Daudon M. Infrared and Raman spectra of calculi. Paris: Elsevier; 1997. [Google Scholar]


