Abstract
A challenge in coupling ion-pair chromatography (IPC) on-line with electrospray ionization-mass spectrometry (ESI-MS) is that the nonvolatile ion-pair reagent (e.g., alkyl sulfate for amines or tetrabutylammonium for carboxylic acids) in the mobile phase suppresses the ESI-MS signals in the gas phase and their accumulation can clog the MS sampling interface. Consequently, IPC–ESI-MS is conducted either with a volatile ion-pair reagent, which could compromise the analyte separation efficiency, or with a downstream ion-exchange column to rid the ion-pair reagents of the mobile phase. In the latter approach, the limited capacity of ion-exchange columns requires frequent off-line column regeneration, which affects the separation throughput and prohibits long separations from being performed. A dual-valve, dual-ion exchange column interface of IPC–ESI-MS is designed for undisrupted separations and simultaneous column regeneration. Owing to the efficacy in removing the ion-pair reagent, the detection of eluents of monoamine neurotransmitters by an ion trap MS results in the limits of detection of 0.03 μM for dopamine or DA and 0.01 μM for 5-hydroxytryptamine or 5-HT. These values are lower than those obtained with ion trap MS of similar sensitivity when combined with the use of specialized chromatographic columns or sample preconcentration. Excellent reproducibility was attained with repeatedly regenerated ion-exchange columns (RSD = 4–6%) for an extended period of time (RSD < 6% for six days). DA and 5-HT in rat straital extracts were analyzed and our data demonstrate that interferences inherent in the tissues and the ion-pair reagent have been successfully eliminated. This simple interface should be readily amenable to the separation and MS analysis of other types of polar compounds in complex sample media.
INTRODUCTION
Determination of the distribution of neurotransmitters in animal models and different regions of postmortem human brains is essential for a better understanding of neurodegenerative diseases, psychological disorders, drug dependence/abuse, and aging.1 Several neurotransmitters such as dopamine (DA), norepinephrine (NE) and 5-hydroxytryptamine (5-HT) are extensively studied biogenic amines, on the basis of their important roles in disorders such as Parkinson’s disease, chorea, depression, and schizophrenia.2 Identification and quantification of these neurotransmitters and their metabolites not only have provided new insight into their signaling pathways, but also have helped researchers to develop possible modalities to treat related disorders. The complexity of specimen (e.g., brain tissues and cerebrospinal fluids or blood) generally requires pretreatments (e.g., microdialysis and solid-phase extraction) prior to analyses of the contents.3 HPLC and related separation techniques (e.g., UPLC4, nano-HPLC5, and capillary electrophoresis3,6) have become indispensible in recent years due to their high efficiency in separation, obviation of time-consuming pretreatments, and reduction of sample sizes.
Given the low concentrations of monoamine neurotransmitters in brain (e.g., DA and 5-HT in human cortex are about 0.027 and 0.01 μg/g of wet tissue, respectively7-8), chromatographic separations are typically used in conjunction with sensitive detectors such as electrochemical (EC) and fluorescence detectors.3 These two types of detectors are easy to implement and particularly useful for quantification. Mass spectrometry (MS), on the other hand, is powerful for applications wherein unknown metabolites need to be identified and structural elucidation of species is desired. In characterizing an unknown metabolite of phenylbutyrate from sera of Huntington’s disease patients, Vouros and coworkers developed an integrated HPLC-EC-MS system and elegantly demonstrated the complementary features of EC (quantification without an internal standard) and MS detections (unknown identification and structural elucidation).9 Another powerful feature of MS is that the detection is rather general and sensitive, as showcased by Li and coworkers in their determination of 15 different isotope-labeled biogenic amines in urine samples.10
Electrospray ionization (ESI) has become an ionization method of choice for coupling MS on-line with HPLC. ESI is readily amenable to chromatographic methods that employ mobile phase comprising high contents of organic solvents and low quantities of nonvolatile additives. Because many neurotransmitters are highly polar and tend to be weakly retained by the stationary phase of conventional reverse phase (RP) columns (i.e., C18 columns), their separation has been difficult to achieve. Consequently, these neurotransmitters are chemically modified to reduce their polarities or separated with specialized columns (e.g., BEH phenyl column, and HILIC column).4,10-13 An important variant of RP-HPLC that is powerful for separating polar or ionic species is ion-pair chromatography (IPC).14 Although in IPC the mobile phase (e.g., methanol or acetonitrile) is highly compatible to ESI, the ion-pair reagents (e.g., long alkyl compounds with sulfate or tertiary amine head groups) necessary for analyte retention generally cause significant signal suppression and clogging of the ESI-MS sampling interface.15-17 To circumvent this problem, volatile ion-pair reagents (e.g., heptafluorobutyric acid18 and tributylamine19) have been used. However, such additives could compromise the separation efficiency in many applications. Nanospray ESI-MS was also used in tandem with nano-IPC when sample quantities are exceedingly small and routine analyses of many samples are not required.15 For separation with the more commonly used C18 columns, an alternative approach is to place one or several ion-exchange columns between the RP-HPLC column and ESI-MS. Because ion-exchange columns all have finite ion-exchanging capacities, off-line column regeneration has to be carried out frequently.20-22 Such an approach does not facilitate continuous chromatographic separations or is not applicable for separations that last for extended times. To prolong saturation of ion-exchange columns, eluents from the RP-HPLC columns are allowed to enter the ion-exchange column/ESI-MS only when analyte peaks appear.23 We previously adopted this approach for the separation/detection of intermediates and products generated by iron-catalyzed dopamine oxidation reaction.24 The major drawback is that the separation/detection is discontinuous and a separate detector (e.g., UV-vis23-24) is needed to guide the valve switching so that analyte plugs can be diverted to the ion-exchange column at the right times. In our previous work, because only one valve and one column were used, separations cannot be performed over an extended period of time and the MS interface was also prone for clogging by the ion-pair reagent.24
Perhaps owing to the aforementioned limitations, IPC–ESI-MS has not been widely applied for analysis of mixtures containing polar or ionic constituents. To our best knowledge, IPC–ESI-MS has not been used to quantify monoamine neurotransmitters in complex sample matrices. In this work, we developed an IPC–ESI-MS interface consisting of two four-port valves and two ion-exchange columns. With this interface, removal of ion-pair reagents and regeneration of the ion-exchange columns can be performed simultaneously. The resultant approach was successfully extended to the separation of DA, NE, 5-HT and a DA precursor (L-3,4-dihydroxyphenylalanine or L-DOPA). The analytical figures of merit of our method were assessed and the amenability of the interface for real sample analysis (monoamine neurotransmitters in rat striatal tissues) was explored.
EXPERIMENTAL SECTION
Chemicals and Materials
Dopamine hydrochloride (DA), norepinephrine bitartrate (NE), 5-hydroxytryptamine hydrochloride (serotonin, 5-HT), 3,4-dihydroxybenzylamine (DHBA), L-DOPA, formic acid, ammonium formate, perchloric acid, HPLC-grade acetonitrile and methanol were acquired from Sigma (St. Louis, MO). The ion-pair reagents, ammonium dodecyl sulfate (30%) and sodium dodecyl sulfate, were purchased from MP Biomedicals, LLC (Solon, OH). Ultrapure water (18.2 ωM), collected from a Milli-Q water purification system (Millipore, Bedford, MA), was used to prepare all aqueous solutions.
Instrumentation
IPC
A Thermo Fisher HPLC system (Thermo Fisher Scientific, San Jose, CA), consisting of a high pressure quaternary pump, an on-line vacuum degasser, an autosampler, and a photodiode array detector, was used. Isocratic chromatography was performed on a C18 column (5 μm particle size, 2.0 mm × 100 mm, Agilent Technologies, Santa Clara, CA) in tandem with a Phenomenex C18 guard cartridge (4.0 mm × 3.0 mm, Phenomenex, Torrance, CA). The mobile phase was a water/acetonitrile (V/V = 78/22) mixture containing 0.2 mM ammonium dodecyl sulphonate and 30 mM formic acid (pH = 2.8). The autosampler injection volume was fixed at 20 μL.
ESI-MS
An ion-trap mass spectrometer (LCQ Fleet, Thermo Fisher Scientific, San Jose, CA), equipped with an ESI source, was used. The MS was optimized with continuous infusions of the analytes at 20 μL/min. The nitrogen sheath and auxiliary gases were set at 30 and 5 arbitrary units, respectively. The capillary temperature was maintained at 280 °C, and the capillary voltage and spray voltage were set at 18 V and 3.8 kV, respectively. Helium was used in the trap as a damping and collision gas. The optimized collision energy for the transitions was 50%. Selected reaction monitoring (SRM) was also used (m/z 198.1 [M+H]+ → 171.2 for L-DOPA, m/z 170.1 [M+H]+ → 152.1 for NE, m/z 154.2 [M+H]+ → 137.1 for DA, m/z 177.2 [M+H]+ → 160.2 for 5-HT and m/z 140.1 [M+H]+ → 123.1 for the internal standard).
The Interface for coupling IPC to ESI-MS
Two strong anion exchange columns (5 μm; 40 mm × 2.1 mm) were acquired from Higgins Analytical Inc. (Mountain View, CA) and the two four-port rotary valves were purchased from Valco Instruments Co (Houston, TX) and modified. These rotary valves were connected to a homemade control box for synchronizing the valve switching. PEEK tubings (0.10 mm i.d.; Upchurch Scientific, Oak Harbor, WA) were used to interconnect the C18 column, the two rotary valves, the anion exchange columns and the ESI-MS.
Procedures
Solution preparation
Stock solutions containing 10 mM of L-DOPA, NE, DA, and 5-HT each were prepared in 0.1% formic acid solution. Standard solutions were prepared by serial dilution of the stock solutions with the mobile phase solution. The final concentration of DHBA in the standard solutions was 0.7 μM.
Optimization of IPC–ESI-MS
The effects of additives on ESI-MS signals (5, 10, 20, 30, and 40 mM formic acid, and 0.1, 0.2, 0.4, 0.6, and 0.8 mM ammonium dodecyl sulfate) in the acetonitrile-water mobile phase were investigated. With the water-acetonitrile (78/22, V/V) mixed solvent system containing 30 mM formic acid and 0.2 mM ammonium dodecyl sulfate, satisfactory results in terms of peak intensity, resolution, elution time, and MS signal intensity were obtained. Using the optimized isocratic elution, the analytes and internal standard were separated within 22 min.
Ion exchange and column regeneration
The capacity for the anion exchange column for ridding dodecyl sulfate anions of the mobile phase was determined by passing 5 μM DA dissolved in the mobile phase through the column at a flow rate of 200 μ/min and monitoring m/z 154 [M+H]+ continuously. The anion exchange column can be regenerated by flushing with 50 mM ammonium formate in water-acetonitrile (V/V = 78/22) for 50 min. We found that an additional flushing of the column with the additive-free water/acetonitrile mixture for 5 min helps stabilize the mass spectrometric signals.
Striatal Sample Preparation
The striatal tissue samples, dissected from brains of male Long-Evans rats, were flash-frozen in −80 °C isopentane for 2 min and subsequently stored in aluminum foil at −80 °C.25 Samples were weighed and homogenized for 10 min on ice in a 200 μ mixture of 0.2 M perchloric acid and 0.7 μM internal standard. The final homogenate was centrifuged at 18000 rpm for 10 min at 4 °C. The supernatant was filtered through a 0.22 μm Millipore filter prior to analysis.
RESULTS AND DISCUSSION
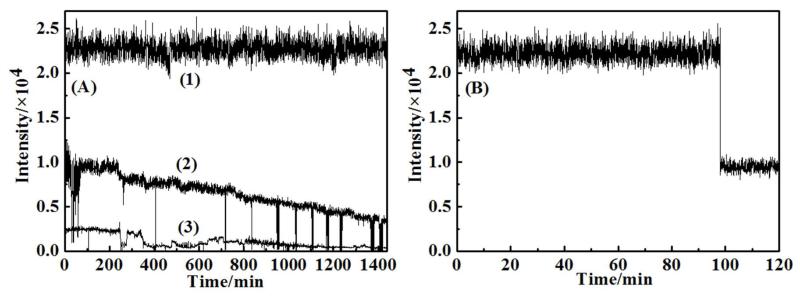
Ion-pair reagents (e.g., long alkyl sulfate such as sodium dodecyl sulfate) are commonly used for enhanced separations of charged or polar analytes.24,26-27 As shown in Figure 1A, compared to the DA solution without any ion-pair reagent (curve 1), the presence of ammonium dodecyl sulfate (curve 2) decreases the DA signal by ca. 2.6 fold at the beginning of the infusion and almost 7 fold after 1440 min of continuous infusion. The signal suppression is further exacerbated when sodium dodecyl sulfate was used (curve 3, a decrease by 35 fold throughout the infusion). Finally, notice that in both curves 2 and 3, sporadic spikes are discernible, which are attributed to the intermittent clogging of the MS sampling cone by the deposited salts.21,28 The capacity of each anion exchange column should not be too large to cause sample dilution and peak dispersion, yet large enough to provide sufficient volume for exchanging the ion-pair reagents for at least a relatively long chromatographic separation. As shown in Figure 1B, when the anion exchange column is fully saturated, the “breakthrough” by dodecyl sulfate occurs with a rapid decrease of the DA signal. The threshold of the column saturation was found to be about 98 min, which is shorter than the total time needed for regeneration (ca. 55 min; cf. Experimental Section).
Figure 1.
(A) ESI-MS signal intensity of continuously infused 5 μM DA (A) in a water/acetonitrile mixture containing (1) 30 mM formic acid, (2) 30 mM formic acid and 0.2 mM ammonium dodecyl sulfate, (3) 30 mM formic acid and 0.2 mM sodium dodecyl sulfate. (B) ESI-MS signal of 5 μM DA in the same solvent system as in curve 2 of panel A, upon passing through an anion exchange column.
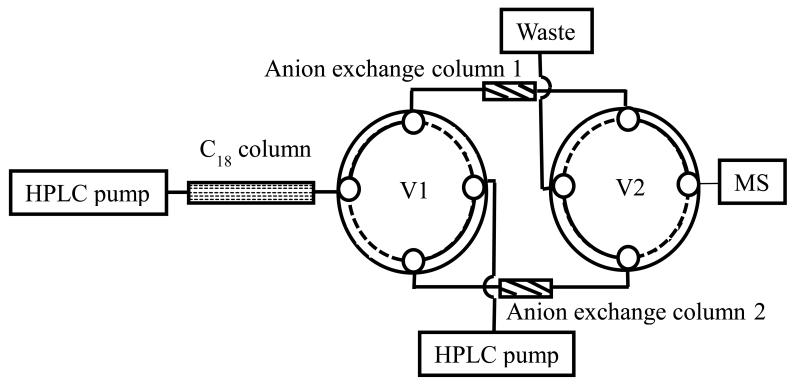
To remove the nonvolatile dodecyl sulfate anion, we designed an interface (Figure 2) that facilitates undisrupted IPC–ESI-MS analysis with simultaneous on-line regeneration of the anion exchange columns. When one anion exchange column is at the brink of saturation, a synchronized rotation of the two four-port valves redirects the mobile phase from the C18 column to the other anion exchange column, and the nearly saturated anion exchange column can be refreshed by the regeneration solution delivered with the second HPLC pump. For example, a change from the valve configuration denoted by the solid curves in Figure 2 to that represented by the dotted curves will regenerate column 1 and utilize column 2 for analysis.
Figure 2.
Schematic representation of the interface. The solid curves interconnecting ports of each valve denote the configuration in which anion exchange column 1 is used for IPC–ESI-MS while anion exchange column 2 is regenerated. The dashed curves represent the configuration wherein anion exchange column 1 is regenerated and anion exchange column 2 is used.
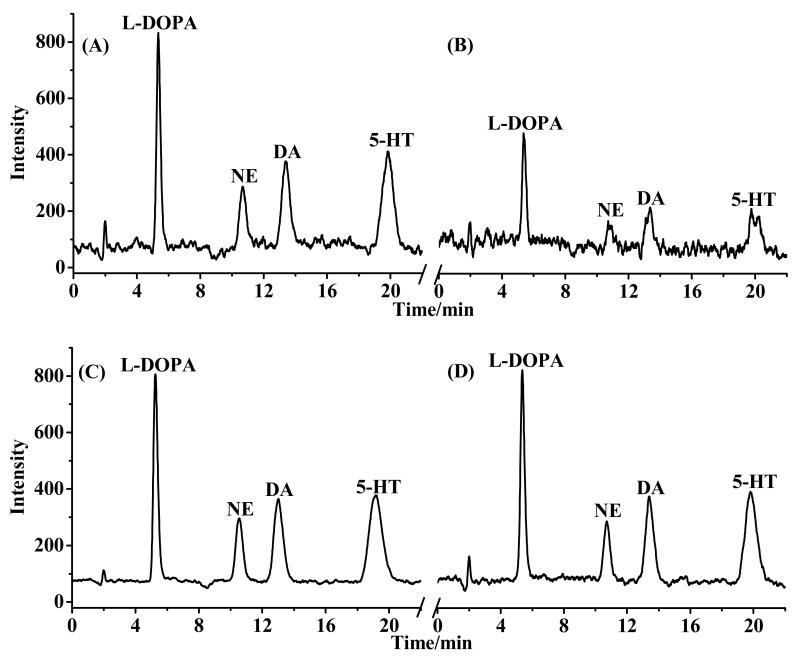
With a saturation time of 98 min, a typical 22-min separation of L-DOPA, NE, DA, and 5-HT (cf. Figure 3A) can be performed consecutively for four times without any waiting period in between. Notice that the chromatographic peaks are well resolved, with retention times of 5.68 min for L-DOPA, 10.71 min for NE, 13.40 min for DA, and 19.79 min for 5-HT. The relatively sharp and symmetric peaks also indicate that insertion of the anion exchange column between the IPC column and the ESI-MS does not lead to significant band broadening. If the column is not regenerated, the chromatographic peaks decreased noticeably after the column saturation (cf. the chromatogram in Figure 3B). When the first column was under regeneration (e.g., after four consecutive runs of the same separation depicted in Figure 3A), the second at the same time produced a chromatogram (c.f., Figure 3C) that is essentially identical to what the first column did (cf. Figure 3A), suggesting very little inter-column variability. Thus, for separations that last longer than the saturation time, the valves can be switched at any time before 98 min to observe all of the analyte eluents. Shown in Figure 3D is a chromatogram obtained from regenerated column 1, which is congruent with that before the regeneration (cf. Figure 3A). This indicates that the regeneration is quite effective. We found that alternating uses of the two anion exchange columns over an extended period of time (> 48 h) did not lead to any visible salt deposition at the ESI source and MS sample cone or degradation of the mass spectrometric signals, suggesting that our interface is adaptable for automatic and continuous IPC–ESI-MS analyses.
Figure 3.
Total ion current chromatograms of L-DOPA, NE, DA and 5-HT collected (A) before and (B) after the saturation of anion exchange column 1, (C) through the use of anion exchange column 2, and (D) through regenerated anion exchange column 1.
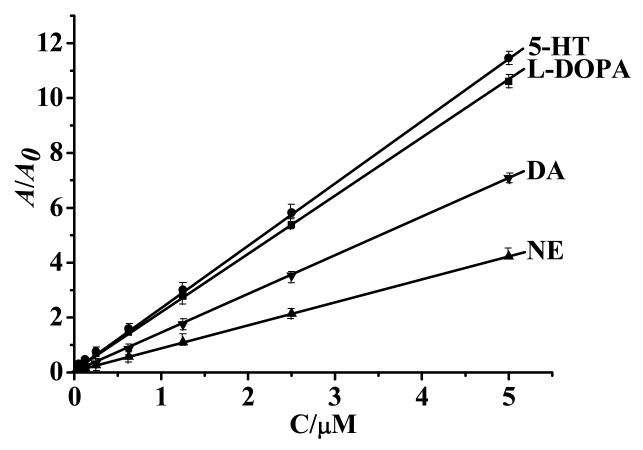
We also assessed other analytical figures of merit (linearity, reproducibility, and limit of detection) of IPC–ESI-MS based on our interface. Using the method of internal standard, the ratios of the four analyte peak areas with respect to that of the internal standard (DHBA) were found to be all linear from 0.05 to 5 μM, with R2 values all greater than 0.99. The RSD values of the data points range from 4.0 to 6.0 %, which are indicative of high reproducibility. The signal variability from day to day is also rather small, as the RSD values of these analytes measured over a six-day span, are all less than 6%. The limits of detection for NE and DA are both 0.03 μM, while those for L-DOPA and 5-HT are 0.01 μM. These values are 1–2 orders of magnitude lower than those attained by HPLC–ion-trap MS using specialized chromatographic columns or analyte preconcentration.11 The lower limits of detection stem from the effective removal of the ion-pair reagent by the interface. Another added benefit is that matrix effects inherent in neutral interferents, which are generally not retained strongly, are eliminated by IPC prior to the analyte detection. Indeed, acceptable recovery values, ranging from 94 to 111%, were obtained for the four analytes. We should add that an even better analytical performance can be achieved with triple quadrupole MS, whose dynamic range and sensitivity for monoamines have been demonstrated to be superior to those of ion-trap MS.4,29-30
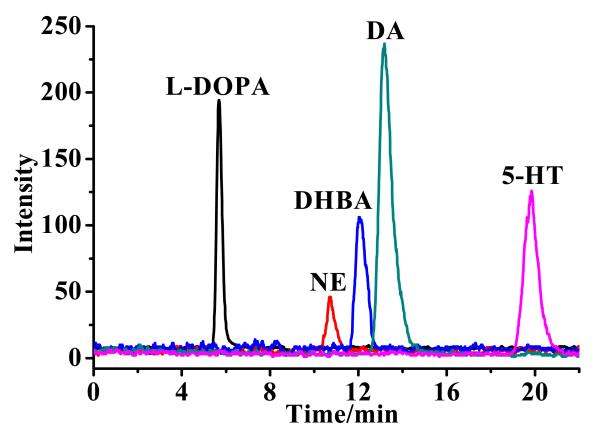
To demonstrate the amenability of our interface for separation/detection of neurotransmitters in real samples, we identified and quantified L-DOPA, NE, DA, and 5-HT in rat striatal tissue samples. Figure 5 is an overlay of representative chromatograms, collected in the SRM mode, of L-DOPA, NE, DA, 5-HT and the internal standard. The quantities of these species, expressed in μg/g of wet tissue (n = 5 rat brains) are 4.32 ± 0.07 (DA), 0.28 ± 0.04 (NE), 1.23 ± 0.09 (L-DOPA) and 0.47 ± 0.04 (5-HT). These values agree well with values reported in the literature.31-33 The excellent signal-to-noise ratios afforded by our interface demonstrate that our method is viable for measuring trace analytes in complex matrices. We should also note that the detection limits for DA (0.03 μM) and 5-HT (0.01 μM) deduced from Figure 3 correspond to 0.03 and 0.01 μg per gram of wet tissue extracted, treated, and analyzed under the same experimental conditions. These values are comparable to concentrations found in human cortex tissues,7-8 which are the termini of the DA and 5-HT signaling pathways. Thus, even with an ion-trap MS of moderate sensitivity, IPC–ESI-MS is capable of measuring trace levels of DA and 5-HT contents in different brain regions.
Figure 5.
Representative chromatograms of L-DOPA, NE, DA, 5-HT, and the internal standard in striatal tissue sample collected in the selective reaction monitoring mode.
Finally, we should add that the concept of a dual-valve, dual-column interface should also be applicable for interfacing UPLC to ESI-MS or coupling microfluidic chip-based nano-HPLC to nanospray MS. The anion exchange resins packed in a capillary column can be connected to the commercial and ESI-MS instruments. As for the microfluidic chip-based nano-HPLC/nanospray MS systems,34 we envision that, similar to the packing of C18-coated 5-μm or 3.55 μm particles into the sample enrichment channel,35 the ion exchange resins could be incorporated into a microfludic chip or column. As recently reviewed,36 it is now quite common to have two or more chip columns be connected to a nano-HPLC or nanospray ESI-MS system.
CONCLUSIONS
A dual-valve, dual-column interface has been developed for combining IPC on-line with ESI-MS for extended or repetitive chromatographic separations. Owing to the removal of the nonvolatile ion-pair reagent, sensitive detection of monoamine neurotransmitters can be achieved with little interference from complex sample matrices or the ion-pair reagent. Regeneration of the ion-exchange columns can be carried out simultaneously, which drastically improves the sample throughput and reproducibility. The interface is simpler and more cost-effective than the use of specialized chromatographic columns or procedures involving analyte derivatization and sample preconcentration. It also affords lower detection limits. The suitability for real-sample analysis is demonstrated with facile and quantitative determinations of L-DOPA, NE, DA and 5-HT in rat straital tissues. The detection levels for DA and 5-HT (0.03 and 0.01 μM) allows different brain regions of varied concentrations to be assayed. The methodology described herein should also be readily applicable to IPC–ESI-MS quantification and structural elucidation of other types of polar compounds (e.g., negatively charged carboxylic and sulfonic acids) with high sensitivity.
Figure 4.
Calibration curves for L-DOPA, NE, DA, and 5-HT. The error bars were deduced from five replicates. A and A0 are the peak areas of analytes and the internal standard, respectively.
Acknowledgements
Partial support of this work by a grant from the National Institutes of Health (SC1NS070155-01 to FZ), a National Science Foundation (NSF) grant (No. 1112105 to FZ), the NSF-CREST Program at California State University, Los Angeles (NSF HRD-0931421 to FZ), the National Natural Science Foundation of China (No. 21275163 and No. 21005089 to SS) is gratefully acknowledged. We thank Dr. Alicia Izquierdo for providing the straital tissue samples.
REFERENCES
- (1).Lisman JE, Coyle JT, Green RW, Javitt DC, Benes FM, Heckers S, Grace AA. Trends Neurosci. 2008;31:234–242. doi: 10.1016/j.tins.2008.02.005. [DOI] [PMC free article] [PubMed] [Google Scholar]
- (2).Kurian MA, Gissen P, Smith M, Heales S, Jr., Clayton PT. Lancet Neurol. 2011;10:721–733. doi: 10.1016/S1474-4422(11)70141-7. [DOI] [PubMed] [Google Scholar]
- (3).Perry M, Li Q, Kennedy RT. Anal. Chim. Acta. 2009;653:1–22. doi: 10.1016/j.aca.2009.08.038. [DOI] [PMC free article] [PubMed] [Google Scholar]
- (4).Ji CJ, Li WL, Ren XD, El-Kattan AF, Kozak R, Fountain S, Lepsy C. Anal. Chem. 2008;80:9195–9203. doi: 10.1021/ac801339z. [DOI] [PubMed] [Google Scholar]
- (5).Bark SJ, Lu WD, Hook V. Anal. Biochem. 2009;389:18–26. doi: 10.1016/j.ab.2009.03.010. [DOI] [PMC free article] [PubMed] [Google Scholar]
- (6).Braun KL, Hapuarachchi S, Fernandez FM, Aspinwall CA. Anal. Chem. 2006;78:1628–1635. doi: 10.1021/ac051710w. [DOI] [PubMed] [Google Scholar]
- (7).Adolfsson R, Gottfries CG, Roos BE, Winblad B. J. Neural. Transm. 1979;45:81–105. doi: 10.1007/BF01250085. [DOI] [PubMed] [Google Scholar]
- (8).Bucht G, Adolfsson R, Gottfries CG, Roos BE, Winblad B. J. Neural. Transm. 1981;51:185–203. doi: 10.1007/BF01248951. [DOI] [PubMed] [Google Scholar]
- (9).Schiavo S, Ebbel E, Sharma S, Matson W, Kristal BS, Hersch S, Vouros P. Anal. Chem. 2008;80:5912–5923. doi: 10.1021/ac800507y. [DOI] [PMC free article] [PubMed] [Google Scholar]
- (10).Guo K, Ji CJ, Li L. Anal. Chem. 2007;79:8631–8638. doi: 10.1021/ac0704356. [DOI] [PubMed] [Google Scholar]
- (11).Starkey JA, Mechref Y, Muzikar J, McBride WJ, Novotny MV. Anal. Chem. 2006;78:3342–3347. doi: 10.1021/ac051863j. [DOI] [PubMed] [Google Scholar]
- (12).Hows MEP, Lacroix L, Heidbreder C, Organ AJ, Shah AJ. J. Neurosci. Meth. 2004;138:123–132. doi: 10.1016/j.jneumeth.2004.03.021. [DOI] [PubMed] [Google Scholar]
- (13).Hayama T, Sakaguchi Y, Yoshida H, Itoyama M, Todoroki K, Yamaguchi M, Nohta H. Anal. Chem. 2012;84:8407–8414. doi: 10.1021/ac3020092. [DOI] [PubMed] [Google Scholar]
- (14).Fritz JS. J. Chromatogr. A. 2005;1085:8, 17. doi: 10.1016/j.chroma.2004.12.087. [DOI] [PubMed] [Google Scholar]
- (15).Xiong WN, Glick J, Lin YQ, Vouros P. Anal. Chem. 2007;79:5312–5321. doi: 10.1021/ac0701435. [DOI] [PubMed] [Google Scholar]
- (16).Gangl ET, Annan M, Spooner N, Vouros P. Anal. Chem. 2001;73:5635–5644. doi: 10.1021/ac010501i. [DOI] [PubMed] [Google Scholar]
- (17).Zhang SJ, You JM, Ning SJ, Song CH, Suo YR. J. Chromatogr. A. 2013;1280:84–91. doi: 10.1016/j.chroma.2013.01.045. [DOI] [PubMed] [Google Scholar]
- (18).Duy SV, Besteiro S, Berry L, Perigaud C, Bressolle F, Vial HJ, Lefebvre-Tournier I. Anal. Chim. Acta. 2012;739:47–55. doi: 10.1016/j.aca.2012.06.016. [DOI] [PubMed] [Google Scholar]
- (19).Luo Q, Wang DH, Wei Z, Wang ZJ. J. Chromatogr. A. 2013;1277:26–34. doi: 10.1016/j.chroma.2012.12.046. [DOI] [PubMed] [Google Scholar]
- (20).Vreeken RJ, Ghijsen RT, Frei RW, de Jong GJ, Brinkman U. A. Th. J. Chromatogr. A. 1993;654:65–77. [Google Scholar]
- (21).Forngren BH, Samskog J, Gustavsson SA, Tyrefors N, Markides KE, Langstrom B. J. Chromatogr. A. 1999;854:155–162. doi: 10.1016/s0021-9673(99)00526-9. [DOI] [PubMed] [Google Scholar]
- (22).Socher G, Nussbaum R, Rissler K, Lankmayr E. Chromatographia. 2001;54:65–70. [Google Scholar]
- (23).Plum A, Rehorek A. J. Chromatogr. A. 2005;1084:119–133. doi: 10.1016/j.chroma.2005.03.001. [DOI] [PubMed] [Google Scholar]
- (24).Zhang L, Yagnik G, Jiang DL, Shi SY, Chang P, Zhou FM. J. Chromatogr. B. 2012;911:55–58. doi: 10.1016/j.jchromb.2012.10.026. [DOI] [PMC free article] [PubMed] [Google Scholar]
- (25).Izquierdo A, Carlos K, Ostrander S, Rodriguez D, McCall-Craddolph A, Yagnik G, Zhou FM. Behav. Brain Res. 2012;233:494–499. doi: 10.1016/j.bbr.2012.05.032. [DOI] [PMC free article] [PubMed] [Google Scholar]
- (26).Thomas DH, Taylor JD, Barnaby OS, Hage DS. Clin. Chim. Acta. 2008;398:63–69. doi: 10.1016/j.cca.2008.08.013. [DOI] [PMC free article] [PubMed] [Google Scholar]
- (27).Manickum T. J. Chromatogr. B. 2008;873:124–128. doi: 10.1016/j.jchromb.2008.08.005. [DOI] [PubMed] [Google Scholar]
- (28).Denoroy L, Parrot S, Renaud L, Renaud B, Zimmer L. J. Chromatogr. A. 2008;1205:144–149. doi: 10.1016/j.chroma.2008.07.043. [DOI] [PubMed] [Google Scholar]
- (29).Xu N, Qiu C, Wang WP, Wang YH, Chai CZ, Yan YQ, Zhu DN. J. Pharmaceut. Biomed. Anal. 2011;55:101–108. doi: 10.1016/j.jpba.2010.12.015. [DOI] [PubMed] [Google Scholar]
- (30).Uutela P, Karhu L, Piepponen P, Käenmäki M, Ketola RA, Kostiainen R. Anal. Chem. 2009;81:427–434. doi: 10.1021/ac801846w. [DOI] [PubMed] [Google Scholar]
- (31).Yoshitake T, Kehr J, Yoshitake S, Fujino K, Nohta H, Yamaguchi M. J. Chromatogr. B. 2004;807:177–183. doi: 10.1016/j.jchromb.2004.03.069. [DOI] [PubMed] [Google Scholar]
- (32).Lakshmana MK, Raju TR. Anal. Biochem. 1997;246:166–170. doi: 10.1006/abio.1996.9997. [DOI] [PubMed] [Google Scholar]
- (33).Rowlett JK, Mattingly BA, Bardo MT. Neuropharmacology. 1991;30:191–197. doi: 10.1016/0028-3908(91)90203-n. [DOI] [PubMed] [Google Scholar]
- (34).Fortier M-H, Bonneil E, Goodley P, Thibault P. Anal. Chem. 2005;77:1631–1640. doi: 10.1021/ac048506d. [DOI] [PubMed] [Google Scholar]
- (35).Yin H, Killeen K, Brennen R, Sobek D, Werlich M, van de Goor T. Anal. Chem. 2005;77:527–533. doi: 10.1021/ac049068d. [DOI] [PubMed] [Google Scholar]
- (36).Lin S-L, Bal H-Y, Lin T-Y, Fuh M-R. Electrophoresis. 2012;33:635–643. doi: 10.1002/elps.201100380. [DOI] [PubMed] [Google Scholar]


