Abstract
Glial cells, traditionally viewed as passive elements in the CNS, are now known to have many essential functions. Many of these functions have been revealed by work on retinal glial cells. This work has been conducted almost exclusively on ex vivo preparations and it is essential that retinal glial cell functions be characterized in vivo as well. To this end, we describe an in vivo rat preparation to assess the functions of retinal glial cells. The retina of anesthetized, paralyzed rats is viewed with confocal microscopy and laser speckle flowmetry to monitor glial cell responses and retinal blood flow. Retinal glial cells are labeled with the Ca2+ indicator dye Oregon Green 488 BAPTA-1 and the caged Ca2+ compound NP-EGTA by injection of the compounds into the vitreous humor. Glial cells are stimulated by photolysis of caged Ca2+ and the activation state of the cells assessed by monitoring Ca2+ indicator dye fluorescence. We find that, as in the ex vivo retina, retinal glial cells in vivo generate both spontaneous and evoked intercellular Ca2+ waves. We also find that stimulation of glial cells leads to the dilation of neighboring retinal arterioles, supporting the hypothesis that glial cells regulate blood flow in the retina. This in vivo preparation holds great promise for assessing glial cell function in the healthy and pathological retina.
Keywords: Glial cell, Müller cell, Astrocyte, Retina, In vivo preparation, Intracellular calcium, Calcium wave, Blood flow, Confocal microscopy, Laser speckle flowmetry
1. Introduction
The vertebrate retina is an easily accessible part of the CNS and has proved to be a valuable preparation for characterizing glial cell properties and functions. The mammalian retina possesses two types of macroglial cells: astrocytes, which are confined largely to the innermost retinal layer, and Müller cells, which are radial glial cells that span the entire thickness of the retina. In many respects, Müller cells function as astrocytes in those retinal layers where true astrocytes are absent (1).
Previous work, utilizing both isolated retinas and retinal slices, has revealed several important functions of retinal glial cells. Müller cells regulate extracellular K+ levels (2). When active neurons release K+, Müller cells transfer this K+ to the vitreous humor by the process of K+ siphoning (3). Müller cells also regulate glutamate levels through the action of their high affinity glutamate transporter (4). Müller cells are stimulated by neuronal activity, generating increases in intracellular Ca2+ in response to the release of neurotransmitters (5). In turn, stimulated Müller cells release ATP, which modulates retinal activity by hyperpolarizing ganglion cells, the output neurons of the retina (6, 7).
Recently, we demonstrated that glial cells mediate functional hyperemia in the retina (8). When retinal neurons are stimulated by light, retinal arterioles dilate, bringing additional oxygen and nutrients to the active neurons. This response is mediated in large part by retinal glia, which release vasoactive agents that dilate retinal arterioles (9). Previously, glial cell control of arteriole diameter was characterized in the isolated retina (8, 10). This preparation is useful for several reasons. Retinal neurons and glia can be patched in the isolated retina so that their membrane potential can be monitored and controlled. The diameter of retinal vessels can also be monitored with high precision and the retina easily perfused with drugs in this preparation. However, the isolated retina has significant disadvantages in studying mechanisms mediating functional hyperemia. Blood does not flow through vessels and vessels do not have normal tone in the isolated retina. These factors can dramatically alter vascular responses. In addition, oxygen and nitric oxide levels, which both influence functional hyperemia (8, 11), may not be normal in the isolated retina preparation.
In order to circumvent the problems associated with the isolated retina, we have developed an in vivo preparation to characterize the role of glial cells in mediating functional hyperemia in the retina. Retinal glial cells can be labeled with Ca2+ indicator dyes, allowing their physiological state to be monitored with florescence microscopy. They can also be filled with caged Ca2+ compounds so that they can be stimulated by short wavelength light pulses. Retinal blood flow can be monitored in the in vivo preparation with both confocal microscopy and laser speckle flowmetry (LSF) (12). Thus, the role that glial cells play in regulating retinal blood flow can be characterized using this in vivo preparation. In this chapter, we describe materials and methods for conducting in vivo experiments to assess retinal glial cell function.
2. Materials
2.1. Animal Preparation
Male Long-Evans rats (250–350 g) obtained from Harlan and treated in accordance with the guidelines of the Institutional Animal Care and Usage Committee of the University of Minnesota.
Isoflurane anesthesia.
α-Chloralose-HBC complex anesthesia (Sigma), dissolved in saline (see Note 1).
Gallamine triethiodide, paralytic agent.
Artificial tears ointment (Phoenix Pharmaceutical).
Hypromellose ophthalmic demulcent (2.5% solution), gonioscopic prism solution (GPS) (Wilson Ophthalmic).
Atropine sulfate for IV injection, 0.4 mg/mL (Baxter).
Atropine sulfate for topical application to the eye, ophthalmic solution, 1% (Falcon)
Saline solution: 132.5 mM NaCl, 3.0 mM KCl, 2.0 mM CaCl2, 1.0 mM MgSO4, 0.5 mM NaH2PO4, and 10 mM HEPES, pH 7.4.
Heparin sodium injection, USP, 1,000 U/mL
Heparinized saline (15% heparin solution in saline).
Sutures for immobilizing the eye, 5-0, 13 mm, 3/8, braided black silk.
Artery cannula, Micro-Renathane tubing, 0.64 mm OD × 0.30 mm ID (Braintree Scientific Inc., MRE025).
Vein cannula, Micro-Renathane tubing, 0.94 mm OD × 0.58 mm ID (Braintree Scientific Inc., MRE037).
Endotracheal tube, rat, 2.0 mm OD (CWE Inc., 13-21032).
Stainless steel surgical staples (Sureline S1003-12).
2.2. Maintenance Equipment
Anesthesia syringe pump (NE-300, New Era Pump Systems).
Blood pressure monitor (Pressure Monitor BP-1, World Precision Instruments).
End-tidal CO2 monitor (microCapStar, CWE).
Ventilator (CWE SAR-830-P).
Blood gas analyzer (Radiometer, ABL 800 Flex).
Pulse oximeter (MouseOx, Starr Life Sciences Corp.).
Thermostatically controlled heater (TC-1000 Temperature Controller, CWE).
2.3. Blood Vessel Labeling
Dextran fluorescein isothiocyanate, 2,000,000 MW (Sigma) dissolved in saline (3% solution).
Dextran rhodamine B isothiocyanate, 70,000 MW (Sigma) dissolved in saline (3% solution).
2.4. Glial Cell Labeling and Stimulation
Oregon Green 488 BAPTA-1AM, Ca2+ indicator dye (Invitrogen).
NP-EGTA, caged Ca2+ compound (o-nitrophenyl EGTA AM; Invitrogen).
NPE-caged ATP (Invitrogen).
Hyaluronidase (Worthington Biochemical Corp.).
Saline solution.
2.5. Imaging Equipment
Olympus FV1000 upright confocal microscope with a secondary (SIM) stimulation scanner. The microscope has a focusable nosepiece (Olympus BX61WI) and a movable stage on which the rat stereotaxic holder is mounted.
808 nm laser diode for laser speckle flowmetry (LSF) illumination of the retina (200 mW, L808P200, LT230A collimation tube; ThorLabs).
240 μm diameter IR glass optical fiber.
CCD camera (CoolSnap ES, Photometrics).
Contact lens, 5.4 mm fundus laser lens (Ocular Instruments).
3. Methods
We describe in this section how retinal glial cell responses are monitored and glial regulation of blood flow assessed in vivo. We first describe the surgical procedures that permit us to view retinal vessels and monitor retinal blood flow in vivo with confocal microscopy and laser speckle flowmetry. We then describe how retinal glial cells are labeled and stimulated. Finally, we present examples of glial cell responses to stimulation and glial cell regulation of blood flow.
3.1. Surgery
The initial surgery is performed under isoflurane anesthesia. Rats are anesthetized with isoflurane (2% in 30% O2/70% N2, 1 L/min) introduced through a cone covering the mouth and nose. Depth of anesthesia is assessed periodically by paw pinch and depth of breathing: an appropriately anesthetized animal should not be responsive to any paw pinch and breathing should be deep and regular.
A rectal thermometer is inserted to monitor core body temperature and a heating blanket is placed under the animal during surgery to maintain the body temperature at 37°C.
One drop of atropine solution is applied to the right eye to dilate the pupil. Both eyes are coated with Artificial Tears Ointment to avoid drying. The artificial tears are applied gently with a Q-tip with minimal pressure to the eye to avoid initiating the oculocardiac reflex (see Note 2).
One venous and one arterial cannulation line are prepared by flushing them with saline and heparinized saline, respectively. Care is taken to remove all bubbles from the lines. A 1 cc syringe filled with saline is attached to the venous line and a 1 cc syringe filled with heparinized saline is attached to the arterial line.
The femoral vein and artery on the left side are cannulated for drug administration and monitoring of blood pressure, respectively. The surgical incision is closed and secured with staples. After the artery is cannulated, the arterial line is connected to the pressure transducer of the blood pressure monitor and used to monitor mean arterial blood pressure.
A tracheotomy is performed to allow for mechanical ventilation of the animal during the experiment. The procedure begins by exposing a 2.5 cm segment of the trachea. The trachea is snipped perpendicularly, between two cartilage segments, and a rat endotracheal tube that has been cut to a length of 4 cm is inserted. The tube is slid approximately 2.5 cm into the trachea and secured with suture. The surgical incision is closed and secured with staples. The animal is allowed to breathe on its own through the tracheal tube until all preparatory procedures are complete. The isoflurane cone is moved from the animal’s mouth and nose, to the tracheal tube to continue administration of anesthesia.
The rat is wrapped in a heating blanket and placed in a modified stereotaxic frame with a three-point head restraint. Standard ear bars and nose clamp are attached to the frame of dimensions 9 × 40 cm (see Fig. 1a). Metal rods are mounted on the two ends of the frame so that the rat can be rotated around its rostral-caudal axis.
The frame is placed on a table so that the animal’s right eye is facing upward. Atropine sulfate (0.1 mg/kg) is administered intravenously to prevent the occurrence of the oculocardiac reflex (see Note 2).
3 mL saline is injected subcutaneously into the scruff of the animal’s neck to prevent dehydration.
Five minutes after the atropine injection, the artificial tears ointment is gently rinsed from the right cornea with saline. Pupil dilation is assessed; if dilation is inadequate, another drop of atropine sulfate is applied. The eye is kept moist with saline until step 12 in order to prevent drying and clouding of the cornea.
The eye is sutured to a metal ring (see Fig. 1c) to hold it in place and allow penetration of a needle. A metal ring with eight holes spaced along the circumference is secured to the stereotaxic frame and positioned over the right eye. Working clockwise around the ring, the eye is secured to the ring by eight sutures through the conjunctiva. The sutures are tightened until the eye is held firmly without stretching or distorting the eye.
One drop of GPS is applied to the cornea. Then, a contact lens is carefully lowered onto the cornea such that the anterior surface of the lens is parallel with the table and the posterior, concave surface of the lens is completely in contact with the GPS, without introducing any air bubbles (see Figs. 1c and 2a). The handle of the contact lens is secured to the stereotaxic frame with modeling clay. The angle of the contact lens may be adjusted later to maximize the retinal area being imaged (see Note 3).
Over the course of 15 min, the anesthesia is switched from isoflurane to α-chloralose-HBC by giving an initial bolus of α-chloralose-HBC (800 mg/kg), followed by steady infusion at 550 mg/kg/h (see Note 1). Isoflurane is gradually reduced from 2% to zero in increments of 0.5% while α-chloralose HBC is continuously infused intravenously. During this switch, mean arterial blood pressure is monitored and anesthesia and O2 levels are adjusted to maintain the blood pressure between 90 and 115 mmHg.
The stereotaxic frame with the restrained rat is secured to a movable stage below an upright microscope that serves to image the retina for both confocal microscopy and LSF (see Fig. 1b). The frame can be rotated along its long axis to view different regions of the retina. The axis of rotation is in line with the right eye of the rat so that when the frame is rotated, the eye remains stationary and the retina in focus.
Fig. 1.
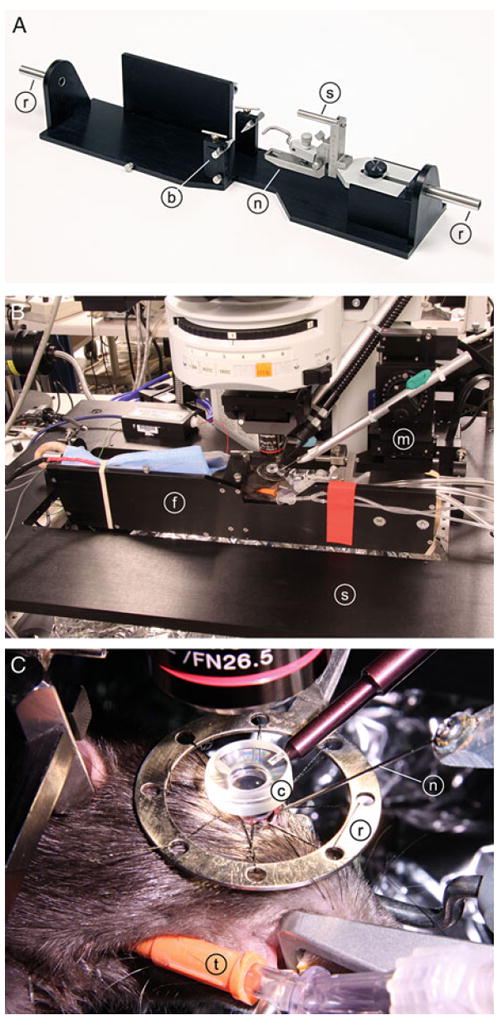
Photographs of the in vivo rat preparation. (a) Rat stereotaxic frame. A standard nose clamp (n) and ear bars (b) are mounted on a custom frame, which is attached to the microscope stage by the two rods (r) extending from the frame. The eye is sutured to a metal ring (not shown) that is fixed to the frame by a small rod (s). (b) An anesthetized rat, restrained in the stereotaxic frame (f), is attached to a movable stage (s) below the microscope. The rat and frame can be rotated around the long axis of the animal to view different regions of the retina. A hypodermic needle is advanced into the eye by a micromanipulator (m). (c) The eye is sutured to a metal ring (r), which is attached to the stereotaxic frame. The retina is viewed through a contact lens (c), which neutralizes the optics of the cornea. A guide needle (n), positioned by the micromanipulator, is inserted into the vitreous humor of the eye. The rat is ventilated via a tracheal tube (t).
Fig. 2.
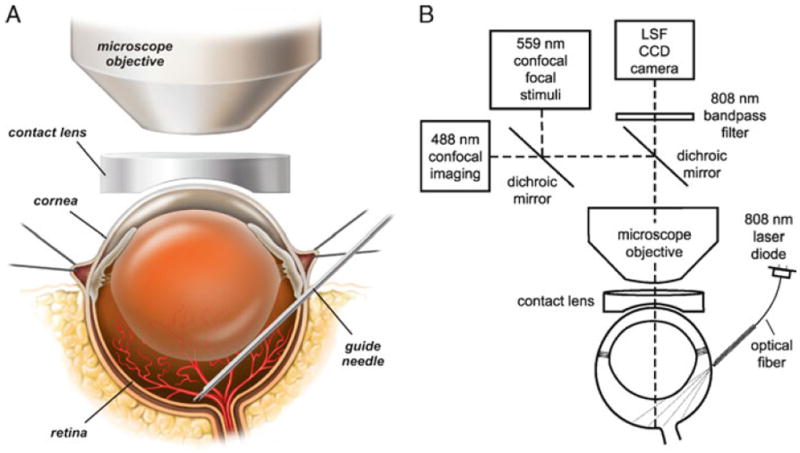
Drawings of the in vivo rat preparation. (a) The retina is imaged through an upright microscope and a contact lens placed over the cornea. A hypodermic needle is advanced through the sclera into the vitreous humor and serves as a guide needle through which a smaller needle is inserted to eject dyes onto the retinal surface. (b) The schematic shows the optical path for imaging the retina with confocal microscopy while simultaneously monitoring retinal blood flow with laser speckle flowmetry (LSF). The retina is illuminated for LSF by 808 nm light passing though an optical fiber that is pressed against the outer surface of the eye. A dichroic mirror directs the appropriate wavelengths of light from the retina to the LSF camera and the confocal microscope. An 808 nm bandpass filter prevents confocal excitation or emission light from entering the LSF camera. The confocal microscope has a primary scanner (488 nm) for imaging retinal vessels and a secondary scanner for generating 559 nm stimulating light flashes. The secondary scanner also generates 405 nm light pulses for photolysis of caged compounds. See ref. (12) for a further discussion of LSF. Modified from ref. (12).
3.2. Anesthesia Maintenance
The rat is maintained on α-chloralose-HBC anesthesia (550 mg/kg/h; see Notes 1 and 4).
The animal is artificially ventilated (40–60 breaths/min) with a mixture of O2 and nitrogen (normally 30%/70%).
Once placed on the ventilator, the rat is paralyzed with gallamine triethiodide (20 mg/kg bolus, maintained at a rate of 20 mg/kg/h).
Blood oxygen saturation level and heart rate, arterial blood pressure, and end-tidal CO2 are continuously monitored.
The depth of anesthesia is assessed by monitoring heart rate and blood pressure. The heart rate increases if the animal is underanesthetized. From a nominal level of 90–115 mmHg, the blood pressure increases if the anesthetic level is too light and decreases if it is too heavy. Anesthesia infusion rate is adjusted accordingly (see Note 5).
Core body temperature is monitored and maintained at 37°C.
Blood pO2, pCO2, and pH are sampled periodically, and maintained within physiological limits (100–125, 35–45, and 7.35–7.45, respectively) by adjusting the O2 level of inspired air and the ventilator breath rate and pressure (see Note 6).
3.3. Retinal Imaging
The retina is viewed through the cornea and lens with an upright microscope and 4× and 10× dry objectives. The refractive properties of the cornea are neutralized by the contact lens placed over the cornea (see Figs. 1c and 2a). A digital CCD camera is attached to the phototube of the microscope for LSF. The retina is imaged simultaneously with a laser scanning confocal microscope. Light from the retina is separated by a dichroic mirror in the microscope (600 lpxr, Chroma Technology), with 808 nm light passing through to the LSF digital camera and 400–600 nm wavelengths reflected into the confocal scanner (see Fig. 2b). An 808 nm bandpass filter (ET808/20m; Chroma Technology) is placed in front of the LSF camera to block residual visible wavelengths.
3.4. Confocal Microscopy of Retinal Vessels
Retinal vessels are visualized with laser scanning confocal microscopy. 1 mL of dextran fluorescein isothiocyanate dye solution is injected intravenously and the dye within the vessels is imaged with 488 nm illumination (see Fig. 3a). Alternately, dextran rhodamine B isothiocyanate dye (0.5 mL) and 559 nm illumination is used to image retinal vessels if glial Ca2+ is being monitored simultaneously using 488 nm illumination (see Fig. 4). By using the confocal microscope in the “line scan” mode, both the diameter of retinal vessels (12) (see Fig. 3b) and the velocity of red blood cells flowing through vessels (13) can be monitored.
Fig. 3.
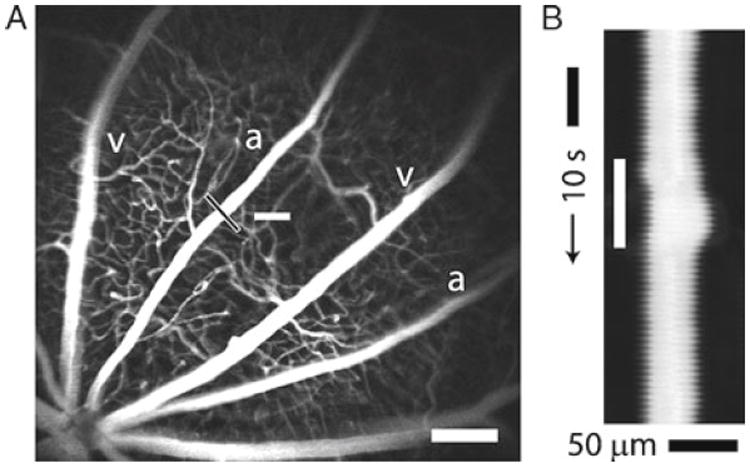
Confocal images of retinal vessels. (a) Retinal arterioles (a), venules (v), and capillaries are filled with dextran fluorescein isothiocyanate and imaged with confocal microscopy. The optic disc is at the lower left. The luminal diameter of the upper arteriole is measured with confocal line scans (black line). The nearby white bar indicates the location of the flickering light stimulus. Scale bar, 250 μm. (b) Line scan image obtained from the arteriole in (a). Distance (across the black line in (a)) is plotted as a function of time. A flickering light (white bar in (b)) evokes vessel dilation, indicated by the widening of the vessel cross section. The uneven edges of the vessel are caused by a respiratory movement artifact. Modified from ref. (12).
Fig. 4.
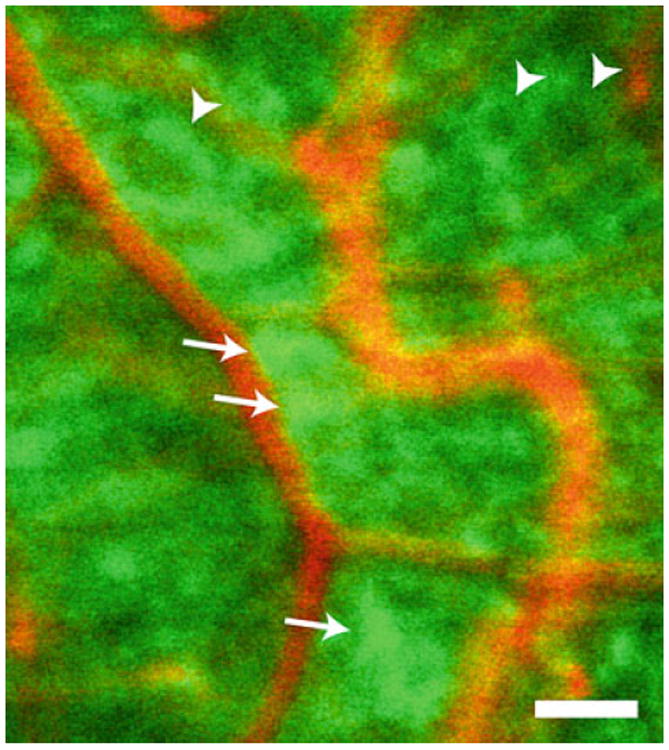
Glial cells of the retina. Glial cells (green) are labeled with the Ca2+ indicator dye Oregon Green 488 BAPTA-1 and vessels (orange) by intravenous ejection of dextran rhodamine B isothiocyanate in this confocal image of the retina. Several astrocytes (arrows) are visible. Most of the remaining labeled cells are Müller cells. Some Müller cells (arrowheads) are seen surrounding unlabeled somata of retinal ganglion cells. Scale bar, 100 μm.
3.5. Light Stimulation
Retinal photoreceptors are stimulated by light generated by the secondary (SIM) scanner of the FluoView 1000 laser scanning confocal microscope. Using this microscope, the wavelength, intensity, and scanning of the laser beam from the secondary scanner can be controlled independently of light from the primary scanner, which is used to acquire confocal and line scan images of retinal vessels. Retinal photoreceptors are stimulated using 559 nm light. This wavelength is near the maximal absorption wavelength of rat photoreceptors (14) and it does not interfere with the imaging of retinal vessels, which utilizes 488 nm excitation and a 500–550 nm emission bandpass.
3.6. Laser Speckle Flowmetry
Retinal blood flow is monitored by laser speckle flowmetry (LSF). A detailed discussion of LSF is beyond the scope of this chapter and is given elsewhere (12, 15). However, there are unique aspects of LSF that apply to the retinal preparation that are not encountered in other preparations and we describe these techniques here. The retina is illuminated with 808 nm infrared light from a laser diode and imaged with a digital camera. The collimated beam from the laser diode is focused onto one end of an optical fiber (240 μm diameter). The retina is illuminated trans-sclerally by gently pressing the other end of the optical fiber directly onto the surface of the sclera, approximately 1.5 mm below the limbus. The fiber is directed down onto the globe at a 35° angle from the horizontal. The fiber is held within a 25-gauge hypodermic needle which functions as a guide tube (see Figs. 1c and 2b).
3.7. Labeling and Stimulating Glial Cells
The Ca2+ indicator dye Oregon Green 488 BAPTA-1AM (OGB) is used to label glial cells (see Note 7). The labeling solution is prepared immediately before use by mixing 3 μL OGB (300 μg/mL) with 1 μL pluronic F-127 (7 mg/mL), 3 μL eserine (100 μM), and 25 μL saline (see Note 8). For experiments where glial cells are stimulated, 3 μL of the caged Ca2+ compound NP-EGTA is included in the labeling solution.
Prior to labeling, the vitreous humor is digested by enzymatic treatment with hyaluronidase to achieve efficient retinal glial cell labeling. 10 μL of hyaluronidase in saline (125 U/10 μL) is loaded into a Hamilton syringe attached to a 31-gauge needle. The needle is inserted into a 25-gauge guide needle until the tip of the inner needle is in line with the tip of the guide needle.
With the animal mounted under the microscope, the guide needle is inserted through the sclera and into the vitreous humor at a 35° angle from the horizontal, approximately 1.5 mm below the limbus. Once the 25-gauge guide needle has passed through the sclera and retina, the 31-gauge needle is advanced through the guide needle until it is touching the surface of the retina (see Fig. 2a). The needle is positioned under confocal observation using reflected light to view the retina.
The hyaluronidase solution is injected onto the surface of the retina at several locations. The needle is then withdrawn from the surface and the preparation is maintained for 1–2 h as the hyaluronidase breaks down the hyaluronic acid of the vitreous humor.
After the rest period of 1–2 h, the labeling solution is injected into the vitreous humor. 10 μL of the labeling solution is loaded into the same 31-gauge needle attached to the Hamilton syringe, which has been withdrawn from the 25-gauge guide needle. The 31-gauge needle is reinserted into the guide needle, which has remained in the eye. The labeling solution is injected into the vitreous humor near the retinal surface. Good labeling of glial cells is achieved 60–90 min after injection of the solution. The dye and caged Ca2+ compound are taken up selectively by the glial cells of the retina (16) (see Fig. 4).
Glial cells are stimulated by photolysis of caged Ca2+ with 405 nm light (see Note 9). The uncaging light is generated by the SIM scanner of the confocal microscope and is focused onto a small 5–10 μm spot on the retinal surface using the tornado scan mode of the SIM scanner (see Note 10). A 10 ms to 1 s pulse of 405 nm light is sufficient to generate a large Ca2+ increase in the stimulated cells (see Fig. 5a). Photolysis of caged Ca2+ often evokes a propagated Ca2+ wave that travels into adjacent glial cells.
Fig. 5.
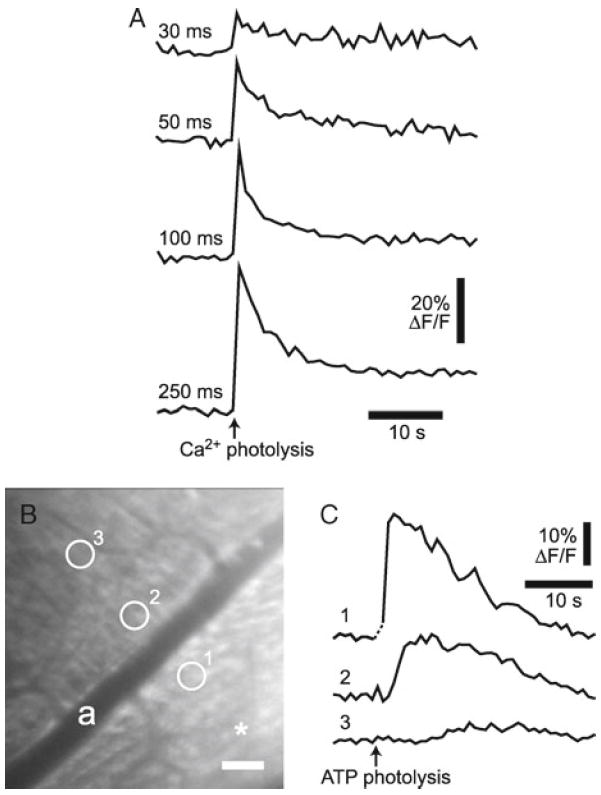
Glial cell Ca2+ increases. (a) Intracellular glial Ca2+ increases evoked by photolysis of caged Ca2+. Photolysis evokes Ca2+ increases proportional to the duration of the photolysis flash. Numbers indicate flash duration for each trial. (b, c) Glial Ca2+ increases and a propagated Ca2+ wave evoked by photolysis of caged ATP. (b) A confocal image of the retina showing OGB-labeled glial cells. Asterisk indicates the site of caged ATP photolysis; scale bar, 50 μm. (c) Stimulation of glial cells by photolysis of caged ATP in the vitreous humor evokes Ca2+ increases in the stimulated cells and initiates a propagated Ca2+ wave. Ca2+ is measured in the three regions indicated in (b).
3.8. Assessing Glia Function
3.8.1. Glial Ca2+ Increases
Previous work using the ex vivo isolated retina preparation demonstrated that retinal glial cells could communicate with each other through the generation of Ca2+ increases and intercellular Ca2+ waves. When a single glial cell is stimulated with a chemical, electrical, or mechanical stimulus, a Ca2+ increase is evoked in the stimulated cell. This Ca2+ increase propagates outward into neighboring astrocytes and Müller cells as a Ca2+ wave (16). Spontaneously generated glial Ca2+ waves are also observed (17). It was not known, however, whether these intercellular glial Ca2+ waves occur in vivo. The preparation described in this chapter has been employed to test whether glial Ca2+ increases and waves occur in vivo.
Spontaneous Ca2+ waves. Retinal glial cells are labeled with OGB, and confocal images of the labeled glial cells are acquired at a frequency of ~1 Hz. Spontaneous increases in glial Ca2+ that propagate outward into adjacent glial cells at a velocity of ~22 μm/s are observed (17), demonstrating that spontaneous intercellular glial Ca2+ waves do occur in vivo.
Photolysis-evoked Ca2+ increases. Retinal glial cells are labeled with OGB and caged Ca2+. Glial cells are stimulated by photolysis of caged Ca2+ while confocal images of the labeled glial cells are acquired at a frequency of ~1 Hz. Glial cell stimulation evokes Ca2+ increases in the stimulated cells. The increases in glial Ca2+ are proportional to the duration of the photolysis flash, with short flashes evoking small, brief increases and longer flashes evoking larger, more prolonged increases (see Fig. 5a). In many trials, photolysis of caged Ca2+ triggers propagated Ca2+ waves traveling through adjacent Müller cells and astrocytes. The results demonstrate that, as in the isolated retina (16, 18), photolysis of caged Ca2+ in vivo is effective in stimulating retinal glial cells and that glial cell stimulation leads to the initiation of intercellular glial Ca2+ waves.
ATP-evoked Ca2+ waves. Retinal glial cells are labeled with OGB. Glial cells are stimulated by photolysis of caged ATP in the vitreous humor while confocal images are acquired at a frequency of ~1 Hz. 10 μL of caged ATP solution (2 mM in saline) is injected into the vitreous humor near the retinal surface. The caged ATP is activated by brief (0.2–1 s), focused (5 μm diameter) flashes of 405 nm light. The released ATP stimulates retinal glial cells, evoking large increases in Ca2+ in the stimulated cells and initiating propagated Ca2+ waves (see Fig. 5b, c). The results demonstrate that, as in the isolated retina (18), activation of purinergic receptors evokes Ca2+ increases in retinal glial cells in vivo.
3.8.2. Glial Regulation of Blood Flow
Activation of retinal neurons by photic stimuli results in the dilation of retinal arterioles and increases in retinal blood flow (19). This response, termed functional hyperemia, brings added oxygen and glucose to the active neurons. Although the cellular mechanisms that mediate functional hyperemia remain controversial, recent evidence indicates that glial cells play a principal role in coupling neuronal activity to vessel dilation (9). We have shown that in the isolated retina, stimulation of glial cells results in the dilation of adjacent arterioles (8). It is not known, however, whether glial stimulation in vivo leads to vessel dilation in the retina. The preparation described in this chapter has been employed to test whether glial cells regulate the diameter of retinal vessels in vivo.
Retinal glial cells are labeled with OGB and caged Ca2+, and vessels labeled by intravenous injection of dextran rhodamine B isothiocyanate.
Glial cells near a primary arteriole are stimulated by photolysis of caged Ca2+, while the luminal diameter of the arteriole is monitored with confocal line scans. As described above in Subheading 3.8.1, glial cell stimulation evokes Ca2+ increases in the stimulated cells. When glial cells adjacent to an arteriole are activated, an increase in arteriole diameter is evoked (see Fig. 6). These results demonstrate that glial cells can control vessel diameter in vivo and support the hypothesis that glial cells mediate functional hyperemia in the retina.
Fig. 6.
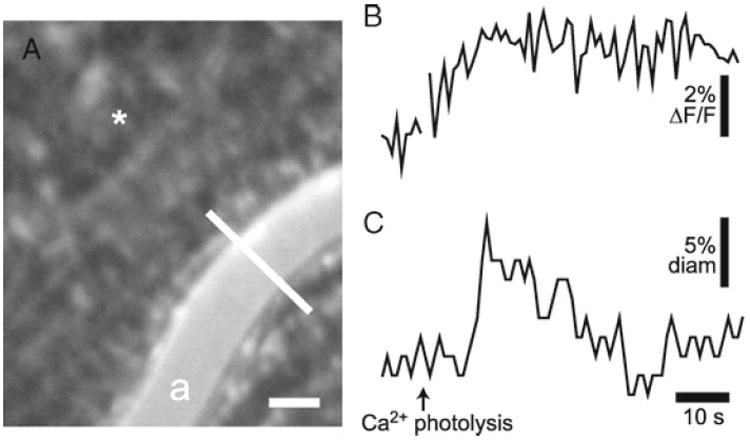
Glial-evoked dilation of retinal arteriole. (a) Confocal image of the retina, showing OGB-labeled glial cells and an arteriole (a) labeled with dextran rhodamine B isothiocyanate. The luminal diameter of the arteriole is monitored with confocal line scans (the white line across the vessel). Asterisk indicates the site of caged Ca2+ photolysis; scale bar, 25 μm. (b) Glial Ca2+ fluorescence measured near the arteriole. Photolysis of caged Ca2+ evokes a glial Ca2+ increase. (c) The luminal diameter of the arteriole. Photolysis evokes a transient increase in vessel diameter.
Acknowledgments
The development of the in vivo preparation was supported by Fondation Leducq, NIH EY004077, and NIH TRINOD Training Grant.
Footnotes
α-Chloralose HBC complex, rather than uncomplexed α-chloralose, is used, as the HBC complex of α-chloralose is fully soluble in water while uncomplexed chloralose is difficult to solubilize. Chloralose concentrations are specified for the molecular weight of the α-chloralose HBC complex, which is ten times the molecular weight of the uncomplexed α-chloralose.
The oculocardiac reflex is triggered by pressure on the eyeball or traction on the extraocular muscles and results in a decrease in heart rate and blood pressure. The reflex is a parasympathetic response mediated by the trigeminal and vagus nerves. It can be prevented by intravenous injection of the muscarinic antagonist atropine, which blocks the vagal reflex.
The GPS solution sometimes leaks out from under the contact lens during the course of an experiment. If this occurs, the contact lens is removed, more solution added to the cornea, and the contact lens replaced.
The choice of anesthetic is critical when characterizing vascular responses. Some anesthetics suppress the functional hyperemia response while α-chloralose leaves the response largely intact (20).
It is particularly important to maintain blood pressure within the normal range when characterizing vascular responses. If blood pressure drops below the physiological range, the diameter of retinal arterioles oscillates and the functional hyperemia response is lost.
It is critically important to maintain blood gasses within the physiological range when characterizing vascular responses. High pO2 results in attenuation of light-evoked vasodilation while low pO2 leads to vessel oscillations and a loss of light-evoked dilation. A pulse oximeter can be used to continuously monitor blood O2 saturation, which gives an estimate of blood pO2 levels. Blood pH is also important. If the pH falls outside the normal range, either high or low, light-evoked vasodilations are attenuated or are eliminated and vessels may oscillate. pCO2 is directly linked to pH and can be monitored continuously by measuring end-tidal CO2 levels.
The Ca2+ indicator dye Fluo-4 is often used to measure glial Ca2+ and was used previously to monitor Ca2+ levels in the isolated retina preparation (18). However, we find that Fluo-4 is ineffective in labeling retinal glial cells in vivo while OGB labels both astrocytes and Müller cells. OGB has a higher Ca2+ affinity than does Fluo-4 (Kd of 170 vs. 345 nM) and this may account for the difference in labeling.
Pluronic F-127 facilitates the uptake of OGB and NP-EGTA into retinal glial cells. Eserine inhibits esterases in the vitreous humor and prevents cleavage of the AM ester groups of OGB and NP-EGTA until it enters the glial cells (21).
405 nm light, rather than UV light (normally employed for photolysis of caged compounds), is used in this preparation for several reasons. First, the plastic contact lens and the lens of the eye are transparent at 405 nm but not at UV wavelengths. Second, confocal microscopes are typically equipped with 405 nm but not UV lasers. Third, the optics of the SIM scanner of the Olympus FV1000 microscope is not compatible with UV wavelengths.
Due to chromatic aberration of the eye, 405 nm light projected onto the retina is distorted. A 5 μm spot will be blurred to a circle ~40 μm in diameter. In addition, the spot will be displaced laterally if the illumination is off axis.
References
- 1.Newman EA. Retinal glia. In: Squire LR, editor. Encyclopedia of Neuroscience. Vol. 8. Academic Press; Oxford: 2009. pp. 225–232. [Google Scholar]
- 2.Kofuji P, Newman EA. Potassium homeostasis in glia. In: Squire LR, editor. Encyclopedia of Neuroscience. Vol. 7. Academic Press; Oxford: 2009. pp. 867–872. [Google Scholar]
- 3.Newman EA, Frambach DA, Odette LL. Control of extracellular potassium levels by retinal glial cell K+ siphoning. Science. 1984;225:1174. doi: 10.1126/science.6474173. [DOI] [PMC free article] [PubMed] [Google Scholar]
- 4.Brew H, Attwell D. Electrogenic glutamate uptake is a major current carrier in the membrane of axolotl retinal glial cells. Nature. 1987;327:707. doi: 10.1038/327707a0. [DOI] [PubMed] [Google Scholar]
- 5.Newman EA. Calcium increases in retinal glial cells evoked by light-induced neuronal activity. J Neurosci. 2005;25:5502. doi: 10.1523/JNEUROSCI.1354-05.2005. [DOI] [PMC free article] [PubMed] [Google Scholar]
- 6.Newman EA. Glial cell inhibition of neurons by release of ATP. J Neurosci. 2003;23:1659. doi: 10.1523/JNEUROSCI.23-05-01659.2003. [DOI] [PMC free article] [PubMed] [Google Scholar]
- 7.Clark BD, Kurth-Nelson ZL, Newman EA. Adenosine-evoked hyperpolarization of retinal ganglion cells is mediated by G-protein-coupled inwardly rectifying K+ and small conductance Ca2+-activated K+ channel activation. J Neurosci. 2009;29:11237. doi: 10.1523/JNEUROSCI.2836-09.2009. [DOI] [PMC free article] [PubMed] [Google Scholar]
- 8.Metea MR, Newman EA. Glial cells dilate and constrict blood vessels: a mechanism of neurovascular coupling. J Neurosci. 2006;26:2862. doi: 10.1523/JNEUROSCI.4048-05.2006. [DOI] [PMC free article] [PubMed] [Google Scholar]
- 9.Attwell D, et al. Glial and neuronal control of brain blood flow. Nature. 2010;468:232. doi: 10.1038/nature09613. [DOI] [PMC free article] [PubMed] [Google Scholar]
- 10.Metea MR, Kofuji P, Newman EA. Neurovascular coupling is not mediated by potassium siphoning from glial cells. J Neurosci. 2007;27:2468. doi: 10.1523/JNEUROSCI.3204-06.2007. [DOI] [PMC free article] [PubMed] [Google Scholar]
- 11.Gordon GRJ, Choi HB, Rungta RL, Ellis-Davies GCR, MacVicar BA. Brain metabolism dictates the polarity of astrocyte control over arterioles. Nature. 2008;456:745. doi: 10.1038/nature07525. [DOI] [PMC free article] [PubMed] [Google Scholar]
- 12.Srienc AI, Kurth-Nelson ZL, Newman EA. Imaging retinal blood flow with laser speckle flowmetry. Front Neuroenerg. 2010;2:128. doi: 10.3389/fnene.2010.00128. [DOI] [PMC free article] [PubMed] [Google Scholar]
- 13.Schaffer CB, et al. Two-photon imaging of cortical surface microvessels reveals a robust redistribution in blood flow after vascular occlusion. PLoS Biol. 2006;4:258. doi: 10.1371/journal.pbio.0040022. [DOI] [PMC free article] [PubMed] [Google Scholar]
- 14.Jacobs GH, Fenwick JA, Williams GA. Cone-based vision of rats for ultraviolet and visible lights. J Exp Biol. 2001;204:2439. doi: 10.1242/jeb.204.14.2439. [DOI] [PubMed] [Google Scholar]
- 15.Dunn AK, Bolay H, Moskowitz MA, Boas DA. Dynamic imaging of cerebral blood flow using laser speckle. J Cereb Blood Flow Metab. 2001;21:195. doi: 10.1097/00004647-200103000-00002. [DOI] [PubMed] [Google Scholar]
- 16.Newman EA, Zahs KR. Calcium waves in retinal glial cells. Science. 1997;275:844. doi: 10.1126/science.275.5301.844. [DOI] [PMC free article] [PubMed] [Google Scholar]
- 17.Kurth-Nelson ZL, Mishra A, Newman EA. Spontaneous glial calcium waves in the retina develop over early adulthood. J Neurosci. 2009;29:11339. doi: 10.1523/JNEUROSCI.2493-09.2009. [DOI] [PMC free article] [PubMed] [Google Scholar]
- 18.Newman EA. Propagation of intercellular calcium waves in retinal astrocytes and Müller cells. J Neurosci. 2001;21:2215. doi: 10.1523/JNEUROSCI.21-07-02215.2001. [DOI] [PMC free article] [PubMed] [Google Scholar]
- 19.Riva CE, Logean E, Falsini B. Visually evoked hemodynamical response and assessment of neurovascular coupling in the optic nerve and retina. Prog Ret Eye Res. 2005;24:183. doi: 10.1016/j.preteyeres.2004.07.002. [DOI] [PubMed] [Google Scholar]
- 20.Franceschini MA, et al. The effect of different anesthetics on neurovascular coupling. Neuroimage. 2010;51:1367. doi: 10.1016/j.neuroimage.2010.03.060. [DOI] [PMC free article] [PubMed] [Google Scholar]
- 21.Kuchitsu K, Ward JM, Allen GJ, Schelle I, Schroeder JI. Loading acetoxymethyl ester fluorescent dyes into the cytoplasm of Arabidopsis and Commelina guard cells. New Phytol. 2002;153:527. doi: 10.1046/j.0028-646X.2001.00346.x. [DOI] [PubMed] [Google Scholar]


