Abstract
In this paper, we examine the folding behaviour of Tachi–Miura polyhedron (TMP) bellows made of paper, which is known as a rigid-foldable structure, and construct a theoretical model to predict the mechanical energy associated with the compression of TMP bellows, which is compared with the experimentally measured energy, resulting in the gap between the mechanical work by the compression force and the bending energy distributed along all the crease lines. The extended Hamilton's principle is applied to explain the gap which is considered to be energy dissipation in the mechanical behaviour of TMP bellows.
Keywords: Tachi–Miura polyhedron, origami, Miura-ori, extended Hamilton's principle, energy dissipation
1. Introduction
Foldable structures are widely used in various fields. For example, deployable large structures in space are required to fold compactly while on the ground, and expand smoothly into full-sized structures in space. The key geometries of space-deployable structures are membranes and hollow cylinders. Some attempts have been made to study optimum foldable structures through folding patterns based on origami design, which is the art of paper folding. Origami is a Japanese art, meaning ‘folding papers’, and has been used extensively for making figures such as birds and elephants, out of flat paper. Origami patterns are applied to cylindrical structures or thin-walled tubes.
Guest & Pellegrino [1] studied a triangulated foldable cylinder for deployable mast structures. Their proposed cylindrical structures are made of a helical strip with triangular panels. They also performed axial compression tests, which were compared to the result of computational simulation [2]. Hunt & Ario [3] studied the buckling pattern of a thin cylindrical piece of paper under torsional loading to observe that the folding geometry is similar to the Yoshimura pattern [4], composed of rigid faces and mountain-valley crease lines. Ario & Nakazawa [5] studied the folding patterns of multi-layered pantographic truss structure with pin joints by using static and dynamic numerical methods, where the truss material is assumed to be elastic and also elasto-plastic material. They predicted the force–displacement relationship of such a multi-layered truss structure. Ma & You [6] designed several tubes with an origami pattern with the aim of using them as energy absorbing structures. Song et al. [7] applied origami pattern to thin-walled tubes to achieve uniform crushing processes with the aim of lowering the initial peak in the force–displacement curve while maintaining almost uniform compression force. Although many types of tubes or cylindrical structures with origami patterns have been proposed, rigid-origami patterns, in which deformation takes place only along crease lines, are better suited to minimize the elastic energy associated with deformations of materials during compression (or folding).
Inspired by the Yoshimura buckling pattern of a hollow cylinder under compression [4], Miura [8] proposed a developable double corrugation (DDC) method. To prove this DDC concept, Tanizawa & Miura [9] made a rigorous model based on the Galerkin method, where the total elastic energy of a buckled flat sheet can become a minimum. Among several patterns of such buckled corrugated shapes, they found that the so-called Miura-ori pattern gave rise to the minimum elastic energy. This pattern is also used for studying on the folding and unfolding behaviours of tree leaves [10] and deployable structure design based on the folding pattern of leaves [11]. A more generalized form of the Miura-ori pattern has also been investigated so that an approximation of a double-curved surface with rigid-folding motion can be constructed [12]. Wu & You [13] studied an ordinary grocery shopping bag which is not rigid foldable and proposed a new crease pattern that enables folding using rigid materials, which can be applied in the packaging industry. Recently, the Tachi–Miura Polyhedron (TMP) [14,15], which takes advantage of Miura-ori features, was proposed. Unlike other cylinders, this structure has a feature of having rigid foldability while filling a three-dimensional space; therefore, it can be applied to various deployable structures and actuators using rigid panels while the deformation takes place only along the crease lines.
In this paper, we examine the folding behaviour of TMP bellows made out of paper sheets under compression load along the cylinder axis, both experimentally and analytically. As far as the application of a developable structure is concerned, the structure should fold and unfold easily. A paper sheet is flexible and easy to make crease lines, therefore we have used paper to study the folding behaviour of the TMP in this paper.
2. Tachi–Miura polyhedron: geometry
Tachi–Miura polyhedron [15] is shown in figure 1.
Figure 1.

(a) Tachi–Miura polyhedron and (b) its folding motion from left to right.
Figure 2b shows the flat sheet geometry of the TMP, which is characterized by length parameters; l, m, d, an inner angle of parallelogram α which remains constant during the folding of TMP and the number (N) of repeating unit areas (shaded area in figure 2b), where two identical origami papers (front and back) are connected to form a bellows-like structure, shown in figure 2a.
Figure 2.

(a) Tachi–Miura polyhedron where the black solid line shown on the side surface is discussed in figure 4, (b) its initial flat sheet geometry and (c) repeating unit cell.
(a). Folding angles
To examine the characteristics of the TMP, we examine the geometry of a Miura-ori unit as shown in figure 3 where several folding angles are defined, and the solid and dashed lines are mountain and valley folding lines, respectively. Let the horizontal crease lines (parallel to the x–y plane) be the main crease lines, and the crease lines tilted with respect to the horizontal plane (x–y plane) be sub-crease lines. Figure 3 shows details of the repeated unit cell where the main creases are O0O1 and O1O2, and sub-creases are O1A1 and O1B1. This flat sheet geometry of Miura-ori (figure 3b) is repeated throughout the TMP, where the main geometrical parameters are; an inner angle α, half of the dihedral angle of main fold θM that is the angle of a main crease line and half of the dihedral angle of sub-fold θS that is the angle of a sub-crease line (figure 3c). It is noted that α remains constant, and θM and θS change during the TMP bellows compression.
Figure 3.
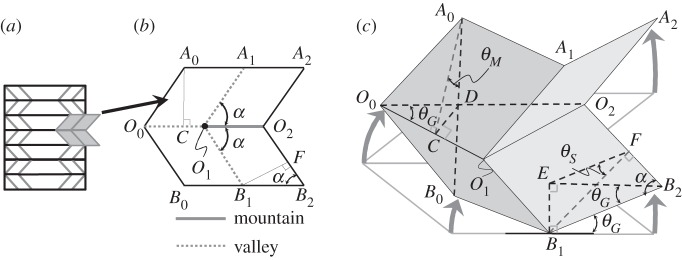
(a) Repeating Miura-ori unit cell shown in grey coloured area, (b) its flat sheet, which is folded into (c).
The equations relating these angles (α, θM, θS) are obtained as
 |
2.1 |
and
 |
2.2 |
To calculate the total length of all TMP crease lines, we focus on a TMP with N=2 case, at first. The width of the development of the TMP is ( ) (see the repeating unit cell as shown in figure 2c), thus the total length of the main crease lines is
  ). Note that the TMP bellows consists of two sheets as developed and shown in figure 2. Next, the length of one single sub-crease line is
  , therefore the total length of all sub-crease lines is
  because the TMP with N=2 has eight sub-crease lines. Generalizing this calculation to the TMP with N repeated units case, we obtain the total length of all main crease lines to be
  and the length of all sub-crease lines to be
  .
.
The main fold angle θM can be determined by the height H of the TMP bellows as follows (figure 4):
| 2.3 |
where d is the width of the repeated cell in figure 2c, equal to the length between adjacent crease lines shown in figure 5, where only a repeated folding cell is shown and θk is the angle of the main crease (k=M) or the sub-crease line (k=S).
Figure 4.
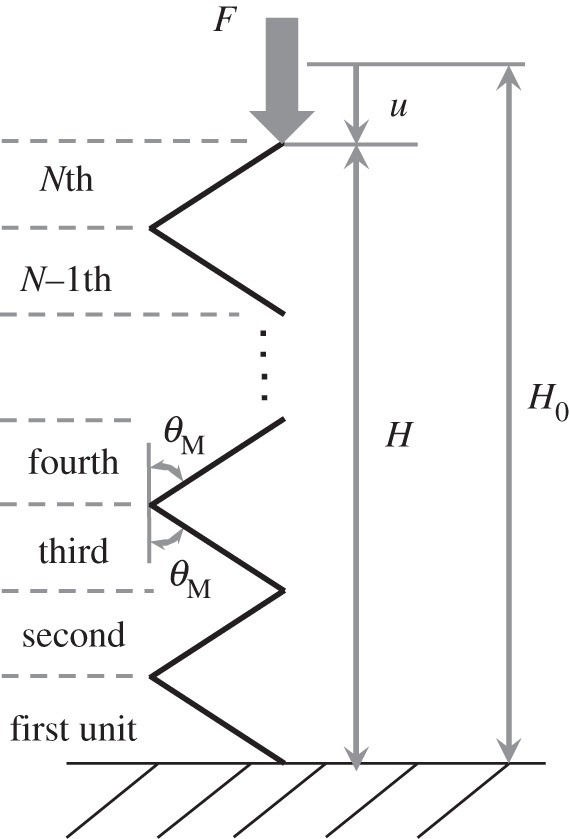
Side view of the black line shown in figure 2a.
Figure 5.
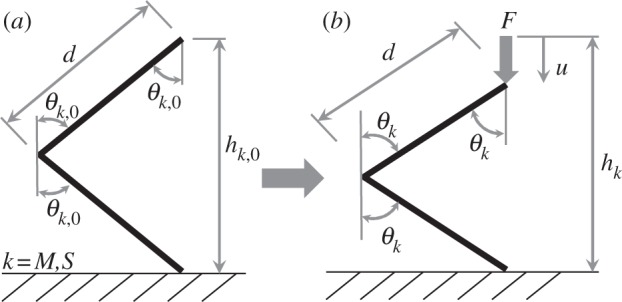
Definition of folding angles of main or sub-crease line θk (k=M,S) at initial (a) and current folding (b).
3. Folding behaviour of Tachi–Miura polyhedron bellows: experiments
In order to examine the behaviour of folding a TMP bellows experimentally, we used an Instron machine (model 8521S) to conduct compression tests in the axial direction on five identical specimens of TMP bellows made out of paper (Strathmore 500 Bristol,2 Ply, Plate Surface, 235–72, thickness t is 0.27 mm), with each sample being tested once. The parameters which determine the dimensions of the initial flat sheet geometry of the TMP bellows (see figure 2) are α=45°, l=30 mm, M=30 mm, d=30 mm and N=7.
The initial height of the TMP H0 (figure 2a) is 150 mm. Let the initial main fold and sub-fold angles of the TMP be θM,0 and θS,0, respectively, with θM,0=44.4° and θS,0=54.2° in the initial condition. The TMP bellows is compressed up to a maximum displacement of 100 mm at a rate of 2.0 mm s−1, therefore the final height of the TMP bellows is 50 mm, the final angle of the main fold is 76.2° and the final angle of the sub-fold is 80.2°.
Figure 6 shows the force (F)–displacement (u) data of the TMP bellows under compression in which the black solid lines indicate the upper and lower boundary of experimental data based on five compression tests, and the dashed line indicates the approximated F–u relationship based on the least-squares fitting: Fapp=6.42×10⁻⁶u3−9.45×10⁻⁴u2+0.1u+0.2, where Fapp is the applied compressive force in Newtons, and u is the displacement in millimetres. Integrating this equation from 0 mm to the total displacement (100 mm), we obtain the mechanical work done by compression loading W=0.338 J, which is the area underneath the F–u curve shown in figure 6.
Figure 6.
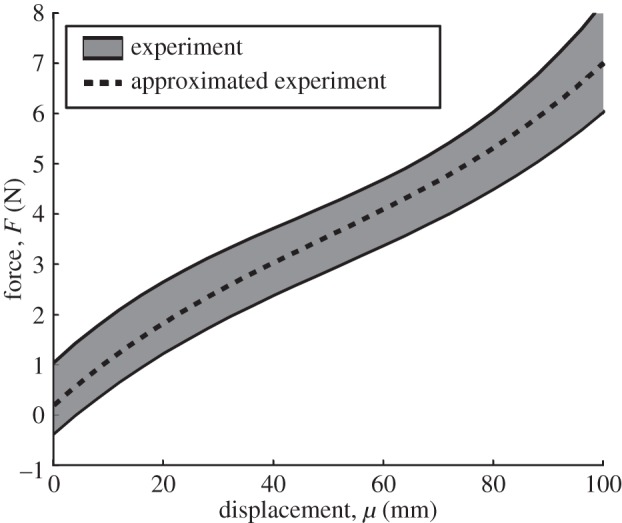
Force–displacement relationship of the TMP bellows under compression.
4. Analysis on folding behaviour of Tachi–Miura polyhedron
To investigate the folding behaviour of the TMP, we discuss the modelling of the force–displacement relationship by using the principle of virtual work, followed by the modification of folding angles based on the paper thickness. We also examine the bending moment of each hinge line in terms of the folding angle, followed by a comparison of the predictions based on the model and the experiment that we discussed in previous section.
(a). Modelling of the force–displacement relationship
As far as rigid-foldable structures are concerned, their flat facets remain flat during folding while deformation takes place only along the crease lines in terms of a bending moment vector along the crease line. Under a conservative system, the mechanical work done by the external force is supposed to be equal to the bending energy along the crease lines, and the required compression force can be obtained by using the principle of virtual work;
 |
4.1 |
where δθk is the change in fold angle of a crease line, M(θk) is the corresponding bending moment per unit length and l is the length of the crease line. The TMP consists of two types of crease lines: main crease and sub-crease lines. Therefore, the right-hand side of equation (4.1) is modified to
 |
4.2 |
where lM,i is the length of ith main crease line, and lS,j the length of jth sub-crease line.
By applying a variation to equation (2.1) with respect to θG and θM, we obtain
| 4.3 |
Similarly, we apply a variation to equation (2.2), to obtain
 |
4.4 |
It is noted that the main fold angle θM is related to displacement u by equation (2.3). Taking a variation of equation (2.3), we obtain
| 4.5 |
By substituting equations (4.4) and (4.5) into (4.2), we obtain the following relation:
 |
resulting in
 |
4.6 |
because the folding angles θM and θS are calculated by using displacement u based on equations (2.1)–(2.3). Therefore, the F–u curve can be obtained from equation (4.6).
(b). Effects of paper thickness
The above model is made based on the assumption that the paper is thin, mathematically having no thickness, which is not correct. Here, we will examine the effects of finite thickness of paper on the force–displacement relationship of TMP bellows. The folding angle defined in figure 5, θk (k=M,S) is obtained assuming that the thickness of a piece of paper is extremely thin and is given by equation (2.3).
When we apply a representative TMP crease pattern to a sheet of paper, the thickness of the paper (t) affects the geometry of folding angles, particularly the radius of curvature ρ (here we assume that the radius of curvature ρ is constant along the curved crease line, figure 7). In addition to this, the TMP bellows is made of two identical sheets of paper, which are bonded. This overlapped area of the two origami sheets also affects the mechanical behaviour of the TMP bellows, thus we consider these effects in revising equation (4.6). To this end, we consider the crease model with finite paper thickness as shown in figure 7.
Figure 7.
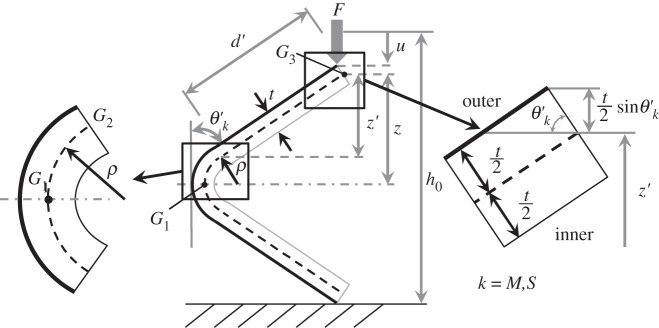
Folding of unit paper cell by accounting for the effect of the paper thickness t.
First, half of the height of the unit paper cell (z) and the rigid flat surface of the unit paper cell (z′) are calculated as follows:
 |
4.7a |
and
 |
4.7b |
where hk,0 is the initial height of the main or sub-crease line and u is displacement.
Second, the length of G1G2 (dashed line in figure 7 centre) is d as shown in figure 5. With a finite thickness, G1G2 is expressed as follows:
| 4.8 |
where d is the arc length of the mid-plane, G1G3.
Therefore, the relationship between the folding angle ( ) and TMP bellows displacement (u) is expressed by
 |
4.9a |
It is noted that equation (4.9a) replaces equation (2.3) by accounting for paper thickness. Solving for u in equation (4.9a), we obtain
| 4.9b |
Here, we assume that ρθ′k≪d to obtain
 |
4.10 |
where
 |
4.11 |
Therefore, folding angle  which contains the effect of the paper thickness t is obtained as follows:
 |
4.12 |
For the present dimensions of the TMP bellows, the thickness of the paper t is 0.27 mm and its radius of curvature ρ is 0.38 mm, thus we assume that the magnitudes of t and ρ are much smaller than d=30 mm (sheet length), which allows for the following equation to be obtained:
| 4.13 |
Using equations (2.3), (4.12) and (4.13), the difference between θk and θ′k is obtained as
| 4.14 |
Therefore, ξ is the difference between the ideal case in which t is zero, and the case in which the thickness of the paper is considered. This parameter represents the effect of t.
In the above discussion, we considered only the effect of one crease line composed of only one sheet of paper. Next, we consider the bonded (overlapped) area and the crease line attached to the area as shown in figure 8. For the overlapped area of the TMP bellows, figure 8a shows the side view of the TMP at θM=0°, and where the dark shaded area is the overlapped area where the two sheets are bonded. Also in figure 8a, the black thick lines show the sub-crease lines, and the dashed lines indicate the main crease lines that are affected by the overlapped area. Figure 8b is the top view of the TMP at the folding angle θM=90°, i.e. completely flattened geometry, where the overlap of the TMP faces are shown shaded. The figure also shows the number of overlaps in each area. Because of these overlapped areas, the mechanical behaviour of these crease lines (black thick and dashed lines in figure 8) is different from that of other crease lines, thus these crease lines should be treated differently. The calculation of the folding angle especially should be done differently from that of the other crease lines.
Figure 8.
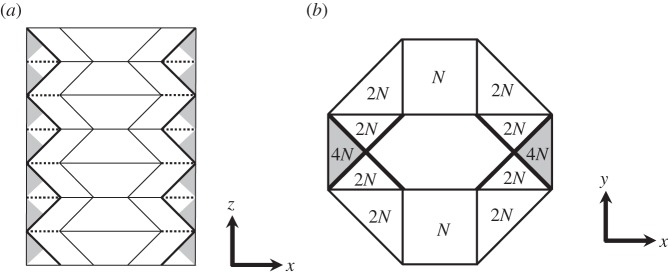
(a) Side view of TMP with θM=0°, showing overlap area (dark shaded area) in which two sheets of paper are attached. Black thick lines indicate the sub-crease lines and dashed lines indicate the main crease lines that are affected by the overlap area, (b) top view of the TMP with θM=90°, showing the number of overlaps in each area. N is the number of repeating unit area.
Considering the effect of the overlapped area on the sub-crease lines (black thick lines in figure 8), we get a revised value of ξ that is
 |
4.15 |
where no is the factor of overlaps to implement the effect of the bonded area (see appendix A). Considering equation (4.15) and the effect of paper thickness and overlap of facets, we obtain the revised formula for F, i.e. revision of equation (4.6)
 |
4.16 |
where ξi (or ξj) takes ξ or ξ′, which depend on the main crease lines i (or sub-crease line, j). Note that the folding angles θM and θS are a function of the displacement u, which are obtained from equations (2.1), (2.2) and (4.12). Therefore, the predicted compression force expressed as (4.16) is a function of displacement u and gives a F–u curve. It is noted that a similar analytical treatment was used by Natori et al. [16], when they analysed a membrane origami structure folding pattern introducing effective thickness t* to approximate the effects of the material thickness. On the other hand, our approach focuses on a folding angle that is based on thickness and radius of curvature and represents those effects, as ξi, that can be obtained through the geometry of the crease pattern.
(c). Measurement of the M–θ* relationship of unit paper cell
In this section, we discuss the validity of our model. Before using equation (4.16), we performed a paper folding test on a unit paper cell specimen made of the same paper used in the compression tests of the TMP bellows (Strathmore 500 Bristol, 2 Ply, Plate Surface, 235–72 and thickness t is 0.27 mm). The unit paper cell specimen used has a width of 90 mm, and the length from the crease line is 70 mm. To measure the force required to bend the paper specimen, we used a force sensor (IMADA DS2–1 Digital Force Gauge with a 5 N capacity). Using equations (2.3) and (4.14), we obtained the relationship between the displacement u, the folding angle θ′, and the bending moment along the crease line as  . The initial height (h0) of the unit paper cell specimen was 101 mm, with a displacement rate of 0.2 mm s−1, and the initial folding angle
  of 44° is folded to 88°. Here, we introduce the non-dimensional folding angle ratio θ* as follows:
 |
4.17 |
where θ* is a normalized angle change, indicating the fraction of the bending angle of a crease over the entire angle change, i.e. from the initial angle to final angle. Based on this, the M–θ* curve of the unit paper cell specimen was obtained experimentally as shown in figure 9, in which the black lines indicate the boundaries of the experimental data based on five paper bending tests, and the dashed line is an approximation of the experimental data. We use a Gaussian function to approximate the nonlinear M–θ* curve as follows:
 |
4.18 |
In this case, n=3 is used.
Figure 9.
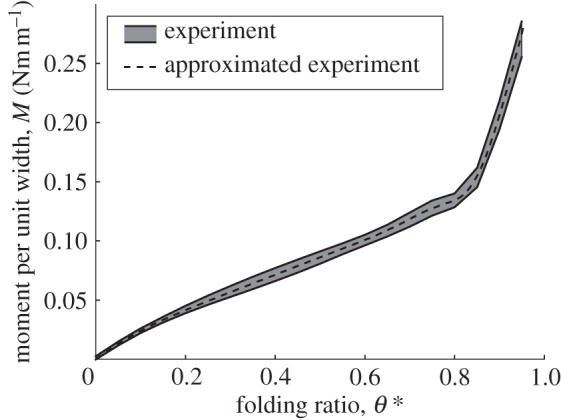
M–θ* relationship of the unit paper cell experiment.
Table 1 shows a set of the coefficients of the approximation function based on the Gaussian function. Selection of these coefficients is made such that the square of the difference between the predicted values and experimental values after it is integrated over the entire region of θ* becomes the minimum, i.e. least-square criterion. It is noted that there exists a clear kink point in the M–θ* curve of figure 9 around θ*=0.82 that may correspond to the onset of plastic deformation of the paper unit sample. To analyse this kink point, we performed tensile tests on five flat paper sheets.
Table 1.
Coefficients in equation (4.18).
| c0 | c1 | c2 | c3 | c4 | c5 | c6 | c7 | c8 | c9 | c10 |
|---|---|---|---|---|---|---|---|---|---|---|
| 0.211 | 0.794 | −0.0363 | 0.855 | 0.0826 | −0.0500 | 0.818 | 0.201 | −0.648 | 0.905 | 0.854 |
Figure 10 shows the tensile stress (σ)–strain (ε) curves of the paper used in this study. Let the critical strain (or yield strain) at the yield stress σY,i be εC,i (i=1,2,3,4,5), respectively. The mean value of the critical strain for all five tests was  (table 2). We focused on the strain of the outer surface of the crease line under bending, shown as the black thick line in figure 7. Based on figure 7, the initial length of the outer surface is 2d, and its length at a folding angle θk (k=M,S) is 2d+tθk.
Figure 10.
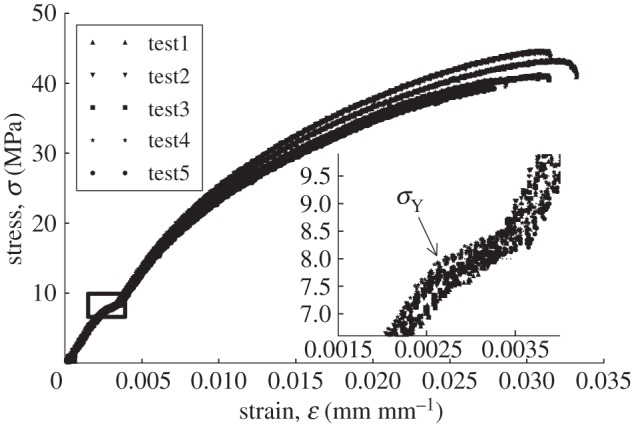
Stress–strain curve of a flat sheet under tension.
Table 2.
Critical strain εi shown in figure 10.
| test 1 | test 2 | test 3 | test 4 | test 5 | mean value 
|
|
|---|---|---|---|---|---|---|
| critical strain εi | 0.00282 | 0.00270 | 0.00286 | 0.00264 | 0.00265 | 0.00273 |
Therefore, the bending strain of the outer surface ε′ is expressed as follows:
| 4.19 |
Solving for θk, we obtain
| 4.20 |
Substituting  for ε′ into equation (4.20), the folding angle θk at the critical strain
  is θk=81.2° which is equal to
  based on equation (4.17). The predicted value of
  is in very good agreement with the experimental value of θ*=0.82, corresponding to the kink point of the M–θ* curve in figure 9, indicating that the critical strain
  is considered to be a cause of the kink point in the M–θ* curve of figure 9. Therefore, the bending stress at the outermost surface reaches an initial yield stress of the paper σY at first, and it is shifted to the inner point along the paper depth under an increasing bending moment.
(d). Comparison between the experiment and the predictions by the model
Figure 11 shows the experimental data of the F–u curve (dark area) and the predicted F–u curve based on equation (4.16) shown as a solid line. Although the predicted F–u curve agrees with the experimental data reasonably well, especially in the beginning of the compression, it underestimates the experimental data for larger displacements. In the following section, this discrepancy is discussed with respect to energy dissipation.
Figure 11.
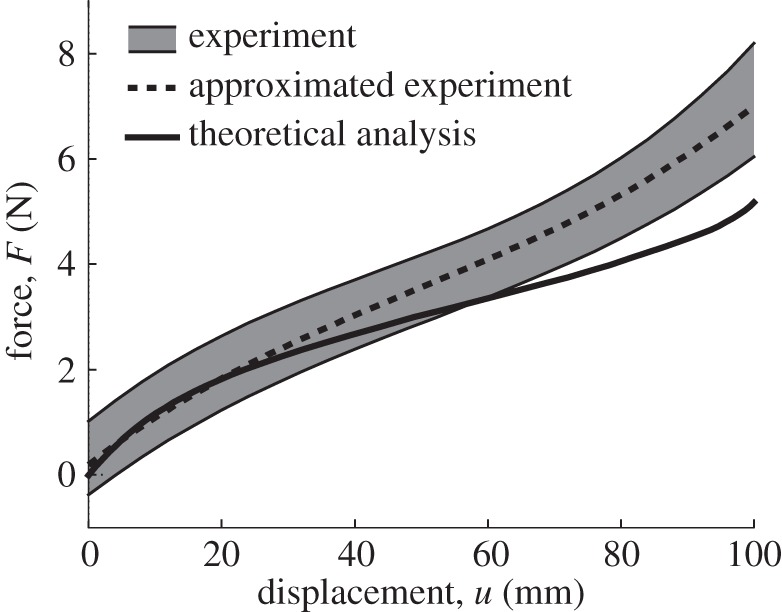
Comparison between experimental data and theoretical prediction of force–displacement relationship of TMP bellows under compression.
5. Discussion
(a). Extended Hamilton's principle
In developing the analytical formula for compression force (F)–displacement (u) behaviour (equation (4.16)), we assumed that the mechanical work done by the compression load is equal to the bending energy consumed along all crease lines. However, there is a gap between the experimental data and theoretical prediction, which is shown in figure 11. Therefore, to analyse this gap, we examine possible energy dissipation. To this end, we use the extended Hamilton's principle [17], which is defined as
 |
5.1 |
where t0 is the initial time, t1 the final time, T is kinetic energy and U is potential energy, which is composed of two terms; the elastic energy and the potential energy owing to the external force. Although δJ is zero in a conservative system, δJ is not zero in a non-conservative system where energy dissipation takes place. Taya & Mura [17] used the extended Hamilton's principle to analyse the energy dissipation (δJ) along the crease lines of a rectangular metal plate subjected to impact loading where the material along the crease lines was plastically deformed. When we apply the extended Hamilton's principle to the folding behaviour of TMP bellows, we obtain the following equation:
 |
5.2 |
where tf is the final time, V is volume, v is the velocity of the material element during compression of TMP bellows, ρd is the density of material, M is the bending moment along the crease line, F is the compressive force applied to the top of the TMP bellow and u is the corresponding displacement. In the middle of equation (5.2), the first term represents the kinetic energy, the second term is the bending energy along the crease lines, and the third term is the work done by the compressive force. In this study, we consider the case where the TMP bellows is compressed at a low speed, thus the kinetic energy term is negligible. Letting the energy owing to the bending of the crease lines be B and the mechanical work by the compressive force W, we only have to compare these two terms. The work by the bending moment B that is owing to the bending moment multiplied by the angle change along the crease lines can be obtained by using equation (4.1) as follows:
 |
5.3 |
where F′ is the theoretical predicted force based on equation (4.16).
It is noted here that for the quasi-static deformation of TMP bellows, use of equation (5.3) is justified, thus there is no need to use the extended Hamilton's principle. However, its effectiveness is justified for a high-speed bellows actuator, as the dynamic term (first term in the middle bracket in equation (5.2)) becomes large. Thus, use of the extended Hamilton principle provides a more accurate analytical tool.
By using the extended Hamilton's principle, the energy dissipation that occurs during compression can be estimated. The mechanical work done by the external force (W) is 0.338 J, and the bending energy (B) is 0.292 J, therefore the energy dissipation (δJ) is estimated to be 0.046 J. This led us to question where such energy dissipation would have taken place in the TMP bellows under compression loading. One speculation is that the energy dissipation takes place at vertices where the stress concentration would presumably take place, but this is not accounted for in the above model. Thus, we will examine this point in the following.
(b). Effect of vertices
We assembled the same TMP bellows where all vertices are removed as shown in figure 12 where the TMP bellows has the same dimensions as before. Considering the number of vertices, the total length of the main crease lines is reduced to 42(N−1) from the original length and that of the sub-crease lines is reduced to 48(N−1). We then applied compression loading to the TMP bellows, where the same conditions as described in §3 were used.
Figure 12.
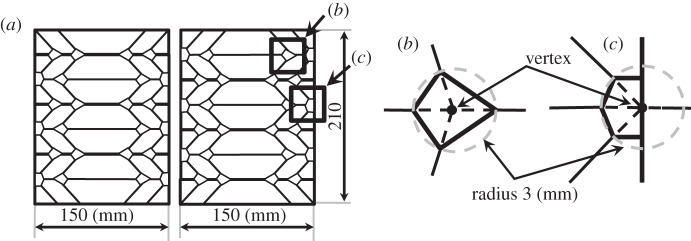
(a) Initial layout of TMP sheet whose vertices are removed, and (b,c) show the vertices removed.
Figure 13 shows the result of the compression test on the TMP bellows whose vertices are removed, where the solid line is the prediction by the model, using equation (4.16) where the net crease lines are reduced owing to the removal of the vertices, which are accounted in this modelling. The dashed line in figure 13 indicates an approximate F–u relationship: F′app=5.17×10⁻⁶u3−7.49×10⁻⁴u2+0.081u+0.14. By using the extended Hamilton's principle, we obtain W of 0.285 J, B of 0.254 J and δJ of 0.031 J. The theoretical F–u curve agrees with the experiment slightly better than the case where the vertices of the TMP are not removed, reducing δJ/W to 10.9%, from the 13.6% in the TMP bellows with vertices.
Figure 13.
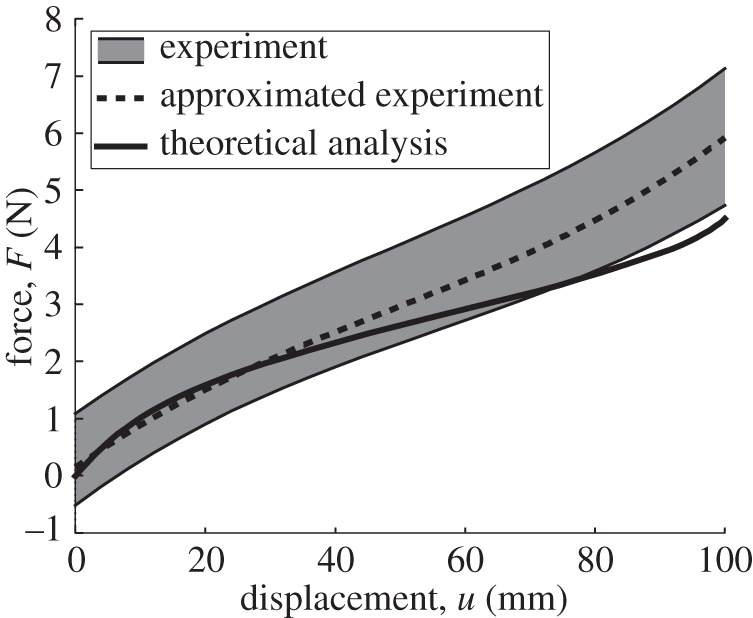
The force–displacement relationship of the TMP bellows under compression where vertices are removed.
By comparing the two cases, the TMP bellows with (figure 11), and without vertices (figure 13), the energy dissipation, δJ is smaller for the case of the TMP without vertices (0.031 J) as compared with that of the TMP with vertices (δJ=0.046 J). Therefore, we can conclude that a good fraction of the energy dissipation lies in the vertex of the TMP. One of the reasons why the vertex induces the energy dissipation is the high stress concentration around each vertex. Because four crease lines (two main crease lines and two sub-crease lines) are connected at each vertex, and those crease lines affect each other, the behaviour of the crease lines around the vertex is different. It is noted that the F–u curve of figure 13 indicates that the experimental data are more scattered. In addition, if we compare the maximum force, the case with vertices had a maximum force Fapp=7 N at u=100 mm, and the case without vertices had a maximum force of F′app=5.92 N, which is smaller than that of the case with vertices. Thus, removing the vertices of the TMP bellows makes its structure weaker compared with the TMP with its vertices intact.
We noted during the compression testing of the TMP that the main crease lines connected at the vertex rotate horizontally. When we consider the Miura-ori unit shown in figure 3, as main folds and sub-folds are being folded, creases O0O1 and O1O2 rotate horizontally around the vertex O1, with θG representing this rotation. O0O1 and O1O2 are connected at vertex O1, thus when the vertex O1 is removed, those two crease lines move independently and the effects of horizontal motion do not affect the folding behaviour. As far as the compression of TMP bellows is concerned, figure 14 shows the change of each folding angle (θM, θS and θG) during the compression loading (its displacement is u), which are calculated from equations (2.1)–(2.3). This leads to a change of the cross section of the TMP during compression. Figure 15a shows the cross-sectional area S at height H of the TMP, and figure 15b shows the top view of the cross-sectional area.
Figure 14.
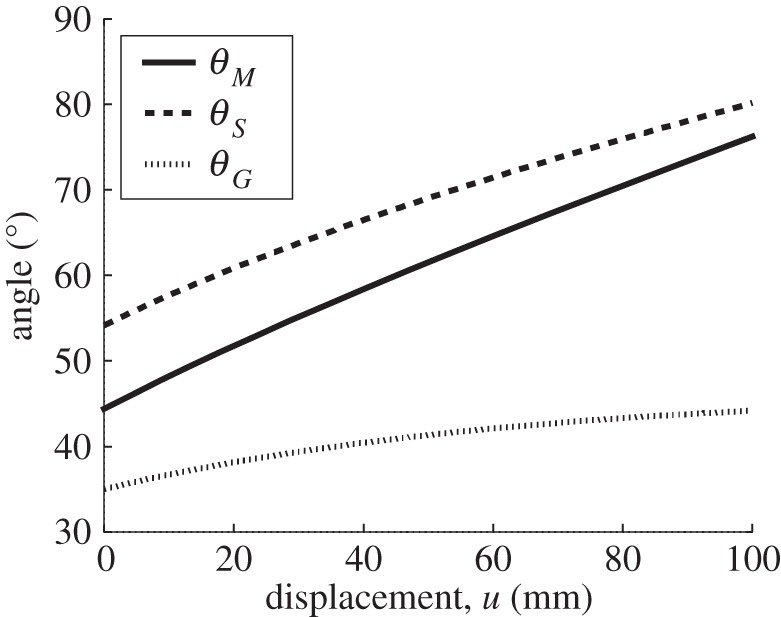
Change of folding angles θM, θS, θG during compression test of TMP bellows.
Figure 15.
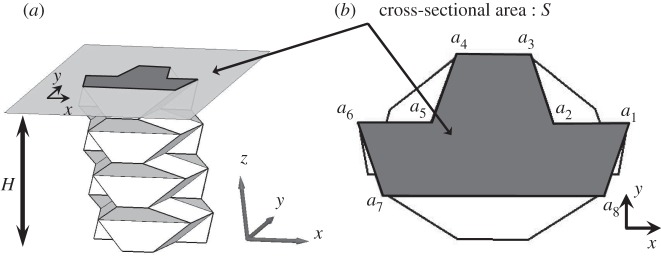
(a) Definition of the cross-sectional area at height H, (b) Top down view of the TMP. (ai: vertices in coloured x–y plane in (a)).
Figure 16a shows a comparison between the initial (dashed line) and the final configurations (solid line) in the compression test in terms of the motion of each vertex ai (i=1,…8) (see figure 15b). Figure 16a shows the translational motion of all vertices ai, and figure 16b shows the change of the cross-sectional area during the compression test. Therefore, the energy dissipation also occurs because of the translational motion of the vertices of the TMP, which is attributed to some of the discrepancies between the experimental data and the theoretical prediction.
Figure 16.
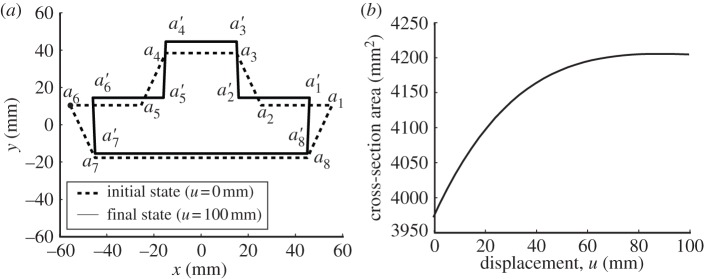
Cross section of TMP (ai: vertices at initial state, a′i: at final state, black solid lines: path of each vertex) before and after the compression (a) and change of the cross-sectional area as a function of compression displacement (b).
The results of figure 16b imply that the current design of TMP bellows has two opening ends, top and bottom, and that their cross-sectional area increases rapidly for the initial compression loading, but become almost constant during the later stage of compressive loading. If this TMP bellows is transferred to a real actuator design, we may have to attach an elastic membrane to close the top and bottom opening, where there exists a frictional energy dissipation taking place between the external bodies interfacing with the top and bottom surface of the TMP bellows and the TMP bellows with the elastic membrane.
Based on figure 16a, we estimated the energy dissipation owing to the friction at the top and bottom surfaces, and the estimated energy is 0.0068 J (see appendix B). Considering δJ values for the case of the TMP with vertices (δJ=0.046 J) and without vertices (δJ=0.031 J), we obtain the difference between these two values (0.015 J=0.046 J−0.031 J=ΔδJ). The value of ΔδJ is larger than that of the energy dissipation owing to the frictions of the top and bottom surfaces of the TMP bellows, i.e. δJ=0.0068 J. Therefore, it is speculated that additional energy dissipations take place.
The preceeding results are all based on the one-time compression of the TMP bellows. To examine the behaviour of TMP under cyclic loading, we conducted cyclic loading tests on three samples of TMP whose dimensions are the same as those in the compression test we discussed earlier. We applied the load to the sample at a frequency of 0.01 Hz.
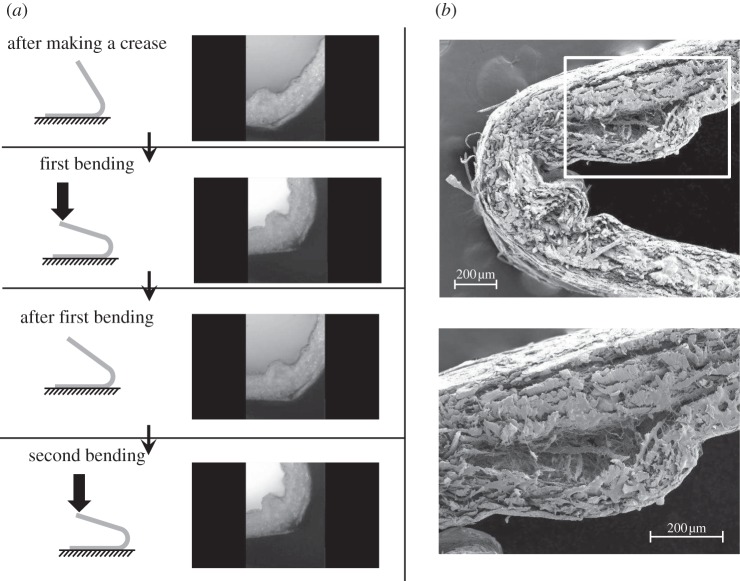
Figure 17a shows the force–displacement curve of the cyclic loading tests, with the upper curves indicate the loading and lower curves indicate the unloading curves. The loading curves shift downward as the number of cycles increase. We also calculated the closed loop area in each cycle, and this closed loop area is considered to be the energy dissipation for each cycle. Figure 17b shows the closed loop area (the energy dissipation) as a function of cycle number, indicating that it decreases continuously with the number of cycles. This implies that the energy dissipation of the TMP bellows made out of paper is progressive with number of cycles, and it is presumably attributed to the microdamage in the high stressed paper domain, i.e. crease lines as evidenced in figure 18 which shows both optical micrographs during the initial crease line formation and those in the paper bent sequentially, and also scanning electron micrographs of the enlarged view of the initial crease line. Figure 18 reveals the extensive damage in the paper along the crease line, the main source of the energy dissipation discussed above.
Figure 17.
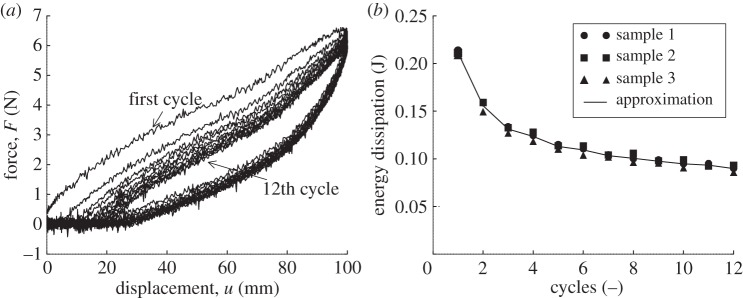
(a) Cyclic loading test showing the first to 12th cycle and (b) energy dissipation in each cycle.
Figure 18.
The crease line of a paper bent; (a) sequence of illustrations and optical micrographs of the initial crease line, and those in the paper under subsequent bending, (b) enlarged view of the crease line by scanning electron micrograph.
6. Conclusion
In this paper, we assembled TMP bellows made of paper and applied compression loading on the TMP bellows to examine their mechanical behaviour in terms of applied compression force (F) and vertical displacement (u). We developed a new model to simulate the F–u behaviour. Although the theoretical prediction agrees with the experimental data reasonably well, there is a discrepancy between the theory and the experiment. This discrepancy is studied within the framework of the extended Hamilton's principle, and it is attributed to several energy dissipations taking place at vertices, and also to frictional force owing to the change of the cross-sectional area. We also performed compression tests of the TMP bellows without vertices to conclude that a fraction of the energy dissipation is caused by the stress concentrations at the vertices.
Acknowledgements
We are grateful to CIMS researchers (Dr Y. Robert Liang, Dr Onur C. Namli and Mr Yihyan Lin) for their valuable discussions.
Appendix A. Effect of the overlap area on the folding angles.
As the TMP bellows consists of two sheets of paper that are attached at the side of the TMP as shown in figure 8, the calculation of the folding angle of the main crease lines (black dashed lines in figure 8) and the sub-crease lines (black thick lines in figure 8) should be considered differently from that of the other crease lines. Figure 19a shows the unit paper cell at its completely folded state, and its height is t+2ρ based on the thickness of the paper model as we discussed in §4.2. When the TMP is folded completely, its height does not become zero (figure 19c).
Figure 19.

(a) Completely folded state of unit paper cell and (b) the TMP, (c) view from the arrow shown in (b), focusing on the cross section of the main crease lines (grey thick lines) and the sub-crease lines (black thick lines). The dark shaded area indicates front sheet and white colour is back sheet shown in (b).
Figure 19c shows the side view from the thick arrow in figure 19b, showing the cross section of the main crease lines (grey thick lines) and the sub-crease lines (black thick lines) when the TMP is folded completely. The height of the TMP at this state is expressed as
| A 1 |
Using equation (4.7), in which thickness of the paper is not considered, the main folding angle θM that is shown as grey thick lines in figure 8 is calculated by using the following:
 |
A 2 |
Note that this angle should be 90° based on the thickness of the paper model.
We defined ξ as the difference between thickness t=0 case and the case in which the thickness of the paper is considered. Let us introduce a parameter no to express the folding angle as follows:
| A 3 |
Using t=0.27 mm and ρ=0.38 mm, we obtain ξ=0.983° from equation (4.16), and  and no=5.24 from equation (A.3). The value of no is substituted into equation (4.16), which in turn is used to calculate the right-hand side of (4.17).
Appendix B. Energy dissipation owing to the friction at the top and bottom surfaces
From figure 16a, focusing on the vertex a1 and a8, we calculate the centre position of each crease line and then we obtain the displacement of the centre position, δ8, which represents the displacement of the crease line. Letting Li(i=1−8) be the distance between two vertices (for example, L1 is the distance between a1 and a2) and Ltotal be the sum of Li(i=1−8), we assume that the normal force Ni(i=1−8) acting on each crease line is expressed by
 |
B 1 |
where F is a compression force which is obtained from the force–displacement curve. Thus, the friction force at the top and bottom surface is calculated as follows:
| B 2 |
where μ is a frictional coefficient. Therefore, the total energy owing to the friction is
 |
B 3 |
where δi is the displacement of each crease line. Using this equation with μ=0.2, we obtain that the energy owing to this frictional force is 0.0068 J.
Funding statement
This work was supported by a grant from AFOSR to University of Washington, FA 9550-09-1-0584 where the program manager is Dr Les Lee.
References
- 1.Guest SD, Pellegrino S. 1994. The folding of triangulated cylinders, part I: geometric considerations. J. Appl. Mech. 61, 773–777 (doi:10.1115/1.2901553) [Google Scholar]
- 2.Guest SD, Pellegrino S. 1996. The folding of triangulated cylinders, part III: experiments. J. Appl. Mech. 63, 77–83 (doi:10.1115/1.2787212) [Google Scholar]
- 3.Hunt GW, Ario I. 2005. Twist buckling and the foldable cylinder: an exercise in origami. Int. J. Non-Linear Mech. 40, 833–843 (doi:10.1016/j.ijnonlinmec.2004.08.011) [Google Scholar]
- 4.Yoshimura Y. 1955. On the mechanism of buckling of a circular cylindrical shell under axial compression, NACA TM 1390. [Google Scholar]
- 5.Ario I, Nakazawa M. 2010. Non-linear dynamic behavior of multi-folding microstructure systems based on origami skill. Int. J. Non-Linear Mech. 45, 337–347 (doi:10.1016/j.ijnonlinmec.2009.11.010) [Google Scholar]
- 6.Ma J, You Z. 2011. The origami crash box. In Origami 5; Fifth Int. Meeting of Origami Science, Mathematics, and Education (ed. Yim M.), pp. 277–289 In Boca Raton, FL: CRC Press. [Google Scholar]
- 7.Song J, Chen Y, Lu G. 2012. Axial crushing of thin-walled structures with origami patterns. Thin-Walled Struct. 54, 65–71 (doi:10.1016/j.tws.2012.02.007) [Google Scholar]
- 8.Miura K. 1980. Method of packaging and deployment of large membranes in space. In Proc. 31st Congr. Int. Astronaut. Federation, IAF-80-A 31 Tokyo, pp. 1–10 Paris, France: International Astronautical Federation. [Google Scholar]
- 9.Tanizawa K, Miura K. 1978. Large displacement configuration of biaxially compressed infinite plate. Trans. Jpn Soc. Aeronaut. Space Sci. 20, 177–187 [Google Scholar]
- 10.Kobayashi H, Kresling B, Vincent J. 1998. The geometry of unfolding tree leaves. Proc. R. Soc. Lond. B 265, 147–154 (doi:10.1098/rspb.1998.0276) [Google Scholar]
- 11.De Focatiis DSA, Guest SD. 2002. Deployable membranes designed from folding tree leaves. Phil. Trans. R. Soc. A 360, 227–238 (doi:10.1098/rsta.2001.0928) [DOI] [PubMed] [Google Scholar]
- 12.Tachi T. 2009. Generalization of rigid-foldable quadrilateral-mesh origami. J. Int. Assoc. Shell Spatial Struct. 50, 173–179 [Google Scholar]
- 13.Wu W, You Z. 2011. A solution for folding rigid tall shopping bags. Proc. R. Soc. A 467, 2561–2574 (doi:10.1098/rspa.2011.0120) [Google Scholar]
- 14.Tachi T. 2009. One-dof cylindrical deployable structures with rigid quadrilateral panels. In Symp. of the Int. Association for Shell and Spatial Structures (50th. 2009. Valencia). Evolution and Trends in Design, Analysis and Construction of Shell and Spatial Structures: Proceedings (eds Domingo A, Lázaro C.), pp. 2295–2305 Valencia, Spain: Editorial de la UniversitatPolitécnica de Valencia. [Google Scholar]
- 15.Miura K, Tachi T. 2010. Synthesis of rigid-foldable cylindrical polyhedra. In Symmetry: Art and Science, 2010/1–4, Special Issues for the Festival-Congress, ISIS-Symmetry (International Society for the Interdisciplinary Study of Symmetry) Gmuend, Austria, pp. 204–213 [Google Scholar]
- 16.Natori MC, Watanabe H, Kishimoto N, Higuchi K. 2007. Folding patterns of deployable membrane space structures considering their thickness effects. In Proc. ICAST-2007, 18th Int. Conf. on Adaptive Structures and Technologies, 3–5 October 2007, Ottawa, Canada, pp. 1–9 Red Hook, NY: Curran Associates Inc. [Google Scholar]
- 17.Taya M, Mura T. 1974. Dynamic plastic behavior of structures under impact loading investigated by the extended Hamilton's principle. Int. J. Solids Struct. 10, 197–209 (doi:10.1016/0020-7683(74)90018-3) [Google Scholar]


