

Significance
Histopathology is the standard method for diagnosis of cancer. However, this method requires time-consuming procedures for sectioning and staining of tissues, making histopathology impractical for use during surgery for most cancer types. We report a unique method based on two optical spectroscopy techniques—autofluorescence imaging and Raman scattering—that can accurately measure molecular differences between tumor cells and healthy tissue and allows diagnosis of tumors faster than histopathology, without requiring tissue sectioning or staining. Our study demonstrates the potential of this technique for diagnosis of tissues during cancer surgery, providing a quick and objective way to determine whether the tissue layers removed by the surgeon are clear of tumor.
Abstract
Tissue-conserving surgery is used increasingly in cancer treatment. However, one of the main challenges in this type of surgery is the detection of tumor margins. Histopathology based on tissue sectioning and staining has been the gold standard for cancer diagnosis for more than a century. However, its use during tissue-conserving surgery is limited by time-consuming tissue preparation steps (1–2 h) and the diagnostic variability inherent in subjective image interpretation. Here, we demonstrate an integrated optical technique based on tissue autofluorescence imaging (high sensitivity and high speed but low specificity) and Raman scattering (high sensitivity and high specificity but low speed) that can overcome these limitations. Automated segmentation of autofluorescence images was used to select and prioritize the sampling points for Raman spectroscopy, which then was used to establish the diagnosis based on a spectral classification model (100% sensitivity, 92% specificity per spectrum). This automated sampling strategy allowed objective diagnosis of basal cell carcinoma in skin tissue samples excised during Mohs micrographic surgery faster than frozen section histopathology, and one or two orders of magnitude faster than previous techniques based on infrared or Raman microscopy. We also show that this technique can diagnose the presence or absence of tumors in unsectioned tissue layers, thus eliminating the need for tissue sectioning. This study demonstrates the potential of this technique to provide a rapid and objective intraoperative method to spare healthy tissue and reduce unnecessary surgery by determining whether tumor cells have been removed.
Biophotonics techniques based on molecular spectroscopy can measure small chemical alterations in tissues, allowing label-free diagnosis of cancer (1–3). The availability of diagnosis and tumor imaging during surgery is extremely valuable to surgeons as it would enable them to excise and evaluate sequential layers of tissue to ensure the complete removal of tumor cells while sparing as much healthy tissue as possible. This surgical technique, called tissue-conserving surgery, has been used increasingly in the treatment of cancers such as skin (4) and breast (5). However, ensuring the complete excision of the tumor remains one of the key challenges in tissue-conserving surgery. Failure to remove all tumor cells increases the risk of tumor recurrence and the need for secondary surgery (6, 7).
Histopathology, the gold standard method for cancer diagnosis, is based on tissue sectioning and staining, followed by examination under an optical microscope to identify the tumor cells based on their distribution and morphology. Histopathology also may be used to diagnose the successive tissue layers excised during tissue-conserving surgery, such as in Mohs micrographic surgery (MMS) for the treatment of high-risk basal cell carcinoma (BCC) (8). If the histopathologic diagnosis indicates tumor persistence, the location of the remaining tumor is recorded and further tissue layers are removed by the surgeon until the margins are clear. Although MMS provides the highest cure rates (6), the lengthy (1–2 h per layer) and costly tissue preparation procedures required for intraoperative evaluation of the excised tissues by frozen-section histopathology have limited the wider use of MMS. Apart from being time consuming, the current histopathologic methods can provide only a subjective evaluation, leading to variability in diagnosis (9, 10). These drawbacks have limited the use of traditional histopathology mostly to tissue-conserving surgery of nonmelanoma skin cancers, and this technique remains impractical for most other cancer types.
Changes in the molecular spectra of tissues, measured by infrared absorption and Raman microscopy, may be used to build multivariate classification models, which allow objective diagnosis of independent tissue samples obtained from new patients. Recently, quantitative diagnosis based solely on the spectral information of tissue with simultaneous sensitivity and specificity higher than 90% was demonstrated for many cancer types, including skin (11–15), esophagus (16), prostate (17–21), breast (22), and lung (23, 24) (here, sensitivity represents the percentage of correctly detected tumor samples relative to the total number of tumor samples, and specificity is the percentage of correctly identified nontumor samples relative to the total number of nontumor samples). Nevertheless, achieving objective diagnosis while maintaining a high spatial resolution (20–50 μm) required tissue sectioning and long data acquisition times: typically 30–40 min/mm2 for infrared microscopy and 5–20 h/mm2 for Raman microscopy (13, 15, 20, 23, 25). Because the tissue layers excised during MMS typically are 100 mm2 in size, diagnosis would require several days, making conventional infrared and Raman microscopy impractical for use during cancer surgery. Although coherent Raman spectroscopy has demonstrated faster tissue imaging at high spatial resolution (26, 27), the ability of these techniques to build classification models that can be used for objective diagnosis of the presence or absence of tumors in independent tissue samples has not been established.
Here, we demonstrate an optical technique integrating tissue autofluorescence and Raman scattering in a manner that can be automated and used during tissue-conserving surgery for label-free objective diagnosis of large tissue samples. We show that this technique has great potential for intraoperative use, because it can provide objective diagnosis of BCC for whole tissue sections and unsectioned tissue layers faster than conventional histopathology and without the need for sample preparation.
Results
Classification Model for Quantitative Diagnosis of BCC Based on Raman Spectra.
The first step in the development of the spectral classification model for BCC was to establish a method to assign the measured Raman spectra to the correct tissue structures in the skin samples. Fig. 1A shows a typical example of skin tissue containing nodular BCC, hair follicles, and dermis. By comparing the pseudocolor image obtained by k-means clustering of the Raman spectra with the histopathologic image obtained by H&E staining, the centroid spectra for each cluster were assigned a label corresponding to BCC or healthy skin structures, such as epidermis (including hair follicles), inflamed dermis, dermis, fat, sebaceous gland, and muscle. Fig. 1B presents the mean of the Raman spectra corresponding to BCC and other tissue structures included in the classification model. In agreement with previous reports (13, 15), the Raman spectra of BCC possess more intense bands corresponding to DNA (788 cm−1, 1,098 cm−1) compared with other tissue structures whereas the spectra of dermis regions were dominated by bands specific to collagen fibers (851 and 950 cm−1) (28).
Fig. 1.

Classification model for BCC diagnosis based on Raman spectra. (A) Typical example of using the two-step k-means clustering algorithm for assigning the Raman spectra to the tissue structures and BCC. (Scale bar: 300 μm.) Typical centroid Raman spectra are shown for the clusters indicated by arrows: BCC (blue arrow), hair follicle (black arrow), and dermis (green arrow). (B) Mean Raman spectra of the healthy skin structures and BCC. Derm., dermis; Epid., epidermis; Hfol., hair follicle; Inf. D., inflamed dermis; Mus., muscle; Seb. G., sebaceous glands. (C) Receiver operating characteristic for the classification model (BCC vs. all other classes combined).
Several spectral classification models were tested based on various data reduction and statistical classification methods and were optimized for BCC diagnosis. The model was trained on tissue samples obtained from 55 patients with BCC on the face or neck, including nodular, infiltrative, and superficial BCCs (492 centroid spectra in total). The best performance for BCC (highest specificity when sensitivity was set at 95%) was obtained when 10 principal components of the raw spectra were reduced further to K − 1 (with K = 6 being the total number of tissue classes) canonical features using rank-reduced multiclass linear discriminant analysis. These five spectral features then were used with the multinomial logistic regression classifier. At a target sensitivity of 95%, the cross-validation results indicated 95.3% sensitivity and 94.6% specificity for BCC classification. The classification model then was tested on an independent set of skin samples from 22 patients with BCC on the face and neck (total of 199 centroid spectra) and showed 100% sensitivity and 92.9% specificity, which is in good agreement with the cross-validation results (confusion matrix in Table S1). The receiver operating characteristic is presented in Fig. 1C.
Imaging and Diagnosis of BCC by Raster-Scanning Raman Microspectroscopy.
Although raster scanning requires long acquisition times that are impractical for intraoperative diagnosis (5–20 h/mm2), we first established the full capabilities of Raman microscopy to image and diagnose BCC for independent tissue samples under this idealized setting. Fig. 2 A and B presents the diagnosis for skin sections containing nodular and infiltrative BCC on the neck and head when the sensitivity of the classification models was set at 95%. The “substrate” area was identified using the bright-field or fluorescence images of the tissue samples (not included in the classification model). The BCC regions were diagnosed correctly by the classification model, including tumor regions as small as 40 × 40 µm2, confirming the high sensitivity of the classification model. Because the corresponding specificity was 94%, for each sample (60 clusters per sample) we expected, on average, 3.6 clusters corresponding to healthy skin structures to be misclassified as BCC (false positives). Such misclassifications may be observed particularly in Fig. 2 A and B, in which approximately three to four regions corresponding to hair follicles and inflamed dermis were labeled as BCC (red arrows). In certain tissue samples, 100% specificity for BCC was observed, as shown in Fig. 2C. This sample represents an example of a skin section for which traditional H&E histopathologic diagnosis of the skin structures (morphologically similar to BCC; black arrows) may be difficult. After evaluation of sequential layers, the tissue sample was diagnosed by histopathology as negative (BCC-free) and the structures were identified as hair follicles. Fig. 2C shows that the Raman spectral classification model provided the correct diagnosis for all hair follicles, based only on the molecular information in the examined tissue section, and without requiring the evaluation of adjacent sections. Because the classification model was optimized to discriminate between BCC and healthy tissue rather than among healthy tissue structures, misclassification among healthy tissue structures, particularly dermis, inflamed dermis, epidermis, and muscle, also was observed. For tissue blocks, diagnosis was obtained directly by analyzing the surface of tissue blocks removed during MMS without cutting thin sections (Fig. 2 D and E). The classification model was set at 100% target sensitivity to account for the small decrease in sensitivity observed for smaller infiltrative BCC tumor regions (50–100 μm) attributed to an increase in sampling depth compared with tissue sections used for training the model. The diagnosis obtained by the Raman spectral model was in full agreement with the histopathologic diagnosis for all samples, including nodular, superficial, and infiltrative BCCs, as well as for BCC-negative samples (see Fig. S1 for more examples).
Fig. 2.
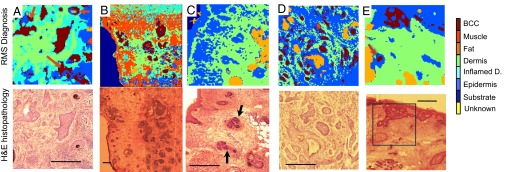
Diagnosis of BCC by Raman microspectroscopy using raster scanning. Tissue sections: (A and B) nodular BCC; (C) BCC-negative skin sample containing hair follicles with morphology similar to that of BCC (black arrows). Unsectioned tissue layers: (D) infiltrative BCC; (E) superficial BCC. The histopathology images for adjacent sections are included for comparison. (Scale bars: 400 μm.) False positives are indicated by red arrows.
Multimodal Spectral Histopathology.
To reduce the data acquisition time associated with raster scanning, tissue autofluorescence imaging then is used to determine the main spatial features of the tissue sample, and this information is used to select and prioritize the sampling points for Raman spectroscopy (Fig. 3). First, wide-field autofluorescence images were recorded highlighting the presence of tryptophan (excitation, 292 nm; emission, 357 nm) and collagen (excitation, 377 nm; emission, 447 nm) in the sample; then, the ratio of these images was computed to improve the contrast between tissue structures. Fig. 3 A and C shows that autofluorescence imaging has high sensitivity for detecting BCC (blue arrows), as tumors may be well delineated in both collagen (dark regions) and tryptophan (gray regions) images. However, the specificity of tissue autofluorescence is low, as other tissue structures (green arrows), such as epidermis, hair follicles, fat, and sebaceous glands, elicit an autofluorescence intensity similar to that of BCC. An unsupervised image segmentation algorithm was used to divide the ratio image into segments and to determine the contour of the skin sample. Because dermis elicits a stronger autofluorescence emission than the other tissue structures when excited with 377-nm light, an automated method was established to detect dermis directly from the collagen autofluorescence images. For all other segments, an algorithm was used to generate several sampling locations for the Raman spectral measurements. Fig. 3A shows that after segmentation and detection of dermis based on the autofluorescence intensity, for the 4 × 4-mm2 tissue region, only 70 segments were retained for Raman spectral measurements. Fig. 3B shows that the diagnostic images obtained by raster-scanning Raman spectroscopy and multimodal spectral histopathology (MSH) were in agreement with the H&E histopathology of the adjacent section. However, in this case, MSH provided a dramatic decrease in acquisition time, as it required 115-fold fewer Raman spectra compared with raster scanning while providing similar spatial and diagnosis accuracy for BCC. Another comparison between raster-scanning Raman microscopy and MSH is shown in Fig. S2.
Fig. 3.
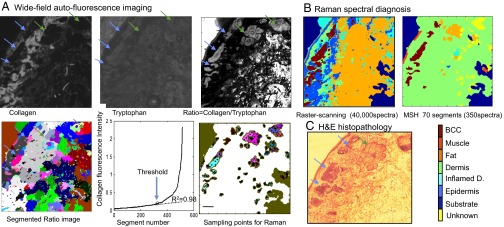
Comparison between BCC diagnosis obtained by MSH and by raster-scanning Raman spectroscopy. (A) Use of tissue autofluorescence images to determine sampling points for Raman spectroscopy measurements in MSH. Segments above the threshold in the collagen autofluorescence image are classified as dermis and excluded from the Raman spectra measurements. (B) Diagnosis obtained by 200 × 200 raster-scanning Raman spectroscopy (40,000 spectra) compared with the MSH diagnosis using 350 spectra, as indicated in the segmented image. (C) Histopathology image of the adjacent tissue section. (Scale bars: 0.5 mm.)
A set of eight tissue samples then was used to explore several algorithms for generating the sampling points and to establish the diagnosis for each segment based on the Raman spectra: a fixed number of sampling points, fixed density of sampling points, random or space-filling distribution of points, and segment diagnosis based on the average spectrum or majority voting. An acceptable tradeoff between diagnostic accuracy and acquisition time was found to occur when five spectra were measured for each segment based on a space-filling algorithm, after trimming 20 μm at the edges of each segment. A segment was diagnosed as BCC when at least two spectra in the segment were classified individually as BCC. If only one spectrum in a segment was classified as BCC, the class of the entire segment would be decided by a majority vote of 15 training instances nearest (in the original spectral space) the given spectrum. This additional nearest-neighbors algorithm was included to account for the fact that in MSH, the classification model was applied on individual Raman spectra, which have a significantly lower signal-to-noise ratio than the centroid spectra used in the model and in raster-scanning Raman microscopy.
The MSH then was applied in diagnosing a set of unseen tissue samples obtained from 20 new patients treated by MMS for BCC on the face or neck (10 BCC-positive and 10 BCC-negative samples). Fig. 4 presents typical examples of MSH diagnosis for nodular, micronodular, and infiltrative BCCs, as well as BCC-clear samples. Although the number of spectra depended on the size and complexity of the samples, the results show that for a typical ∼1-cm2 sample, accurate diagnosis by MSH typically can be obtained with 500–1,500 Raman spectra. For the BCC-positive samples (Fig. 4 A–D), the higher per-spectrum sensitivity regime (95% sensitivity, 94% specificity) allowed successful detection of BCC in all tissue samples. For the BCC-negative samples (Fig. 4 E–H), the classification model produced, on average, three false positive segments per sample, typically accounting for 0.05–0.25% of the entire tissue area. These results are in agreement with the expected average rate of false positives arising from the suboptimal specificity and from the diagnosis algorithm for the segments: 94% specificity means that we expect slightly more than six false positive segments for a typical sample of 200 segments (assumptions considered: given that the sample is clear of BCC, the model classifies all spectra independently; the 15-nearest-neighbors adjustment in the segment classification is ignored). When the per-spectrum specificity was increased to 98.8% (corresponding to 60% sensitivity), the expected number of false positive segments per sample drops below 1. The experimental results are close to this theoretical value, typically showing one to two false positive segments (Fig. S3). Further examples of MSH diagnosis are shown in Fig. S4. Importantly, the reduction in per-spectrum sensitivity led to only minor errors in BCC diagnosis, and overall, 9 of the 10 BCC-positive samples still were diagnosed correctly. The diagnosis for the false negative sample, containing only 200-μm BCC regions, is included in Fig. S5. Indeed, in a clinical application, the classification models may be optimized further according to the size of the sample and type of the BCC.
Fig. 4.
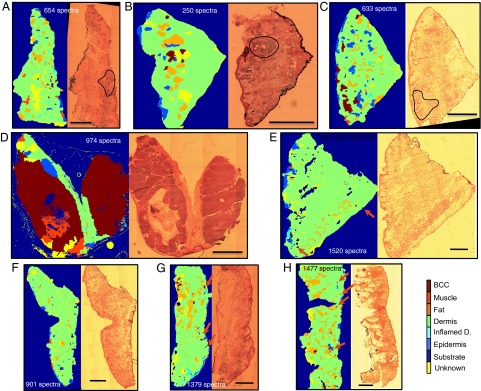
MSH diagnosis for tissue sections from patients with BCC on the face or neck. (A–D) BCC-positive samples. (E–H) BCC-negative samples (red arrows indicate the false positive segments). The diagnostic images were obtained by setting the classification models at target 95% sensitivity and 94% specificity per spectrum. The number of spectra measured for every sample is included in brackets and is the same for both diagnosis regimes. Histopathology images for adjacent sections are included for comparison (BCCs are highlighted by black curves where appropriate). (Scale bars: 2 mm.)
Next, we tested the feasibility of MSH in providing quantitative diagnosis for unsectioned tissue blocks excised during MMS. However, for tissue blocks, the autofluorescence images obtained with the wide-field autofluorescence imaging system integrated into the Raman microscope were blurred because of the out-of-focus light. Therefore, the autofluorescence images of tissue blocks were measured on a separate confocal fluorescence microscope equipped with a 457.9-nm laser; subsequently, the samples were moved on the Raman microscope for the spectral measurements (the accuracy of sample relocation from the confocal microscope to the Raman instrument was ∼100 μm). The confocal microscopic images had superior contrast among dermis, BCC, and other skin structures compared with wide-field autofluorescence imaging and consequently allowed efficient segmentation. Fig. 5, Upper shows that MSH provided the correct diagnosis for BCC while requiring only 608 Raman spectra. For other samples (Fig. 5, Lower), the diagnosis of BCC was correct only for tumors larger than ∼500 μm. Although the confocal images allowed very efficient segmentation of BCC regions as small as 100 μm, the misalignment between the confocal fluorescence microscope and the Raman microscope led to sampling errors that caused misclassification, particularly for the spectra near the edges of the segments. However, such errors can be eliminated easily by integrating confocal autofluorescence imaging into the Raman microscope.
Fig. 5.
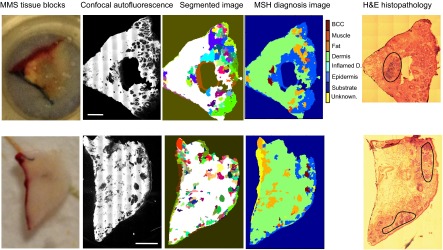
MSH diagnosis of BCC in unsectioned tissue blocks as received from surgery. H&E histopathology images for adjacent sections are included for comparison. (Scale bars: 2 mm.)
Discussion
Figs. 4 and 5 demonstrate that MSH can provide accurate and objective diagnosis of BCC in both tissue sections and unsectioned tissue blocks with 500–1,500 Raman spectra for typical tissue samples of 1 × 1 cm2. For our laboratory-based instrument, the acquisition time for the autofluorescence images was 4 min (8 min for confocal fluorescence) and the integration time for each Raman spectrum was 2 s. Using these estimates, the diagnosis time for MSH was 20–60 min, which is shorter than the diagnosis time for frozen-section histopathology, currently used during MMS (45–120 min for tissue preparation and 10–15 min for diagnosis). However, because MSH diagnosis no longer is limited by time-consuming tissue sectioning and staining, the development of a prototype instrument using an optimized high-speed Raman microscope [e.g., a line-shaped laser or multifocal Raman microscope has been reported to measure 10–48 Raman spectra simultaneously (29)] and integrated confocal or structured illumination autofluorescence imaging might allow intraoperative diagnosis of tissue layers and blocks within a few minutes.
The key advantage over other techniques is that the diagnosis is objective and may be obtained without any tissue preparation (sectioning and staining). Such developments could provide fast and objective feedback to the surgeon as to whether all tumor cells have been excised or whether further tissue removal is required. Although this study focused on BCC, MSH may be used to provide intraoperative diagnosis and ensure clear margins during tissue-conserving surgery for other cancer types for which histopathological diagnosis currently is not performed routinely.
Materials and Methods
Patients and Skin Tissue Samples.
All skin tissue samples were obtained during routine MMS at the Nottingham University Hospitals National Health Service (NHS) Trust. Ethical approval was granted by the Nottingham Research Ethics Committee (07/H0408/172). Informed consent was obtained from all patients. See SI Text for details regarding tissue preparation.
Spectral Classification Model.
All Raman spectra were recorded using a home-built Raman microspectrometer integrated with wide-field fluorescence imaging (details in SI Text). Raman spectral maps were recorded from skin tissue sections deposited on MgF2 disks by raster scanning over areas of 1 × 1 mm2 in 10-µm steps (total 10,000 spectra per sample). See SI Text for details on spectral preprocessing.
For each spectral map, a 3 × 3 moving average filter was applied and followed by a two-step k-means clustering, with k1 = 6, k2 = 10. The pseudocolor spectral images obtained by k-means clustering were correlated with the tissue structures revealed by the H&E images. The centroid spectrum of every cluster containing at least 10 measurement sites was included in the database and labeled as BCC, epidermis (including hair follicle), dermis, inflamed dermis, muscle, or fat (including sebaceous glands). A maximum of five centroid spectra per class per patient were included in the database. For this task, a total of 550,000 Raman spectra were recorded from 55 patients. After k-means clustering, 492 centroid Raman spectra were included in the training dataset of the classification model: 92 for BCC, 75 for epidermis (combined with hair follicles), 67 for inflamed dermis, 148 for dermis, 75 for fat (combined with sebaceous glands), and 35 for muscle. For validation, skin samples from 22 patients with BCC on face and neck were used, for which the Raman spectra were measured and preprocessed in the same way as the spectra included in the training dataset.
Several data reduction methods and classification techniques were compared (details in SI Text).
Spectral Imaging and Automatic Diagnosis of Tissue Sections and Blocks.
The Raman spectra from a selected region of the tissue were acquired at 10- or 20-µm steps. After preprocessing, all spectra were analyzed by the two-step k-means clustering algorithm to identify the tissue regions. The diagnosis of each region in the pseudocolor spectral image was obtained by applying the classification model to the centroid spectrum of each cluster (15, 30–32).
2.5 MSH.
For each tissue section, the ratio of the autofluorescence intensity images corresponding to tryptophan and collagen was segmented using an unsupervised segmentation algorithm (33) and Matlab code developed by Naidu (34). The edge pixels of the segments were trimmed off to avoid measurement at the boundaries. The sample positioning was automated using a programmable microscope stage. To avoid the out-of-focus problem in Raman spectral measurements for tissues larger than 3 × 3 mm, the tissues were divided into a 3 × 3 grid, and focusing was adjusted manually at each region. Segments smaller than 0.01 mm2, normally found within the dermis, were ignored and labeled as dermis. The remaining segments were ranked in order of increasing average fluorescence intensity. Progressive linear regressions of the intensity on the ranks were carried out to identify a transition from a linear to a nonlinear trend. The transition was determined as the point at which the coefficient of determination R2 fell below 0.98 (0.995 for tissue blocks). All segments with intensity higher than this threshold were classified as dermis and excluded from the Raman measurements. The following preprocessing was applied to the Raman spectra: removal of spectra contaminated by the dyes used in MMS (the segments with more than three contaminated spectra were labeled as unknown) and denoising based on an independent set of Raman spectra from 10 patients (50,000 spectra) using principal component analysis (PCA) with 50 loadings (35), followed by removal of cosmic-ray peaks, subtraction of the background and baseline, and normalization to zero mean and unit variance. Spectra for which the classification uncertainty as measured by the Shannon entropy was 20% higher than the maximum value (i.e., logK, where K = 6 is the number of classes) were labeled as “Unknown.”
Supplementary Material
Acknowledgments
We thank Nikon Ltd. for the loan of the confocal fluorescence microscope used for MSH diagnosis of tissue blocks. This paper presents independent research commissioned by the National Institute for Health Research under its Invention for Innovation Programme (Grant II-AR-0209-10012).
Footnotes
Conflict of interest statement: The authors have filed a patent application.
This article is a PNAS Direct Submission.
This article contains supporting information online at www.pnas.org/lookup/suppl/doi:10.1073/pnas.1311289110/-/DCSupplemental.
References
- 1.Mahadevan-Jansen A, Richards-Kortum RR. Raman spectroscopy for the detection of cancers and precancers. J Biomed Opt. 1996;1(1):31–70. doi: 10.1117/12.227815. [DOI] [PubMed] [Google Scholar]
- 2.Diem M, Boydston-White S, Chiriboga L. Infrared spectroscopy of cells and tissues: Shining light onto a novel subject. Appl Spectrosc. 1999;53(4):148A–161A. [Google Scholar]
- 3.Zonios G, et al. Spectral pathology. Ann N Y Acad Sci. 1998;838(1):108–115. doi: 10.1111/j.1749-6632.1998.tb08191.x. [DOI] [PubMed] [Google Scholar]
- 4.Baxter JM, Patel AN, Varma S. Facial basal cell carcinoma. BMJ. 2012;345:e5342. doi: 10.1136/bmj.e5342. [DOI] [PubMed] [Google Scholar]
- 5.Bennet N. One in five need reoperation after breast-conserving surgery. Lancet Oncol. 2012;13(8):e334. doi: 10.1016/s1470-2045(12)70339-x. [DOI] [PubMed] [Google Scholar]
- 6.Mosterd K, et al. Surgical excision versus Mohs’ micrographic surgery for primary and recurrent basal-cell carcinoma of the face: A prospective randomised controlled trial with 5-years’ follow-up. Lancet Oncol. 2008;9(12):1149–1156. doi: 10.1016/S1470-2045(08)70260-2. [DOI] [PubMed] [Google Scholar]
- 7.Cabioglu N, et al. Role for intraoperative margin assessment in patients undergoing breast-conserving surgery. Ann Surg Oncol. 2007;14(4):1458–1471. doi: 10.1245/s10434-006-9236-0. [DOI] [PubMed] [Google Scholar]
- 8.Mohs FE. Chemosurgery: A microscopically controlled method of cancer excision. Arch Surg. 1941;42(2):279–295. [Google Scholar]
- 9.Mogensen M, Jemec GBE. Diagnosis of nonmelanoma skin cancer/keratinocyte carcinoma: A review of diagnostic accuracy of nonmelanoma skin cancer diagnostic tests and technologies. Dermatol Surg. 2007;33(10):1158–1174. doi: 10.1111/j.1524-4725.2007.33251.x. [DOI] [PubMed] [Google Scholar]
- 10.Raab SS, Grzybicki DM. Quality in cancer diagnosis. CA Cancer J Clin. 2010;60(3):139–165. doi: 10.3322/caac.20068. [DOI] [PubMed] [Google Scholar]
- 11.Gniadecka M, Wulf HC, Mortensen NN. Diagnosis of basal cell carcinoma by Raman spectroscopy. J Invest Dermatol. 1997;28(2):125–129. [Google Scholar]
- 12.McIntosh LM, et al. Infrared spectra of basal cell carcinomas are distinct from non-tumor-bearing skin components. J Invest Dermatol. 1999;112(6):951–956. doi: 10.1046/j.1523-1747.1999.00612.x. [DOI] [PubMed] [Google Scholar]
- 13.Nijssen A, et al. Discriminating basal cell carcinoma from its surrounding tissue by Raman spectroscopy. J Invest Dermatol. 2002;119(1):64–69. doi: 10.1046/j.1523-1747.2002.01807.x. [DOI] [PubMed] [Google Scholar]
- 14.Lieber CA, Majumder SK, Ellis DL, Billheimer DD, Mahadevan-Jansen A. In vivo nonmelanoma skin cancer diagnosis using Raman microspectroscopy. Lasers Surg Med. 2008;40(7):461–467. doi: 10.1002/lsm.20653. [DOI] [PMC free article] [PubMed] [Google Scholar]
- 15.Larraona-Puy M, et al. Development of Raman microspectroscopy for automated detection and imaging of basal cell carcinoma. J Biomed Opt. 2009;14(5):054031. doi: 10.1117/1.3251053. [DOI] [PubMed] [Google Scholar]
- 16.Almond LM, et al. Raman spectroscopy: A potential tool for early objective diagnosis of neoplasia in the oesophagus. J Biophotonics. 2011;4(10):685–695. doi: 10.1002/jbio.201100041. [DOI] [PubMed] [Google Scholar]
- 17.Crow P, et al. The use of Raman spectroscopy to identify and grade prostatic adenocarcinoma in vitro. Br J Cancer. 2003;89(1):106–108. doi: 10.1038/sj.bjc.6601059. [DOI] [PMC free article] [PubMed] [Google Scholar]
- 18.Crow P, et al. The use of Raman spectroscopy to differentiate between different prostatic adenocarcinoma cell lines. Br J Cancer. 2005;92(12):2166–2170. doi: 10.1038/sj.bjc.6602638. [DOI] [PMC free article] [PubMed] [Google Scholar]
- 19.Tollefson M, et al. Raman spectral imaging of prostate cancer: Can Raman molecular imaging be used to augment standard histopathology? BJU Int. 2010;106(4):484–488. doi: 10.1111/j.1464-410X.2010.09185.x. [DOI] [PubMed] [Google Scholar]
- 20.Fernandez DC, Bhargava R, Hewitt SM, Levin IW. Infrared spectroscopic imaging for histopathologic recognition. Nat Biotechnol. 2005;23(4):469–474. doi: 10.1038/nbt1080. [DOI] [PubMed] [Google Scholar]
- 21.German MJ, et al. Infrared spectroscopy with multivariate analysis potentially facilitates the segregation of different types of prostate cell. Biophys J. 2006;90(10):3783–3795. doi: 10.1529/biophysj.105.077255. [DOI] [PMC free article] [PubMed] [Google Scholar]
- 22.Haka AS, et al. Diagnosing breast cancer by using Raman spectroscopy. Proc Natl Acad Sci USA. 2005;102(35):12371–12376. doi: 10.1073/pnas.0501390102. [DOI] [PMC free article] [PubMed] [Google Scholar]
- 23.Bird B, et al. Infrared spectral histopathology (SHP): A novel diagnostic tool for the accurate classification of lung cancer. Lab Invest. 2012;92(9):1358–1373. doi: 10.1038/labinvest.2012.101. [DOI] [PubMed] [Google Scholar]
- 24.Huang Z, et al. Near-infrared Raman spectroscopy for optical diagnosis of lung cancer. Int J Cancer. 2003;107(6):1047–1052. doi: 10.1002/ijc.11500. [DOI] [PubMed] [Google Scholar]
- 25.Hutchings J, Kendall C, Shepherd N, Barr H, Stone N. Evaluation of linear discriminant analysis for automated Raman histological mapping of esophageal high-grade dysplasia. J Biomed Opt. 2010;15(6):066015. doi: 10.1117/1.3512244. [DOI] [PubMed] [Google Scholar]
- 26.Saar BG, et al. Video-rate molecular imaging in vivo with stimulated Raman scattering. Science. 2010;330(6009):1368–1370. doi: 10.1126/science.1197236. [DOI] [PMC free article] [PubMed] [Google Scholar]
- 27.Ozeki Y, et al. High-speed molecular spectral imaging of tissue with stimulated Raman scattering. Nat Photonics. 2012;6:845–851. [Google Scholar]
- 28.Tu AT. Raman Spectroscopy in Biology: Principles and Applications. New York: Wiley; 1982. [Google Scholar]
- 29.Okuno M, Hamaguchi HO. Multifocus confocal Raman microspectroscopy for fast multimode vibrational imaging of living cells. Opt Lett. 2010;35(24):4096–4098. doi: 10.1364/OL.35.004096. [DOI] [PubMed] [Google Scholar]
- 30. Pirzer M (2008) Method and Device for Correcting a Spectrum. Patent US7359815B2.
- 31.Ly E, Piot O, Durlach A, Bernard P, Manfait M. Differential diagnosis of cutaneous carcinomas by infrared spectral micro-imaging combined with pattern recognition. Analyst (Lond) 2009;134(6):1208–1214. doi: 10.1039/b820998g. [DOI] [PubMed] [Google Scholar]
- 32.Sebiskveradze D, et al. Automation of an algorithm based on fuzzy clustering for analyzing tumoral heterogeneity in human skin carcinoma tissue sections. Lab Invest. 2011;91(5):799–811. doi: 10.1038/labinvest.2011.13. [DOI] [PubMed] [Google Scholar]
- 33.O’Callaghan RJ, Bull DR. Combined morphological-spectral unsupervised image segmentation. IEEE Trans Image Process. 2005;14(1):49–62. doi: 10.1109/tip.2004.838695. [DOI] [PubMed] [Google Scholar]
- 34.Naidu V. 2010. Multi modal image segmentation. Available at www.mathworks.com/matlabcentral/fileexchange/28418-multi-modal-image-segmentation. Accessed August 23, 2013.
- 35.Marcsisin EJ, et al. Noise adjusted principal component reconstruction to optimize infrared microspectroscopy of individual live cells. Analyst (Lond) 2012;137(13):2958–2964. doi: 10.1039/c2an15868j. [DOI] [PubMed] [Google Scholar]
Associated Data
This section collects any data citations, data availability statements, or supplementary materials included in this article.