

Significance
Mitochondrial DNA (mtDNA) mutations are a common cause of human inherited diseases and manifest with exceptional clinical heterogeneity and tissue specificity, the molecular basis of which are largely unknown. We produced induced pluripotent stem cells (iPSCs) from patients carrying the most common mtDNA mutation, m.3243A>G. During reprogramming, the cells underwent an mtDNA bottleneck, mimicking that in epiblast specification. We differentiated iPSCs to heteroplasmic human cells and tissues with isogenic nuclear background and show that the disease manifestation depends on cellular context. We show that upon neuronal differentiation, complex I is actively degraded by an autophagy-mediated mechanism. Our data indicate that cellular context actively modifies mtDNA segregation and manifestations, and that complex I is actively down-regulated in neurons with m.3243A>G mutation.
Keywords: mitochondria, disease modeling
Abstract
Mitochondrial DNA (mtDNA) mutations manifest with vast clinical heterogeneity. The molecular basis of this variability is mostly unknown because the lack of model systems has hampered mechanistic studies. We generated induced pluripotent stem cells from patients carrying the most common human disease mutation in mtDNA, m.3243A>G, underlying mitochondrial encephalomyopathy, lactic acidosis, and stroke-like episodes (MELAS) syndrome. During reprogramming, heteroplasmic mtDNA showed bimodal segregation toward homoplasmy, with concomitant changes in mtDNA organization, mimicking mtDNA bottleneck during epiblast specification. Induced pluripotent stem cell–derived neurons and various tissues derived from teratomas manifested cell-type specific respiratory chain (RC) deficiency patterns. Similar to MELAS patient tissues, complex I defect predominated. Upon neuronal differentiation, complex I specifically was sequestered in perinuclear PTEN-induced putative kinase 1 (PINK1) and Parkin-positive autophagosomes, suggesting active degradation through mitophagy. Other RC enzymes showed normal mitochondrial network distribution. Our data show that cellular context actively modifies RC deficiency manifestation in MELAS and that autophagy is a significant component of neuronal MELAS pathogenesis.
Mitochondrial DNA (mtDNA) mutations cause a mitochondrial respiratory chain (RC) disease in 1:5,000 individuals in Western populations (1), and 1:200 of newborns carries a potentially pathogenic mtDNA mutation (2). After the original description of the first mtDNA mutations (3, 4), more than 200 disease-causing mtDNA point mutations have been reported to underlie mitochondrial disease (5). The manifestations of these diseases vary from infantile multisystem disorders to adult-onset myopathies, cardiomyopathies, sensory organ failure, and neurodegeneration; indeed, mitochondrial disease can occur in any organ system, with any age of onset (5). A typical feature of pathogenic mtDNA mutations is heteroplasmy: patient cells carry both normal and mutant mtDNA. Furthermore, the threshold amount of mutant mtDNA manifesting as RC deficiency and disease can vary between tissues and individuals, contributing to high clinical variability (5).
The heteroplasmic m.3243A>G transition in the transferRNA-Leucine(UUR) gene is the most common mtDNA mutation (6), varying from adult population frequency of 1:6,000 in Finland to prevalence of 1:424 in Australia (7, 8). This mutation most commonly results in maternally inherited diabetes and deafness (MIDD) (9), but in other families it may manifest as cardiomyopathy, or mitochondrial encephalomyopathy, lactic acidosis, and stroke-like episodes (MELAS) (6, 10–12). Despite common genetic background, the m.3243A>G mutation results in variable forms of mitochondrial RC deficiency in different patients. By far the most common finding in MELAS is complex I (CI) deficiency, whereas some patients have combined deficiencies of the RC CI, CIII, and CIV (13, 14). Evidence from autopsy tissues suggest that RC complexes are differentially affected even in different tissues of one individual with m.3243A>G mutation with the CI deficiency dominating (15). Induction of nuclear-encoded CII, succinate dehydrogenase (SDH), and mitochondrial accumulations in muscle and neurons are other typical findings in RC deficiencies (16, 17), thought to be compensatory to the RC defect. The basis of the tissue-specific variability in RC manifestations is unknown.
Defects in different mt-tRNAs have gene-specific clinical manifestations: tRNA-Leu(UUR) associated with MELAS or MIDD, tRNA-Lys with myoclonic epilepsy, tRNA-Ser with deafness, and tRNA-Ile with cardiomyopathies (5). Only sometimes the manifestations overlap, indicating that the pathological mechanisms have to extend beyond tRNA functions in mitochondrial translation. These mechanisms, however, are unknown. This is largely because of the unsuccessful attempts to introduce exogenous DNA to mitochondria, which has prevented generation of in vivo disease models. Heteroplasmic mice carrying two normal mtDNA variants (18) or randomly occurring mutations isolated from somatic tissues (19–22) have been generated by cytoplast fusion to zygotes. Further, random mtDNA mutagenesis has been induced by manipulating nuclear-encoded mtDNA maintenance genes (23–26). However, transgenic mice, carrying human disease-associated mt-tRNA mutations, do not exist. Experimental models for mt-tRNA mutations would be needed because of their common occurrence in patients, highly tissue-specific phenotypes, and unknown mechanisms beyond mitochondrial translation.
We report here reprogramming of heteroplasmic patient fibroblasts to induced pluripotent stem cells (iPSCs) and production of heteroplasmic differentiated cell- and tissue types to generate experimental models for mtDNA 3243A>G mutation underlying MELAS and MIDD and report excellent replication of findings in patient tissues with clues to pathogenic mechanisms.
Results
Generation of iPSCs with Heteroplasmic mtDNA 3243A>G MELAS Mutation.
We reprogrammed three patient and two control fibroblast lines to iPSCs using retroviral vectors expressing Oct4, Klf4, Sox2, and c-Myc (27). Patient line M1 was from a 39-y-old man with MIDD, line M2 from a 52-y-old man with MIDD and ataxia, and line M3 from a 55-y-old woman with cardiomyopathy. Control (Ctr) lines were from healthy voluntary individuals (Ctr1 from a 48-y-old woman; Ctr2 from a 22-y-old woman). The mutant mtDNA contents of the patients’ skeletal muscle were 73, 50, and 90%, and of their fibroblasts 22, 21, and 35%, respectively. All cells were cultured with uridine supplementation in pyruvate-containing growth medium to enable growth of RC-deficient cells (28). All fibroblast lines produced iPSC clones with normal embryonic stem (ES) cell-like morphology with variable efficiency, but with no evident correlation to disease status of the donor individual. The generated iPSC lines showed both high and low mutant mtDNA contents (Fig. 1A). Fingerprinting analysis verified the parental fibroblast origin of the iPSCs (Fig. S1A), and all MELAS lines showed expression of pluripotency markers (Fig. 1 B and C), silencing of the viral transgenes (Fig. 1D), and similar growth characteristics as the control cells. Karyotypes of the four analyzed patient iPSC lines were normal diploid (Fig. S1B). These results indicate that m.3243A>G mutation did not affect reprogramming efficiency or iPSC genomic stability.
Fig. 1.

Characterization of MELAS iPSCs. (A) m.3243A>G MELAS mutant mtDNA amount in parental fibroblast cultures (Fb), the reprogrammed iPSC lines (iPSC), and in fibroblast clones from the parental lines (Fb_cl). (B) RT-PCR analysis of ES cell-specific transcripts (OCT4, SOX2, NANOG, REX, and DNMT3B). All patient-derived iPSC clones expressed ES-specific genes similarly to the healthy control iPSCs and ES cells (HDF, human dermal fibroblasts; HES, human embryonic stem cells). (C) Immunofluorescence staining for ES cell-marker proteins TRA-1–60 (green), SSEA4 (green), and NANOG (red). Blue staining for nucleus is DAPI. Colony morphology and ES cell-marker protein expression were similar in all of the clones. (Scale bar, 50 μm.) (D) Expression of OCT4, SOX2, KLF4, and c-MYC compared with that in human ES cells and normalized against cyclophilin, expression. Expression of viral transgenes was down-regulated in all clones. (E) MELAS iPSC lines generated teratomas that differentiated toward all three germ layers independent of the mutation load. (Left) Mesoderm, cartilage; (Center) ectoderm, pigmented epithelia; and (Right) endoderm, intestinal epithelia. (Scale bar, 200 μm.) (F) iPSCs differentiated in vitro into neural cultures consisting of MAP2 and βIII-tubulin positive neurons (green) and GFAP-positive glia (red). DAPI staining for nuclei (blue). (Scale bar, 50 μm.) (G) m.3243A>G mutant mtDNA load in the iPSC lines during culture and in the differentiated cells. The heteroplasmy levels did not change significantly during culture or upon differentiation. MH, MELAS-high; ML, MELAS-low; p., passage number. See also Fig. S1.
Three lines with high mutation load (>80% of total mtDNA; “MELAS-high”), three nearly homoplasmic wild-type lines (“MELAS-low”), and two control lines, one per control individual, were chosen for further analysis. The biphasic segregation of the heteroplasmic mutant mtDNA provided us an ideal isogenic setting: identical nuclear background, but variable heteroplasmy levels of mutant mtDNA, with the potential differences between the lines being attributes of mtDNA genotype.
The MELAS-high iPSC lines produced well-differentiated teratomas in immune-compromised mice (MELAS-high n = 2; MELAS-low n = 2) with tissues from all three germ layers, similar to other lines with healthy mitochondria (Fig. 1E). All lines (MELAS-high n = 3; MELAS-low n = 3; control n = 2) differentiated also in vitro to microtubule-associated protein 2 (MAP2) and βIII-tubulin–positive neurons and glial fibrillary acidic protein (GFAP)-positive glia (Fig. 1F). Cytosolic-free calcium imaging showed that similar proportions of the differentiated neuronal cells responded either to glutamate and AMPA via glutamate receptors or to ATP via purinoreceptors, proving the functionality of neurons and astrocytes, respectively (Fig. S1 C and D). The heteroplasmy levels of the patient lines remained stable upon serial iPSC passaging (20 passages) and upon differentiation to teratomas and neurons (Fig. 1G). These results show that even a high load of mutant mtDNA with m.3243A>G did not affect differentiation.
MELAS-Mutant mtDNA Has Cell-Type–Specific Consequences to Mitochondrial Transcription.
tRNA-Leu(UUR) participates in translation of all of the 13 mtDNA-encoded transcripts that encode subunits of CI, CIII, CIV, and CV. We studied the consequences of m.3243A>G MELAS mutation to mitochondrial DNA, transcripts and RC proteins before and after reprogramming, and in iPSC-derived differentiated neuronal cells and teratomas. Fibroblasts showed no major changes in mitochondrial transcripts (Fig. 2A). In MELAS-high iPSCs, however, steady-state mitochondrial transcript amounts were severely decreased, whereas mtDNA copy number was significantly up-regulated. The mtDNA:mtRNA ratio was 7:20 for different transcripts, whereas in control and MELAS-low iPSC lines and in fibroblasts, transcript levels closely reflected their mtDNA content (mtDNA:mtRNA ratio 0.6:1.0) (Fig. 2B). In neurons, promoter-proximal heavy-strand transcripts (ND2, COX1) showed a decreasing trend (mtDNA:mtRNA ratio 2:3), but otherwise the transcript levels were preserved (mtDNA:mtRNA ratio 0.9:1.4) (Fig. 2C). Twofold increase in mtDNA amount and drastic decrease of mtRNAs in MELAS-high iPSCs indicates that mtDNA copy number and mitochondrial transcription are independently regulated in these cells.
Fig. 2.

Mitochondrial RC deficiency progresses upon differentiation in cells with high mutant mtDNA load. (A) mtDNA and mitochondrial transcript amounts in fibroblasts, (B) in iPSCs, and (C) in iPSC-derived neurons. Active down-regulation of mitochondrial transcripts is seen in the MELAS-high iPSCs. (D) Quantification of RNA19, a mitochondrial processing intermediate containing 16S rRNA, tRNA-Leu(UUR), and ND1, in MELAS iPSCs and neurons. RNA19 is up-regulated in MELAS-high neurons, but not in iPSCs, when comparing with isogenic cells with low mutant amount. (E) Quantification of Western blot analysis of the parental fibroblasts, (F) the iPSC lines, (G) and iPSC-derived neurons. In fibroblasts, all mitochondrially encoded RC complexes are affected, whereas the iPSC-derived neurons show an isolated CI deficiency. TOM20, a mitochondrial outer membrane transporter protein, not directly involved with mitochondrial respiration, was used as a mitochondrial mass marker. All expression levels are relative to control sample and results are presented as mean ± SEM. (See Fig. S2 for representative Western blots.) CYTB, cytochrome B; M, MELAS; ND2, NADH dehydrogenase subunit 2; ND5, NADH dehydrogenase subunit 5; ND6, NADH dehydrogenase subunit 6, CI–CIV.
The m.3243A>G mutation has been associated with accumulation of RNA19, a mitochondrial processing intermediate containing RNAs for 16S rRNA, tRNA-Leu(UUR), and ND1 (29). Thus, we measured the level of RNA19 in our MELAS iPSCs and neurons. In accordance with the low level of all mitochondrial transcripts analyzed, RNA19 level was low in MELAS-high iPSCs, ∼40% of that in the MELAS-low iPSCs (Fig. 2D). However, the percentage of unprocessed RNA19 from total 16S rRNA (mature 16S rRNA plus RNA19) was around 50% in all iPSCs independent of the mutation level. However, in the MELAS-high neurons, an almost twofold increase in the total 16S rRNA transcript level was detected when compared with MELAS-low neurons; this was due to the ∼fourfold increase in RNA19 (Fig. 2D). These data show that processing of mitochondrial transcripts is dependent on the cellular context.
RC Deficiency Is Cell Context-Specific, with Active CI Degradation upon Neuronal Differentiation.
The RC proteins in the parental fibroblast lines with intermediate heteroplasmy levels showed a typical pattern for mt-tRNA mutations: a combined deficiency of mtDNA-encoded CI, CIII, and CIV, with CIV deficiency predominating (Fig. 2E and Fig. S2). The MELAS-high iPSCs, however, with considerably higher mutant mtDNA load than in the fibroblasts, showed normal CI, CIII, and CIV amounts, but an increase in CII (Fig. 2F and Fig. S2). The cell-type specificity of the m.3243A>G effect was further emphasized in iPSC-derived neuronal cells, which manifested a remarkable CI deficiency (Fig. 2G and Fig. S2), typical for MELAS patient tissues. Because neuronal differentiation is partial and the Western analysis result represents a mixed pool of differentiated and undifferentiated cells, we analyzed the presence of the complexes upon neuronal differentiation by immunofluorescence analysis. Remarkably, only a few perinuclear CI-positive clusters were present in the differentiated neurons, whereas other RC enzymes showed normal distribution within the mitochondrial network (Fig. 3A and Fig. S3). The mitochondrial network was intact also in the cells with CI clusters (Fig. 3B). The CI deficiency exacerbated during differentiation, with no CI positivity seen in neuronal cells after 2 wk of differentiation, whereas CIII, CIV, and CV persisted even after 4 wk of culture on laminin. In MELAS-low neuronal cells, CI showed normal mitochondrial network distribution (Fig. 3A). These results show that the typical biochemical phenotype of m.3243A>G mutation, CI deficiency in the patient brains, can be recapitulated in iPSC-derived MELAS patient neuronal cells. Furthermore, the manifestation of RC deficiency of MELAS-high cells, with isogenic nuclear background and similar mtDNA heteroplasmy level, is dependent on cell-type context. The data also indicate that CI is sequestered to a subset of perinuclear mitochondria upon early neuronal differentiation, whereas other RC enzymes show normal mitochondrial network localization.
Fig. 3.

Down-regulation of RC CI in neurons with high mutant mtDNA load. (A) Immunofluorescence analysis of neuronal RC complexes. In the iPSC-derived MELAS-high neurons CI (CI, red; DAPI nuclear counterstaining, blue) resides in few positive perinuclear foci (arrows), whereas it is present in the full mitochondrial network in the soma and neurites in the MELAS-low and control neurons. All cells stained normally for other RC complexes. (Scale bar, 50 μm.) (B) Costaining with mitochondrial marker (TOM20) shows normal mitochondrial network in the cells showing CI clusters (arrows). (Scale bar, 50 μm.) CII-70kDa, complex II 70-kDa subunit; CIV-COX1, cytochrome c oxidase subunit 1; NDUFB4, NADH dehydrogenase 1 beta subcomplex 4. See also Fig. S3.
Perinuclear CI Clusters Are Cleared by Mitophagy.
The large CI-positive perinuclear foci in the MELAS-high neurons, followed by clearance of CI during further differentiation and maturation, prompted us to ask whether autophagy was involved in the cluster formation. LC3-B, a component of autophagosomal membrane, showed complete colocalization with the CI-positive foci in early-differentiated neuronal MELAS-high cells (Fig. 4A). Parkin, a ubiquitin-E3-ligase mediating autophagosome recruitment to damaged mitochondria (29), and PTEN-induced putative kinase 1 (PINK1), a mitochondrial Ser/Thr kinase that recruits Parkin to damaged mitochondria (30), were both present in these clusters (Fig. 4A). However, their overall cellular levels were not induced according to Western analysis of the mixed neuronal cell pools (Fig. S4A). In control cells with a low amount of mutant mtDNA, CI was localized everywhere within the mitochondrial network and Parkin only occasionally colocalized with the CI signal (Fig. S4B). These results strongly suggest that PINK1/Parkin-mediated mitophagy is involved in active clearance of CI in neuronal cells without a major effect on other complexes in early-differentiated neuronal MELAS-high cells. However, upon extended culture, when CI already was undetectable by immunofluorescence, large LC3-B–positive autophagosomes that contained other RC complexes existed in MELAS-high neuronal cells (Fig. 4B). Complexes II–V, however, retained their overall mitochondrial network localization even in late culture and did not show CI-like clusters. These results suggest that active degradation of CI may be a physiological response to mitochondrial dysfunction, specific for neuronal cells. Further, they indicate that increased or stalled autophagy is involved in MELAS neuronal pathogenesis.
Fig. 4.

Active down-regulation of complex I through mitophagy in neurons with high mutant mtDNA load. (A) Immunofluorescence staining showing colocalization of LC3B and Parkin with CI-positive foci and PINK1 with Parkin in these same aggregates in MELAS-high neurons. (Scale bar, 10 μm.) (B) Active mitophagy with large LC3B-positive autophagosomes containing RC complexes (CII 70-kDa subunit) are seen also later after CI staining becomes undetectable in the aged neurons with high mutation load. See also Fig. S4.
Teratomas Harbor Tissue Types Manifesting RC Deficiency.
Similar to neuronal cells in vitro, many of the identifiable differentiated tissues within teratomas, including βIII-tubulin–positive neuronal cells, showed significant, ubiquitous reduction of CI (Fig. 5 and Fig. S5). Although the overall staining for CIV was weaker in the MELAS-high teratomas, most well-defined tissues showed intense granular immunoreactivity for CIV, indicating local up-regulation of CIV in the absence of CI (Fig. 5 and Fig. S5). In histochemical activity assays of frozen sections, MELAS-high teratomas showed remarkable SDH-positive, COX (CIV)-negative regions in their epithelial/ependymal-type linings with mitochondrial accumulations (Fig. 6). These findings indicate that MELAS-iPSCs are an excellent source of heteroplasmic human tissues that manifest similar tissue type-specific forms of RC deficiency as patient cells and tissues with m.3243A>G.
Fig. 5.

Low mitochondrial RC CI amount in tissues with high MELAS mutant amount. Immunohistochemical detection of RC complexes (CI with NDUFS3 antibody; CIV with COX-I antibody; CII with CII 70-kDa antibody; and hematoxylin-eosin counterstaining) on serial paraffin sections from MELAS-high and MELAS-low teratomas. βIII-tubulin staining is shown as a neuronal marker. All MELAS-high tissues show very low immunoreactivity for CI (arrows indicate examples of low staining in MELAS-high compared with MELAS-low), but stain strongly for CIV, with a granular appearance in the skeletal muscle (Insets, arrows). Negative mouse IgG controls in inset of neuronal view. Enlarged view in inset of skeletal muscle figure. (Scale bar, 50 μm for intestinal and muscle sections and 25 μm in neural sections and in insets of muscle sections.) See also Fig. S5.
Fig. 6.
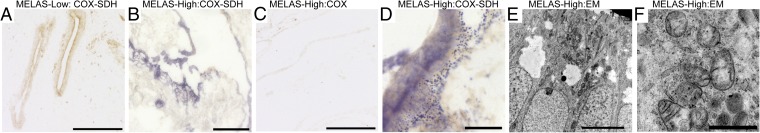
Mitochondrial RC deficiency in differentiated teratoma tissues. (A) Activity analysis of CII (nuclear-encoded SDH; blue) and CIV (partially mtDNA-encoded COX, cytochrome c oxidase; brown) by histochemical assay on frozen tissue sections. Simultaneous COX-SDH activity analysis of teratoma with low mutant mtDNA amount. MELAS-low teratoma shows normal COX activity, in which case typically SDH activity is not visible. (Scale bar, 200 μm.) (B) COX-SDH activity analysis in MELAS-high teratoma. Large regions of strong SDH activity indicate loss of COX activity, mitochondrial accumulation, and stimulation of CII, whereas (C) COX activity analyzed alone shows slightly decreased activity. (Scale bar, 200 μm.) (D) Large magnification of SDH-positive area showing granular accumulations of SDH-positive mitochondria in MELAS-high teratoma. (Scale bar, 25 μm.) (E) Electron microscopy of MELAS-high teratoma showing large amounts of mitochondria in apical surfaces of intestinal epithelia. (Scale bar, 5 μm.) (F) Larger magnification showing mitochondria with abnormal morphology and inclusions. (Scale bar, 1 μm.)
iPSCs Show Mitochondrial Genetic Bottleneck, with Rapid Segregation of mtDNA Toward Mutant or Wild-Type Homoplasmy.
The MELAS-mutant mtDNAs showed bimodal segregation in iPSCs toward wild-type or mutant homoplasmy, which indicated no clear selection for or against mutant m.3243A>G mtDNA upon reprogramming (Fig. 1A). The drastic genotype shift suggested presence of a mitochondrial genetic bottleneck upon iPSC reprogramming. The phenomenon could be a result of down-regulation of mtDNA copy number or replication of only a subset of mtDNAs during stem cell reprogramming. To test whether this shift had occurred already during fibroblast culture, we cloned two of the parental fibroblast lines and analyzed mutation loads in the clones. A high proportion of individual parental fibroblast clones showed intermediate heteroplasmy levels (Fig. 1A), indicating that bimodal segregation upon reprogramming did not reflect the clonal parental fibroblast heteroplasmy level (M1, P = 0.0011; M2, P = 0.0031). In control iPSCs, as seen also previously (31), mtDNA amount decreased more than twofold from parental fibroblasts (Fig. 7A), which together with bimodal heteroplasmy shift in MELAS-high iPSCs, supported the existence of early-reprogramming mtDNA bottleneck. However, mtDNA dynamics were modified in the early passage MELAS-high iPSCs: they showed more than a twofold increase of mtDNA amount compared with the parental fibroblasts and a twofold increase in number of visible nucleoids compared with MELAS-low or control iPSCs (Fig. 7 A and B and Fig. S6). Differences in mtDNA dynamics were seen also upon differentiation. In control and MELAS-low neuronal lines, mtDNA amount increased along differentiation, but in MELAS-high neurons the mtDNA amount stayed low (Fig. 7A). However, the heteroplasmy levels remained stable upon differentiation (Fig. 1G). These results show that the rapid shifts of heteroplasmy were specific for the reprogramming stage.
Fig. 7.
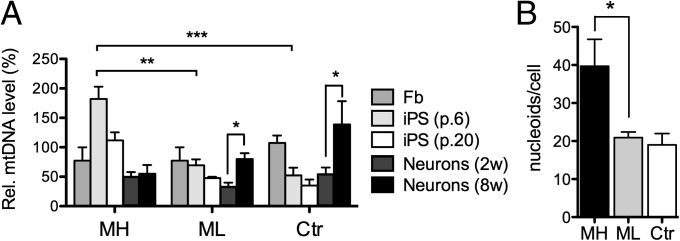
Concomitant changes in mtDNA copy-number and cellular organization, mimicking mtDNA bottleneck during reprogramming. (A) Dynamics of mtDNA copy number upon reprogramming and differentiation. 2w, 2 wk of differentiation on laminin; 8w, 8 wk of differentiation on laminin. Data are quantified from two independent experiments with three biological replicates in triplicate. Results are presented relative to control fibroblasts as mean ± SEM. (B) Quantification of mitochondrial nucleoids in MELAS iPSCs with high (MH) or low (ML) mutation load and in Ctr iPSCs, visualized by DNA antibody. The number of nucleoids is increased in MH cells, with the most prominent increase is seen in the largest nucleoids. Results are presented as mean ± SEM. See also Fig. S6.
iPSC Mitochondria Cluster Around a BB.
Intrigued by the reprogramming-associated mitochondrial genetic bottleneck, we investigated whether iPSCs showed other characteristics previously seen only in germ cells. During oocyte development, mitochondria organize around a Golgi structure called a Balbiani body (BB) (32). BB has been suggested to mediate the transfer of functional organelles to the germ plasm and co-occur with mtDNA bottleneck in flies (33) and was observed also in primordial germ cells of mice (34). We found that in all of our iPSCs, both in MELAS and wild-type lines, about 80% of cells showed symmetric organization of mitochondria around a BB-like tight Golgi structure (Fig. 8 A and B). In mitotic cells, however, BB disassembled into numerous vesicles, as reported previously for Golgi in cultured cells (35). The disassembly was accompanied by mitochondrial fragmentation and the organelles dispersed around the cytoplasm (Fig. 8 C and D). We did not identify BB-like mitochondria-Golgi coorganization in fibroblasts or neurons (Fig. 8 E and F). These results indicate that mitochondrial organization in reprogrammed iPSCs mimics closely that of germ cells.
Fig. 8.
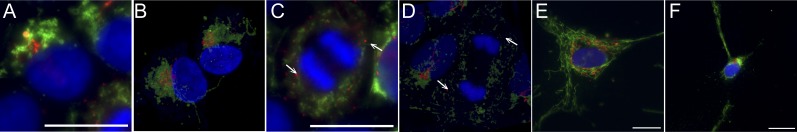
Balbiani-body (BB)-like organization of Golgi and mitochondria in iPSCs. (A) Immunofluorescence staining of Golgi (GM130, red) and mitochondria (TOM20, green) in control iPSCs. The nuclei are stained with DAPI (blue). Fragmented mitochondria cluster around Golgi forming a BB-like structure in most of the iPSCs (∼80%) in an unsynchronized culture. No difference is seen between MELAS and control lines. (Scale bar, 20 μm.) (B) Confocal imaging of Golgi and mitochondria in iPSCs. (C) An iPSC undergoing mitosis stained for Golgi and mitochondria. In mitotic iPSCs with condensed chromosomes, the Golgi is disassembled into small vesicles (arrow) and both Golgi and mitochondria are dispersed around the mitotic spindle. (Scale bar, 20 μm.) (D) Confocal imaging of a cell undergoing mitosis. Arrows: Golgi vesicles. (E) Immunofluorescence staining of Golgi and mitochondria in fibroblast and (F) in neuronal cell with mitochondria fused into networks and not clustering around Golgi in any cell-cycle phase. (Scale bar, 20 μm.)
Discussion
We report here that iPSCs generated from patients carrying the mitochondrial m.3243A>G mutation are an efficient source of heteroplasmic human cells and tissues, which faithfully replicate tissue-specific manifestations of RC deficiency in patients and reveal clues to tissue-specific pathomechanisms. We show that a high mutant load of m.3243A>G considerably modifies mtDNA and mtRNA metabolism, as well as RC complex manifestations, and that these effects depend on cell-type context. The iPSC-derived cells and tissues have an identical isogenic nuclear background and similar mtDNA heteroplasmy levels, implying that tissue-specific factors modify the outcome of m.3243A>G manifestations. Intriguingly, we show evidence that in neuronal cells, the mitochondrial RC CI is actively sequestered in PINK1-Parkin–positive autophagosomes and degraded, whereas other RC enzymes remain intact and spread throughout the mitochondrial network. These data suggest that CI deficiency in brain could be an active, potentially unspecific response to a mitochondrial insult, and provide an explanation of why CI defects are commonly reported upon mitochondrial-associated neurodegeneration. Our results also imply an important role for mitophagy in MELAS pathogenesis.
Our iPSC-derived cells and tissues manifested a variable RC deficiency phenotype, depending on a cell type. The parental fibroblasts showed a combined RC deficiency, which normalized upon iPSC generation, and upon differentiation to neuronal cells developed to a specific CI deficiency. Many identifiable tissues in the teratomas recapitulated the CI deficiency and showed a slight decrease in CIV enzymatic activity. The COX-deficient areas exhibited a remarkable up-regulation of SDH activity as well as mitochondrial accumulations, similar to patient tissues (16, 17). These morphological findings replicate the specific hallmarks of mitochondrial RC deficiencies in patient tissues and formally prove that m.3243A>G mutation is the direct cause of RC deficiency in tissues of MELAS patients. Furthermore, the changing pattern of RC defect in different cell types with the same mutant mtDNA, similar heteroplasmy level, and identical nuclear background indicates that RC complex activities depend on tissue-specific factors that determine the disease manifestation.
We show here that early upon neuronal differentiation from iPSC-derived neurospheres, CI accumulated in large perinuclear clusters in cells that still retained a TOM20-positive mitochondrial network. The amount of immunoreactive CI in subsequent culturing progressed to be undetectable by immunofluorescence, whereas CII–CV showed normal expression and localization throughout the mitochondrial network. The localization of the CI clusters within LC3B-positive autophagosomes and colocalization of Parkin and PINK1 in these clusters suggest active degradation of CI. The degradation appears to be mediated by enriching CI to a subset of mitochondria that are cleared by PINK1/Parkin-mediated mitophagy. In prolonged culture, when CI was already absent by immunofluorescence, we could observe increased amount of autophagosomes that contained other respiratory complexes. However, these complexes were still present in the overall mitochondrial network, indicating an overall increase in mitochondrial recycling or stalled autophagy. This evidence suggests that early-differentiating neurons are actively degrading CI as an active response to a mitochondrial insult and that autophagy is involved in MELAS pathogenesis.
CI deficiency has been described in a vast number of different neurodegenerative disorders, including mitochondrial disorders and Parkinson disease. We have previously shown in autopsy studies that in disorders that associate with mtDNA instability, the patient neurons show specific CI deficiency (30, 36) independent of whether the patient actually has symptoms from the CNS. In Parkinson disease, CI deficiency was observed more than 2 decades ago (e.g., in the neurons of substantia nigra), but the potential causative role of CI deficiency to this common form of neurodegeneration still has remained open (37, 38). Our current finding of degradation of CI by autophagy, as an active initial consequence of mitochondrial dysfunction, provides a potential explanation for these phenomena. CI is a generator of reactive oxygen species (ROS) upon decreased electron flow through RC; it is also a target of ROS because of its seven iron–sulfur clusters (39). If neurons actively down-regulate CI as a response to mitochondrial dysfunction, they would eliminate a potential ROS producer, but this would require up-regulation of the second electron entry site to RC, namely CII. Indeed, our iPSC-derived tissues with RC deficiency show increased CII in specific cell types. These findings suggest active recycling of CI as an acute protective response to mitochondrial dysfunction, which, upon mitochondrial disease, could develop into a chronic response. However, the detailed mechanisms remain to be clarified.
We found that a rapid bimodal shift toward wild-type or mutant homoplasmy occurred upon reprogramming in MELAS iPSCs, replicating findings of recent reports (40, 41). Rapid shifts in mitochondrial heteroplasmy have been observed to occur in germ line (i.e., stem cells) in cows (42, 43), in human patients (44, 45), in mice with heteroplasmic neutral or potentially pathogenic mtDNA variants (18, 25, 34), and in primates (46). This phenomenon could be explained by the existence of mitochondrial genetic bottleneck (42, 43), involving decreased mtDNA copy number, selective amplification of a subset of mtDNA molecules, or preferential amplification of an mtDNA type. However, the exact stage in embryogenesis when this bottleneck occurs has been under debate (25, 34, 47, 48). The biphasic shift in our iPSCs mimics closely the results seen in primate heteroplasmic ES cells, which had shifted toward homoplasmy at early passage (46). This ES cell shift was suggested to be the result of strong mtDNA bottleneck occurring upon epiblast specification in the few cells directed to somatic lineages. After ES cell stage, mtDNA heteroplasmy levels did not vary considerably between different ES cell clones or in different solid tissues in primates, whereas in oocytes mtDNA segregation appeared to be random in mice and monkeys (25, 46). As previously suggested that reprogramming takes iPSC mitochondria back to an epiblast-like stage (31, 49), our results further suggest that also the mtDNA bottleneck is reproduced in vitro during reprogramming. We further observed that mtDNA in iPSCs was organized around Golgi in BBs (34). This mtDNA structure has been previously characterized in primordial germ cells, but could be a general stem cell-specific trait, assuring equal distribution of functional mitochondria during cell division. Our data, together with previous literature, suggest that mtDNA bottleneck could exist in early embryogenesis as well as in iPSCs, making the latter a potential tool to model the mechanisms of germ-line mtDNA segregation and mutant mtDNA selection in vitro.
The presence of an m.3243A>G mutation affected mtDNA dynamics both during reprogramming and upon differentiation. The mtDNA amount in MELAS-high iPSCs was more than twofold increased in early-passage iPSCs, whereas control iPSCs showed a clear reduction of mtDNA amount. Upon differentiation to neurons, mtDNA amounts increased in control cells, but not in neurons with high m.3243A>G mutant mtDNA load. The leukocytes of patients with m.3243A>G show progressive depletion of mtDNA copy number (50, 51), but we are not aware of previous studies in postmitotic tissues. These data indicate that relatively mild mtDNA mutations that survive functional selection at mtDNA bottleneck may have major effects on mtDNA copy number regulation and dynamics.
Despite their high mtDNA copy number, the MELAS-high iPSCs showed significantly decreased mitochondrial transcript levels, suggesting active down-regulation of mitochondrial transcription and/or mRNA half-lives upon high mtDNA mutation load. Because RC deficiency in the iPSCs was not significant, active translation could compensate for the relative lack of mRNAs. This implicates differential regulation of mtDNA copy number and mitochondrial transcription. The fusion transcript RNA19, previously associated with MELAS pathogenesis (29), accumulated specifically in neurons with high m.3243A>G mutant amount, further indicating tissue-context–dependent processing of mtRNAs.
In conclusion, MELAS-iPSCs can generate tissues manifesting variable combined or isolated RC deficiencies, similar to the patient tissues, with potential active down-regulation of neuronal CI. Dynamic changes in RC deficiency in different tissue types have not been modeled in experimental systems before. Together with a recent report of mitochondrial dysfunction in iPSC-derived hematopoietic cells from a patient with large mtDNA deletion and Pearson syndrome (52), our findings suggest that heteroplasmic cells and tissues generated through reprogramming are an excellent tool to study mechanisms of tissue-specific manifestations and pathogenesis of highly heterogeneous mtDNA disorders. Furthermore, we show that segregation of mutant and wild-type mtDNA upon reprogramming resembles mtDNA bottleneck upon epiblast specification. Finally, the lack of stem cell selection against the m.3243A>G mutant mtDNA could relate to the epidemiological observation that m.3243A>G is the most common mtDNA mutation globally, arising in different ethnic populations (7). iPSC-derived materials provide a unique opportunity to examine direct consequences of mtDNA mutations in the most relevant type of study materials for understanding disease pathogenesis: the patients themselves.
Materials and Methods
iPSC Derivation and Culture.
Skin biopsies were obtained from patients and healthy volunteers after informed consent (Helsinki and Uusimaa Hospital District grants all permits of patient work, also for work performed at Helsinki University) and fibroblasts were derived using standard protocol. The media for the patient cells were supplemented with 0.05 mg/mL uridine at all stages of the in vitro culture.
iPSCs were generated with retroviral transduction as described earlier (53). Briefly, the pMXs-cDNA vectors (pMXs_Oct4, pMXs_Sox2, pMXs_Klf4, pMXs_cMyc) were transfected to 293-GPG packaging cells and viral supernatants were collected at days 5, 6, and 7. Dermal fibroblasts were infected with retroviral supernatants on 2 consecutive days; 4 days after infection, the cells were replated on mitomycin-treated mouse embryonic fibroblasts. The next day, the medium was replaced with hES medium [KnockOut DMEM (Invitrogen), supplemented with 20% (vol/vol) KO-serum replacement, 2 mM GlutaMAX, 0.1 mM β-mercaptoethanol, nonessential amino acids, and 6 µg/mL FGF2]. Colonies with ES-like morphology were picked 24–30 d after transduction. Cells were maintained on mouse embryonic fibroblasts, passaging either mechanically by cutting or enzymatically using 1 mg/mL collagenase IV.
Analysis of Microsatellite Markers, Transgene Silencing, and Expression of Pluripotency Markers and Mitochondrial Transcripts.
DNA was purified from cultured cells by phenol-chloroform extraction. Total RNAs were purified using TRIzol reagent (Invitrogen). Reverse transcription was performed using MMLV-RTase and random hexamers (Promega) according to the manufacturer’s instructions. Quantitative RT-PCR was performed using the CFX96 platform (BioRad) and Dynamo Flash SYBRgreen qPCR kit (Thermo Scientific). All quantitative PCR assays were performed twice and in triplicate. Relative gene expression levels were normalized against cyclophilin (viral transgenes) or β-actin (mitochondrial transcripts). The intermediate RNA19 fusion transcript was quantified using primers spanning tRNA-Leu(UUR) from 16S rRNA to ND1 and normalizing against β-actin and 16S rRNA (detecting RNA19 plus mature 16S rRNA).
Determination of MELAs Mutation Load and mtDNA Amount.
The m.3243A>G mutation load was determined by minisequencing as previously described (54).
To clone the fibroblasts, the cells were plated on 150-mm dishes on clonal dilutions, left to grow for 12 d, after which the clones were picked and the DNA was extracted and mutation load analyzed. mtDNA quantification was done by Taqman chemistry (Applied Biosystems) as previously published (55), quantifying mitochondrial CytB gene against nuclear APP gene. All samples were analyzed in triplicate.
Neuronal Differentiation.
Neuronal differentiation was initiated by neurosphere formation as published (56) on DMEM/F12-Neurobasal (1:1) media supplemented with 1×N2, 1× B27 Minus vitamin A (Invitrogen), 1 mM Na-pyruvate, 0.05 mg/mL uridine, and 20 ng/mL FGF2. After 6 wk of culture as neurospheres, the cells were plated on laminin (10 ng/mL)-coated dishes and left to differentiate for 10–14 d in the same media except without FGF2. To allow the neural cells to mature, the cells were cultured in the final differentiation media on laminin for up to 8 wk.
Cytosolic-Free Calcium Imaging.
For functional experiments, the cells were plated on laminin-coated glass-bottomed dishes (MatTek) and loaded with 5 μM calcium indicator Fura-2 acetoxymethyl ester, supplied with 0.02% Pluronic F-127 (Sigma-Aldrich) for 50 min at room temperature in Hepes-buffered solution (127 mM NaCl, 3 mM KCl, 2 mM CaCl2, 1.3 mM MgCl2, 20 mM Hepes, 10 mM glucose, pH 7.4). After washing out Fura-2-AM, the cells were incubated for 30 min to allow de-esterification of the dye.
Cytosolic-free calcium concentrations were measured following stimulation of cells with a variety of agonists (100 μM glutamate, 10 μM AMPA, 100 μM ATP); 50 mM KCl was used to induce depolarization of plasma membrane and open voltage-gated Ca2+ channels.
Fluorescence images were obtained using an inverted Olympus IX71 microscope with a 20× objective and CCD camera (Orca). For recording stability, all optical elements were maintained at 34 °C and solutions were applied by bath perfusion (1–1.5 mL per min flow rate) using a peristaltic pump. Rate of bath solution exchange was estimated by imaging the dynamics of a perfusion-applied fluorescent dye; the full exchange time was measured as 20–25 s. Images were acquired every 2 s. Fura-2 was excited sequentially at 340 and 380 nm and its emission was collected using a 410-nm dichroic mirror and a 505-nm barrier filter. Calcium concentration was calculated from the ratio between Fura-2 signals excited at 340 and 380 nm.
Teratoma Formation.
For teratoma formation, about 2 × 10⁵ iPSCs were injected intratesticularly into NMRI nude mice (Scanbur). After 7 wk, tumors were collected and half of the tumor was fixed overnight in 4% paraformaldehyde, embedded in paraffin, and stained with hematoxylin and eosin. The other half of the tumor was frozen down in TissueTek OCT (Sakura) for cryosectioning. The experimental animal welfare committee of the District Government of Southern Finland approved the animal experimentation.
Immunofluorescence, Immunohistochemistry, and Western Blotting.
To visualize the nucleoids, live cells were incubated with PicoGreen (Molecular Probes, 1:500 in normal culture media) for 30 min at 37 °C. For immunocytochemistry, cells were fixed in 4% paraformaldehyde and permeabilized with 1% Triton-x100. Immunohistochemistry of teratomas was done from paraffin sections. To reveal antigenic sites, the rehydrated sections were treated in a microwave in 1 mM EDTA, pH 8, for 3 min. Primary antibodies were against Tra1-60 (1:40, ab90232, Millipore), SSEA4 (1:1,000, ab90231, Millipore), Nanog (1:500, D73G4, Cell Signaling Technology), β-III-tubulin [1:100 (immunofluorescence, IF), 1:500 (immunohistochemistry, IHC), T2200, Sigma], MAP2 (1:2,000, ab5543, Millipore), GFAP (1:100, mab2594, R&D Systems), DNA (1:20, AC-30-10, Progen Biotechnik), GM130 (1:250, sc16268, Santa Cruz Biotechnology), COX1 [1:200 (IF), 1:500 (western blotting, WB), M404, Mitosciences], C1-NDUFS3 (1:142, ab110246, abcam), CI-NDUFB4 (1:2,000, ab110243, abcam), CI-NDUFA9 (1:2,000, ab14713, abcam), CII-70kDa [1:2,000 (IF), 1:10000 (WB), 1:142 (IHC), MS204, Mitosciences], CIII-UQCRC2 [1:2,500 (WB), 1:1,000 (IF), 1:142 (IHC), ab14745, abcam], CV-α (1:1,000, MS507, Mitosciences), LC3B (1:200, NB600-1384, Novus Biologicals), PINK1 [1:250 (IF), 1:500 (WB), ab75487, abcam], PRK8 1:250 (IF), 1:1,000 [(WB) ab15954, abcam], β-tubulin (1:5,000, 2146, Cell Signaling Technology), β-Actin (1:2,000, sc1616, Santa Cruz Biotechnology), and TOM20 [1:250 (IF), 1:500 (WB), sc11415, Santa Cruz Biotechnology]. Nuclei were stained with DAPI.
Western blot analysis was done from protein lysates from cells with precast TGX gradient gels (BioRad) according to the manufacturer’s protocol. COX-SDH histochemical activity analyses from cryosections were done as previously published (24).
Imaging and Image Analysis.
To count nucleoids, images were analyzed with ImageJ 1.44o software (National Institutes of Health). Images were transformed to binary and the smallest and largest visible nucleoids were identified as 0.3 and 4 μm2, respectively, and the particles were analyzed between these limits.
For electron microscopy, fixation, plastic embedding, and sectioning were performed as described previously (24). Imaging was done with JEOL 1400 Transmission Electron Microscope.
Statistical Analysis.
All statistical analysis was done from two or more independent technical replicates with unpaired t test (GraphPad Prism software). *P < 0.05, **P < 0.005, ***P < 0.005. All results are presented as mean ± SEM. Kolmogorov–Smirnov test was used to analyze the difference in heteroplasmy pools between fibroblasts and iPSCs (GraphPad Prism software).
Supplementary Material
Acknowledgments
We thank A. Oksanen, A. Harju, M. Innilä, and M. Mikkola for technical assistance; R. Äänismaa and S. Narkilahti for advice in neuronal differentiation; L. Khirug in Ca-homeostasis measurements; and H. Sariola in histology analysis. This work was supported by the Academy of Finland, the Sigrid Juselius Foundation, the Jane and Aatos Erkko Foundation, the University of Helsinki, and The European Research Council.
Footnotes
The authors declare no conflict of interest.
*This Direct Submission article had a prearranged editor.
This article contains supporting information online at www.pnas.org/lookup/suppl/doi:10.1073/pnas.1311660110/-/DCSupplemental.
References
- 1.Skladal D, Halliday J, Thorburn DR. Minimum birth prevalence of mitochondrial respiratory chain disorders in children. Brain. 2003;126(Pt 8):1905–1912. doi: 10.1093/brain/awg170. [DOI] [PubMed] [Google Scholar]
- 2.Elliott HR, Samuels DC, Eden JA, Relton CL, Chinnery PF. Pathogenic mitochondrial DNA mutations are common in the general population. Am J Hum Genet. 2008;83(2):254–260. doi: 10.1016/j.ajhg.2008.07.004. [DOI] [PMC free article] [PubMed] [Google Scholar]
- 3.Holt IJ, Harding AE, Morgan-Hughes JA. Deletions of muscle mitochondrial DNA in patients with mitochondrial myopathies. Nature. 1988;331(6158):717–719. doi: 10.1038/331717a0. [DOI] [PubMed] [Google Scholar]
- 4.Wallace DC, et al. Mitochondrial DNA mutation associated with Leber’s hereditary optic neuropathy. Science. 1988;242(4884):1427–1430. doi: 10.1126/science.3201231. [DOI] [PubMed] [Google Scholar]
- 5.Ylikallio E, Suomalainen A. Mechanisms of mitochondrial diseases. Ann Med. 2012;44(1):41–59. doi: 10.3109/07853890.2011.598547. [DOI] [PubMed] [Google Scholar]
- 6.Goto Y, Nonaka I, Horai S. A mutation in the tRNA(Leu)(UUR) gene associated with the MELAS subgroup of mitochondrial encephalomyopathies. Nature. 1990;348(6302):651–653. doi: 10.1038/348651a0. [DOI] [PubMed] [Google Scholar]
- 7.Manwaring N, et al. Population prevalence of the MELAS A3243G mutation. Mitochondrion. 2007;7(3):230–233. doi: 10.1016/j.mito.2006.12.004. [DOI] [PubMed] [Google Scholar]
- 8.Majamaa K, et al. Epidemiology of A3243G, the mutation for mitochondrial encephalomyopathy, lactic acidosis, and strokelike episodes: Prevalence of the mutation in an adult population. Am J Hum Genet. 1998;63(2):447–454. doi: 10.1086/301959. [DOI] [PMC free article] [PubMed] [Google Scholar]
- 9.van den Ouweland JM, et al. Mutation in mitochondrial tRNA(Leu)(UUR) gene in a large pedigree with maternally transmitted type II diabetes mellitus and deafness. Nat Genet. 1992;1(5):368–371. doi: 10.1038/ng0892-368. [DOI] [PubMed] [Google Scholar]
- 10.Pavlakis SG, Phillips PC, DiMauro S, De Vivo DC, Rowland LP. Mitochondrial myopathy, encephalopathy, lactic acidosis, and strokelike episodes: A distinctive clinical syndrome. Ann Neurol. 1984;16(4):481–488. doi: 10.1002/ana.410160409. [DOI] [PubMed] [Google Scholar]
- 11.Hirano M, Pavlakis SG. Mitochondrial myopathy, encephalopathy, lactic acidosis, and strokelike episodes (MELAS): Current concepts. J Child Neurol. 1994;9(1):4–13. doi: 10.1177/088307389400900102. [DOI] [PubMed] [Google Scholar]
- 12.Chae JH, et al. Clinical features of A3243G mitochondrial tRNA mutation. Brain Dev. 2004;26(7):459–462. doi: 10.1016/j.braindev.2004.01.002. [DOI] [PubMed] [Google Scholar]
- 13.Goto Y, et al. Mitochondrial myopathy, encephalopathy, lactic acidosis, and stroke-like episodes (MELAS): A correlative study of the clinical features and mitochondrial DNA mutation. Neurology. 1992;42(3 Pt 1):545–550. doi: 10.1212/wnl.42.3.545. [DOI] [PubMed] [Google Scholar]
- 14.Ciafaloni E, et al. MELAS: Clinical features, biochemistry, and molecular genetics. Ann Neurol. 1992;31(4):391–398. doi: 10.1002/ana.410310408. [DOI] [PubMed] [Google Scholar]
- 15.Fornuskova D, et al. The impact of mitochondrial tRNA mutations on the amount of ATP synthase differs in the brain compared to other tissues. Biochim Biophys Acta. 2008;1782(5):317–325. doi: 10.1016/j.bbadis.2008.02.001. [DOI] [PubMed] [Google Scholar]
- 16.Moraes CT, Ricci E, Bonilla E, DiMauro S, Schon EA. The mitochondrial tRNA(Leu(UUR)) mutation in mitochondrial encephalomyopathy, lactic acidosis, and strokelike episodes (MELAS): Genetic, biochemical, and morphological correlations in skeletal muscle. Am J Hum Genet. 1992;50(5):934–949. [PMC free article] [PubMed] [Google Scholar]
- 17.Olson W, Engel WK, Walsh GO, Einaugler R. Oculocraniosomatic neuromuscular disease with “ragged-red” fibers. Arch Neurol. 1972;26(3):193–211. doi: 10.1001/archneur.1972.00490090019001. [DOI] [PubMed] [Google Scholar]
- 18.Jenuth JP, Peterson AC, Fu K, Shoubridge EA. Random genetic drift in the female germline explains the rapid segregation of mammalian mitochondrial DNA. Nat Genet. 1996;14(2):146–151. doi: 10.1038/ng1096-146. [DOI] [PubMed] [Google Scholar]
- 19.Inoue K, et al. Generation of mice with mitochondrial dysfunction by introducing mouse mtDNA carrying a deletion into zygotes. Nat Genet. 2000;26(2):176–181. doi: 10.1038/82826. [DOI] [PubMed] [Google Scholar]
- 20.Nakada K, Hayashi J. Transmitochondrial mice as models for mitochondrial DNA-based diseases. Exp Anim. 2011;60(5):421–431. doi: 10.1538/expanim.60.421. [DOI] [PubMed] [Google Scholar]
- 21.Lin CS, et al. Mouse mtDNA mutant model of Leber hereditary optic neuropathy. Proc Natl Acad Sci U S A. 2012;109(49):20065–20070. doi: 10.1073/pnas.1217113109. [DOI] [PMC free article] [PubMed] [Google Scholar]
- 22.Fan W, et al. A mouse model of mitochondrial disease reveals germline selection against severe mtDNA mutations. Science. 2008;319(5865):958–962. doi: 10.1126/science.1147786. [DOI] [PMC free article] [PubMed] [Google Scholar]
- 23.Trifunovic A, et al. Premature ageing in mice expressing defective mitochondrial DNA polymerase. Nature. 2004;429(6990):417–423. doi: 10.1038/nature02517. [DOI] [PubMed] [Google Scholar]
- 24.Tyynismaa H, et al. Mutant mitochondrial helicase Twinkle causes multiple mtDNA deletions and a late-onset mitochondrial disease in mice. Proc Natl Acad Sci USA. 2005;102(49):17687–17692. doi: 10.1073/pnas.0505551102. [DOI] [PMC free article] [PubMed] [Google Scholar]
- 25.Freyer C, et al. Variation in germline mtDNA heteroplasmy is determined prenatally but modified during subsequent transmission. Nat Genet. 2012;44(11):1282–1285. doi: 10.1038/ng.2427. [DOI] [PMC free article] [PubMed] [Google Scholar]
- 26.Tyynismaa H, Suomalainen A. Mouse models of mitochondrial DNA defects and their relevance for human disease. EMBO Rep. 2009;10(2):137–143. doi: 10.1038/embor.2008.242. [DOI] [PMC free article] [PubMed] [Google Scholar]
- 27.Takahashi K, et al. Induction of pluripotent stem cells from adult human fibroblasts by defined factors. Cell. 2007;131(5):861–872. doi: 10.1016/j.cell.2007.11.019. [DOI] [PubMed] [Google Scholar]
- 28.King MP, Attardi G. Human cells lacking mtDNA: Repopulation with exogenous mitochondria by complementation. Science. 1989;246(4929):500–503. doi: 10.1126/science.2814477. [DOI] [PubMed] [Google Scholar]
- 29.King MP, Koga Y, Davidson M, Schon EA. Defects in mitochondrial protein synthesis and respiratory chain activity segregate with the tRNA(Leu(UUR)) mutation associated with mitochondrial myopathy, encephalopathy, lactic acidosis, and strokelike episodes. Mol Cell Biol. 1992;12(2):480–490. doi: 10.1128/mcb.12.2.480. [DOI] [PMC free article] [PubMed] [Google Scholar]
- 30.Palin EJ, Paetau A, Suomalainen A. Mesencephalic complex I deficiency does not correlate with parkinsonism in mitochondrial DNA maintenance disorders. Brain. 2013;136(Pt 8):2379–2392. doi: 10.1093/brain/awt160. [DOI] [PubMed] [Google Scholar]
- 31.Prigione A, Fauler B, Lurz R, Lehrach H, Adjaye J. The senescence-related mitochondrial/oxidative stress pathway is repressed in human induced pluripotent stem cells. Stem Cells. 2010;28(4):721–733. doi: 10.1002/stem.404. [DOI] [PubMed] [Google Scholar]
- 32.de Smedt V, Szöllösi D, Kloc M. The balbiani body: Asymmetry in the mammalian oocyte. Genesis. 2000;26(3):208–212. doi: 10.1002/(sici)1526-968x(200003)26:3<208::aid-gene6>3.3.co;2-e. [DOI] [PubMed] [Google Scholar]
- 33.Cox RT, Spradling AC. A Balbiani body and the fusome mediate mitochondrial inheritance during Drosophila oogenesis. Development. 2003;130(8):1579–1590. doi: 10.1242/dev.00365. [DOI] [PubMed] [Google Scholar]
- 34.Wai T, Teoli D, Shoubridge EA. The mitochondrial DNA genetic bottleneck results from replication of a subpopulation of genomes. Nat Genet. 2008;40(12):1484–1488. doi: 10.1038/ng.258. [DOI] [PubMed] [Google Scholar]
- 35.Lucocq JM, Warren G. Fragmentation and partitioning of the Golgi apparatus during mitosis in HeLa cells. EMBO J. 1987;6(11):3239–3246. doi: 10.1002/j.1460-2075.1987.tb02641.x. [DOI] [PMC free article] [PubMed] [Google Scholar]
- 36.Hakonen AH, et al. Infantile-onset spinocerebellar ataxia and mitochondrial recessive ataxia syndrome are associated with neuronal complex I defect and mtDNA depletion. Hum Mol Genet. 2008;17(23):3822–3835. doi: 10.1093/hmg/ddn280. [DOI] [PubMed] [Google Scholar]
- 37.Parker WD, Jr, Boyson SJ, Parks JK. Abnormalities of the electron transport chain in idiopathic Parkinson’s disease. Ann Neurol. 1989;26(6):719–723. doi: 10.1002/ana.410260606. [DOI] [PubMed] [Google Scholar]
- 38.Parker WD, Jr, Parks JK, Swerdlow RH. Complex I deficiency in Parkinson’s disease frontal cortex. Brain Res. 2008;1189:215–218. doi: 10.1016/j.brainres.2007.10.061. [DOI] [PMC free article] [PubMed] [Google Scholar]
- 39.Carroll J, et al. Bovine complex I is a complex of 45 different subunits. J Biol Chem. 2006;281(43):32724–32727. doi: 10.1074/jbc.M607135200. [DOI] [PubMed] [Google Scholar]
- 40.Fujikura J, et al. Induced pluripotent stem cells generated from diabetic patients with mitochondrial DNA A3243G mutation. Diabetologia. 2012;55(6):1689–1698. doi: 10.1007/s00125-012-2508-2. [DOI] [PubMed] [Google Scholar]
- 41.Prigione A, et al. Human induced pluripotent stem cells harbor homoplasmic and heteroplasmic mitochondrial DNA mutations while maintaining human embryonic stem cell-like metabolic reprogramming. Stem Cells. 2011;29(9):1338–1348. doi: 10.1002/stem.683. [DOI] [PubMed] [Google Scholar]
- 42.Laipis PJ, Van de Walle MJ, Hauswirth WW. Unequal partitioning of bovine mitochondrial genotypes among siblings. Proc Natl Acad Sci USA. 1988;85(21):8107–8110. doi: 10.1073/pnas.85.21.8107. [DOI] [PMC free article] [PubMed] [Google Scholar]
- 43.Ashley MV, Laipis PJ, Hauswirth WW. Rapid segregation of heteroplasmic bovine mitochondria. Nucleic Acids Res. 1989;17(18):7325–7331. doi: 10.1093/nar/17.18.7325. [DOI] [PMC free article] [PubMed] [Google Scholar]
- 44.Santorelli FM, Tanji K, Shanske S, DiMauro S. Heterogeneous clinical presentation of the mtDNA NARP/T8993G mutation. Neurology. 1997;49(1):270–273. doi: 10.1212/wnl.49.1.270. [DOI] [PubMed] [Google Scholar]
- 45.Götz A, et al. Fatal neonatal lactic acidosis caused by a novel de novo mitochondrial G7453A tRNA-Serine ((UCN)) mutation. Pediatr Res. 2012;72(1):90–94. doi: 10.1038/pr.2012.43. [DOI] [PubMed] [Google Scholar]
- 46.Lee HS, et al. Rapid mitochondrial DNA segregation in primate preimplantation embryos precedes somatic and germline bottleneck. Cell Rep. 2012;1(5):506–515. doi: 10.1016/j.celrep.2012.03.011. [DOI] [PMC free article] [PubMed] [Google Scholar]
- 47.Cree LM, et al. A reduction of mitochondrial DNA molecules during embryogenesis explains the rapid segregation of genotypes. Nat Genet. 2008;40(2):249–254. doi: 10.1038/ng.2007.63. [DOI] [PubMed] [Google Scholar]
- 48.Cao L, et al. The mitochondrial bottleneck occurs without reduction of mtDNA content in female mouse germ cells. Nat Genet. 2007;39(3):386–390. doi: 10.1038/ng1970. [DOI] [PubMed] [Google Scholar]
- 49.Suhr ST, et al. Mitochondrial rejuvenation after induced pluripotency. PLoS ONE. 2010;5(11):e14095. doi: 10.1371/journal.pone.0014095. [DOI] [PMC free article] [PubMed] [Google Scholar]
- 50.Pyle A, et al. Depletion of mitochondrial DNA in leucocytes harbouring the 3243A->G mtDNA mutation. J Med Genet. 2007;44(1):69–74. doi: 10.1136/jmg.2006.043109. [DOI] [PMC free article] [PubMed] [Google Scholar]
- 51.Liu CS, et al. Alteration in the copy number of mitochondrial DNA in leukocytes of patients with mitochondrial encephalomyopathies. Acta Neurol Scand. 2006;113(5):334–341. doi: 10.1111/j.1600-0404.2006.00586.x. [DOI] [PubMed] [Google Scholar]
- 52.Cherry AB, et al. Induced pluripotent stem cells with a mitochondrial DNA deletion. Stem Cells. 2013;31(7):1287–1297. doi: 10.1002/stem.1354. [DOI] [PMC free article] [PubMed] [Google Scholar]
- 53.Trokovic R, et al. Small molecule inhibitors promote efficient generation of induced pluripotent stem cells from human skeletal myoblasts. Stem Cells Dev. 2013;22(1):114–123. doi: 10.1089/scd.2012.0157. [DOI] [PubMed] [Google Scholar]
- 54.Suomalainen A, Majander A, Pihko H, Peltonen L, Syvänen AC. Quantification of tRNA3243(Leu) point mutation of mitochondrial DNA in MELAS patients and its effects on mitochondrial transcription. Hum Mol Genet. 1993;2(5):525–534. doi: 10.1093/hmg/2.5.525. [DOI] [PubMed] [Google Scholar]
- 55.Hakonen AH, et al. Recessive Twinkle mutations in early onset encephalopathy with mtDNA depletion. Brain. 2007;130(Pt 11):3032–3040. doi: 10.1093/brain/awm242. [DOI] [PubMed] [Google Scholar]
- 56.Nat R, et al. Neurogenic neuroepithelial and radial glial cells generated from six human embryonic stem cell lines in serum-free suspension and adherent cultures. Glia. 2007;55(4):385–399. doi: 10.1002/glia.20463. [DOI] [PubMed] [Google Scholar]
Associated Data
This section collects any data citations, data availability statements, or supplementary materials included in this article.