

Screening with an estimated glomerular filtration rate lower than 45 mL/min/1.73 m2 instead of commonly used serum creatinine threshold levels would result in a significant increase in the number of identified inpatients at risk for contrast medium–induced nephrotoxicity; this effect would be minor (8.7% vs 7.4%) compared with 1.5 mg/dL threshold level and substantial (8.7% vs 2.3%) compared with 2.0 mg/dL threshold level.
Abstract
Purpose:
To compare serum creatinine (SCr) level– and estimated glomerular filtration rate (eGFR)-based screening methods for identifying adult inpatients at risk for contrast medium–induced nephrotoxicity (CIN).
Materials and Methods:
Institutional review board approval was obtained; informed consent was waived for this HIPAA-compliant retrospective study. Computed tomographic examinations performed during 10 years in adult inpatients with stable renal function were identified (n = 28 390). The proportion of inpatients meeting various eGFR (≥60, <60, <45, <30, 30–44, 45–59 mL/min/1.73 m2) and SCr (<1.5, ≥1.5, ≥1.6, ≥1.7, ≥1.8, ≥1.9, ≥2.0 mg/dL) thresholds were contrasted with each other and with published guidelines (≥2.0 mg/dL [SCr] and <45 mL/min/1.73 m2 [eGFR]) using McNemar and binomial tests.
Results:
Most inpatients were considered low risk for CIN with commonly used thresholds: 92.6% (26 285 of 28 390) had SCr <1.5 mg/dL; 91.3% (25 922 of 28 390) had eGFR of ≥45 mL/min/1.73 m2. Using SCr threshold of ≥1.5 mg/dL, identified inpatients had the following eGFRs: 19.6% (413 of 2105), 45–59 mL/min/1.73 m2; 51.1% (1075 of 2105), 30–44 mL/min/1.73 m2; 28.6% (603 of 2105), <30 mL/min/1.73 m2; and 0.7% (14 of 2105), ≥60 mL/min/1.73 m2 . Using SCr threshold of ≥2.0 mg/dL, identified inpatients had the following eGFRs: 100% (658 of 658), <45 mL/min/1.73 m2; 74.6% (491 of 658), <30 mL/min/1.73 m2. Threshold of SCr ≥2.0 mg/dL could not be used to identify eGFR <30 mL/min/1.73 m2 in 0.4% (112 of 28 390) and <45 mL/min/1.73 m2 in 6.4% (1810 of 28 390) of all inpatients. Using eGFR <45 mL/min/1.73 m2 instead of SCr of ≥1.5 mg/dL would result in a significant but small increase in identified inpatients (8.7% [2468 of 28 390; 95% confidence interval: 8.4%, 9.0%] vs 7.4% [2105 of 28 390; 95% confidence interval: 7.1%, 7.7%]; P < .0001).
Conclusion:
Screening using eGFR <45 mL/min/1.73 m2 instead of common SCr thresholds would significantly increase the number of inpatients identified to be at risk for CIN but would reduce misidentification of a large number of inpatients at low risk according to eGFR criteria.
© RSNA, 2013
Introduction
Although estimated glomerular filtration rate (eGFR) is widely recognized by nephrologists as more accurate than serum creatinine (SCr) level for the assessment of renal function in patients with stable chronic kidney disease (1,2), SCr level–based screening strategies to predict preprocedural risk for contrast medium–induced nephrotoxicity (CIN) still dominate the clinical landscape (3). In a 2006 survey of academic, private, and mixed radiology practices in the United States, Elicker et al (3) demonstrated that 92% (369 of 400) of all surveyed radiologists still used an SCr level–based threshold value to stratify CIN risk prior to inpatient examinations, while only 2% (eight of 400) used estimated creatinine clearance. In addition, because of the lack of published studies in which CIN risk relative to eGFR was assessed, the ACR Manual on Contrast Media from the ACR Committee on Drugs and Contrast Media of the American College of Radiology (ACR) (4) does not advocate eGFR-based screening. In fact, it offers no definitive guideline in regard to any laboratory-based screening threshold level, although it does state that, owing to recent evidence indicating CIN following intravenous (IV) iodinated contrast material administration is much less common than previously believed (5–17), an SCr “threshold [level] of 2.0 mg/dL in the setting of stable chronic renal insufficiency is probably safe for most patients” (4). (For SCr values, to convert conventional units to Système International units in micromoles per liter, multiply by 88.4.)
In contradistinction to the American experience, the European Society of Urogenital Radiology (ESUR) has adopted an eGFR-based screening strategy (18,19), in which CIN risk for iodinated contrast media is stratified by both eGFR and expected route of administration (with a threshold level of < 45 mL/min/1.73 m2 used to indicate patients at risk prior to IV injections). The ESUR guideline is supported by a large propensity-matched retrospective multivariate analysis of adult inpatients with stable renal function (20) that showed that IV iodinated contrast medium is a borderline nephrotoxic risk factor in patients with an eGFR of 30–44 mL/min/1.73 m2 and is a substantial nephrotoxic risk factor in patients with an eGFR of lower than 30 mL/min/1.73 m2. The ESUR position is also supported by findings in other series (21–24) that demonstrated that the incidence of post–computed tomographic (CT) acute kidney injury is highly correlated with increasing stage of chronic kidney disease, with those patients who have an eGFR of lower than 45 mL/min/1.73 m2 being at highest risk. However, most of these other studies are limited by a lack of appropriate control subjects who have not received contrast material (raising the substantial question of whether the incidence of post-CT acute kidney injury in those studies is primarily due to CIN or other causes).
As clinicians in practices consider changing from an SCr-based strategy to a potentially more accurate eGFR-based strategy for assessing preprocedural renal function, it would be useful to know how such a shift would affect the number of patients considered at risk for CIN and whether these patients would be the same patients previously considered at risk. The purpose of our study was to compare SCr level– and eGFR-based screening methods for identifying adult inpatients at risk for CIN.
Materials and Methods
Two authors (R.H.C. and J.H.E.) are consultants to a law firm representing GE Healthcare (Milwaukee, Wis) in regard to ongoing nephrogenic systemic fibrosis litigation. Another author (M.S.D.) had control of all data that might represent a conflict of interest for the other authors. Institutional review board approval was obtained, and the requirement for informed patient consent was waived for this Health Insurance Portability and Accountability Act–compliant retrospective study.
Subjects
The study population was composed of all adult (≥18 years) inpatients who had never undergone renal replacement therapy (eg, dialysis, renal transplantation) but who had undergone CT examinations of any type at a single large academic institution from January 1, 2000, to May 14, 2010.
Inclusion criteria included available data to permit calculation of the four-variable Modification of Diet in Renal Disease (MDRD) eGFR formula (age, race, sex, SCr level) and all of the following SCr measurements: (a) baseline SCr level (the most recent SCr level obtained more than 5 days prior to the index CT examination), (b) pre-CT SCr level (the most recent SCr level obtained between the time of the index CT examination and 5 days prior), and (c) at least one of three early post-CT SCr values (the first SCr value obtained in each 24-hour period for the first 72 hours after the index CT examination). The MDRD eGFR calculations were performed by using the pre-CT SCr level. There were 75 699 CT examinations that met the inclusion criteria.
CT examinations were excluded if they belonged to a patient who had undergone an earlier CT examination that met the inclusion criteria (n = 30 250 CT examinations). An additional 520 examinations were excluded because of missing data in regard to contrast material administration; 16 152 were excluded because the patients had unstable renal function prior to the CT study, and 387 were excluded because the calculated eGFR was higher than 200 mL/min/1.73 m2. Unstable renal function was defined as an increase or decrease in SCr level by 50% of baseline and/or 0.3 mg/dL when comparing the pre-CT SCr level with the baseline SCr level (25). Patients with unstable renal function and patients with eGFR higher than 200 mL/min/1.73 m2 were excluded because eGFR calculations are not reliable in this setting (1).
The final study population was composed of 28 390 adult inpatients with stable renal function (14 786 female patients [mean age, 58 years; range, 18–103 years] and 13 604 male patients [mean age, 58 years; range, 18–101 years]) imaged in 12 538 nonenhanced CT examinations and 15 852 contrast material–enhanced CT examinations. This population included 2933 African Americans, 81 multiracial patients, 453 Asians, 23 743 whites, 317 Hispanics, 109 Middle Easterners, 75 Native Americans, eight Pacific Islanders, 14 South Asians, and 657 patients of other races. In two prior studies (20,26) in which the researchers investigated the role of IV iodinated contrast material in the development of CIN, the cohorts were partially derived from the larger study population reported in this study (13 644 inpatients and CT studies are shared among all three studies).
Renal Function
Renal function was evaluated for each patient by using two methods: (a) pre-CT SCr level and (b) pre-CT eGFR (calculated by using pre-CT SCr level and the four-variable MDRD equation). Patients with a pre-CT SCr level that met one or more threshold levels (<1.5, ≥1.5, ≥1.6, ≥1.7, ≥1.8, ≥1.9, ≥2.0 mg/dL) were further stratified by using a variety of eGFR categories (≥60, <60, <45, <30, 30–44, 45–59 mL/min/1.73 m2) to determine the number of patients that colocalized to each SCr level–eGFR subgroup. Similarly, patients with a pre-CT eGFR level that met one or more threshold levels (≥60, <60, <45, <30, 59–45, 30–44 mL/min/1.73 m2) were further stratified by using a variety of SCr level categories (<1.5, ≥1.5, ≥1.6, ≥1.7, ≥1.8, ≥1.9, ≥2.0 mg/dL) to determine the number of patients that colocalized to each eGFR–SCr level subgroup.
Statistical Analysis
Categorical data (eg, proportion of patients in each SCr level–eGFR and eGFR–SCr level subgroup) are summarized with counts and percentages. The 95% confidence intervals (CIs) are included for some of the estimated proportions where subgroup differences were tested. Subgroup comparisons were made by using McNemar tests. Binomial tests were used for comparison of independent subgroups. The proportion of inpatients in each renal function subgroup were compared with published SCr level– and eGFR-based screening guidelines from the ACR (4) (ie, ≥2.0 mg/dL for the SCr threshold level) and from the ESUR (18,19) (< 45 mL/min/1.73 m2 for the eGFR threshold level) by using the McNemar test. These comparisons were made to illustrate how many and which patients would be captured by using these threshold levels as opposed to each other, as well as opposed to other commonly used threshold levels (3).
Results
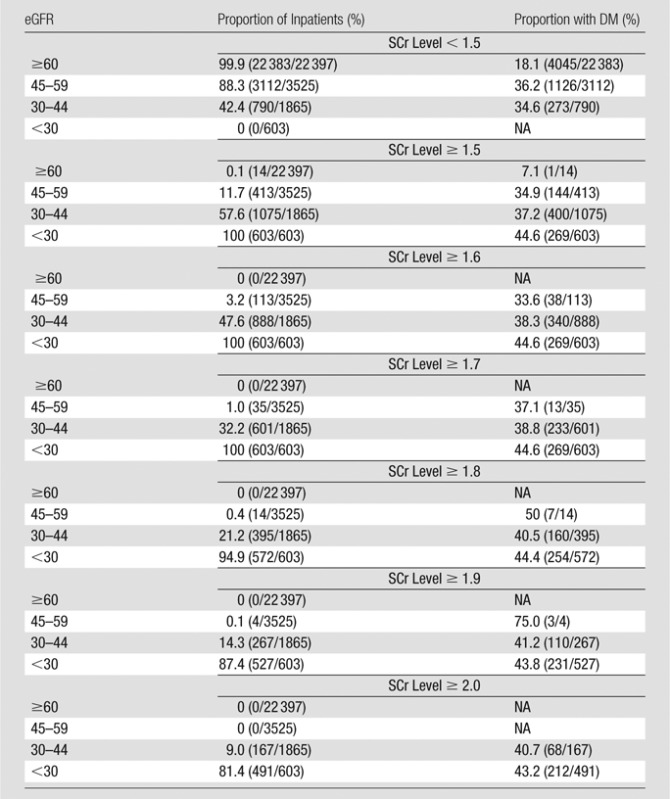
Table 1 details the proportion of inpatients with stable renal function prior to CT who met each SCr level and eGFR threshold value, as well as the fraction of inpatients in each subgroup with type 1 or 2 diabetes mellitus. Most inpatients would not be considered at risk for CIN by using any commonly accepted metric: Of 28 390 inpatients, 92.6% (26 285) had an SCr level lower than 1.5 mg/dL, 78.9% (22 397) had an eGFR of 60 mL/min/1.73 m2 or higher, and 91.3% (25 922) had an eGFR of 45 mL/min/1.73 m2 or higher. The fraction of inpatients with diabetes mellitus was significantly higher (P < .0001) in those with impaired renal function, with rates of 18.1% (95% CI: 17.6%, 18.6%) and 19.7% (95% CI: 19.2%, 20.2%) in inpatients with an eGFR of 60 mL/min/1.73 m2 or higher (18.1%, 4046 of 22 397) or an SCr level lower than 1.5 mg/dL (19.7%, 5171 of 26 285), respectively, and with rates of 42.6% (95% CI: 38.7%, 46.4%) and 44.6% (95% CI: 40.6%, 48.7%) in inpatients with an SCr level of 2.0 mg/dL or higher (42.6%, 280 of 658) or an eGFR lower than 30 mL/min/1.73 m2 (44.6%, 269 of 603), respectively. The rate of diabetes mellitus was relatively constant among all SCr-level subgroups with threshold levels of 1.5 mg/dL or higher and eGFR subgroups with threshold levels lower than 45 mL/min/1.73 m2, ranging from 36.1% (673 of 1865), with an eGFR of 30–44 mL/min/1.73 m2, to 44.6% (269 of 603), with an eGFR lower than 30 mL/min/1.73 m2.
Table 1.
Adult Inpatients with Stable Renal Function Who Met SCr or eGFR Threshold Levels before Diagnostic CT Examinations of Any Type
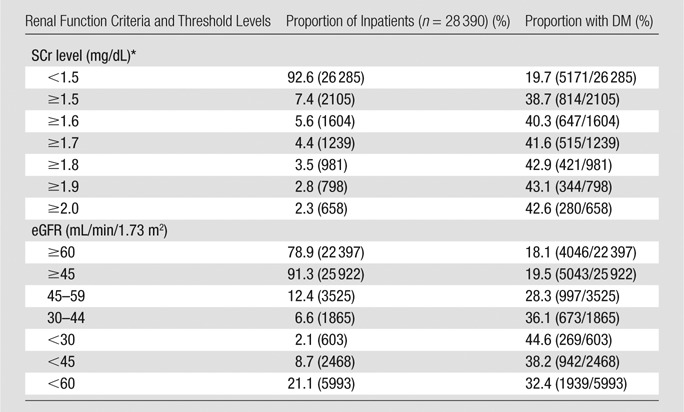
Note.—Total population in the study was 28 390. DM = type 1 or 2 diabetes mellitus. Numbers in parentheses were used to calculate the percentages.
To convert to Système International units in micromoles per liter, multiply by 88.4.
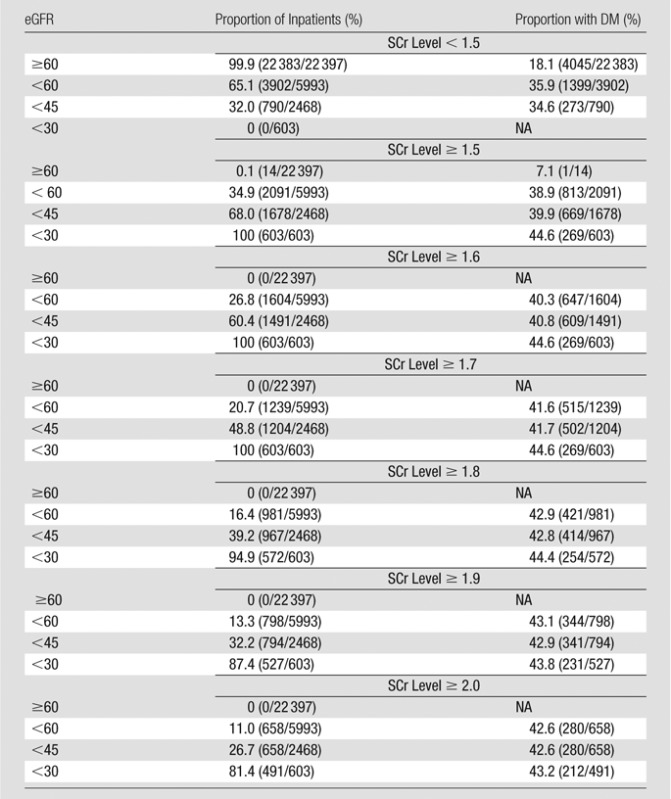
Tables 2 and 3 show stratification of the inpatient population by using pre-CT SCr levels and demonstrate the observed proportion of inpatients at a given SCr threshold level that also met one or more eGFR threshold levels. Tables 4 and 5 exhibit similar findings in reverse, starting with eGFR and displaying the observed proportion of inpatients at a given eGFR threshold level that also met one or more SCr threshold levels. These tables can be used to make predictions about how the population of inpatients labeled as at risk for CIN will vary with changes in CIN screening policies. For example, if clinicians in a practice are using an SCr threshold level of 1.5 mg/dL or higher for adult inpatients with stable renal function, and a change is made to emphasize eGFR-based screening, those clinicians in that practice can expect that approximately 20% (19.6%, 413 of 2105) of inpatients previously considered at risk (SCr level, ≥1.5 mg/dL) will have an eGFR between 45 and 59 mL/min/1.73 m2, approximately 50% (51.1%, 1075 of 2105) will have an eGFR between 30 and 44 mL/min/1.73 m2, approximately 30% (28.6%, 603 of 2105) will have an eGFR lower than 30 mL/min/1.73 m2, and approximately 1% (0.7%, 14 of 2105) will have an eGFR of 60 mL/min/1.73 m2 or higher (Table 3).
Table 2.
Adult Inpatients with Stable Chronic Kidney Disease Who Met One or More SCr Threshold Levels and One or More eGFR Threshold Levels before Diagnostic CT Examinations of Any Type: Stratification Beginning with SCr Level
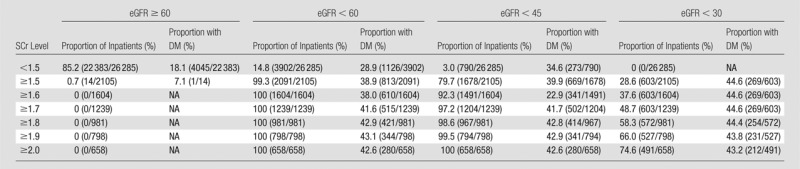
Note.—The SCr level was measured in milligrams per deciliter, and the conversion factor for Système International units is given in Table 1. The eGFR was measured in milliliters per minute per 1.73 m2. The proportion of inpatients refers to the proportion of inpatients at that SCr level. The denominator for each percentage is based on the total number of patients who met each SCr threshold level (Table 1). Numbers in parentheses were used to calculate the percentages. DM = type 1 or 2 diabetes mellitus, NA = not available.
Table 3.
Adult Inpatients with Stable Chronic Kidney Disease Who Met One or More SCr Threshold Levels and One or More eGFR Threshold Levels before Diagnostic CT Examinations of Any Type: Stratification Beginning with SCr Level
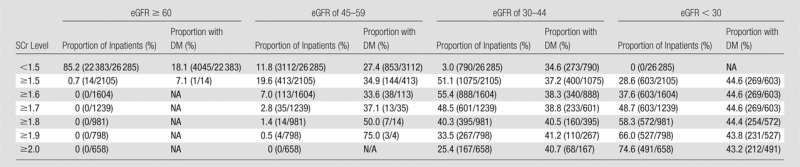
Note.—The SCr level was measured in milligrams per deciliter, and the conversion factor for Système International units is given in Table 1. The eGFR was measured in milliliters per minute per 1.73 m2. The proportion of inpatients refers to the proportion of inpatients at that SCr level. The denominator of each percentage is based on the total number of patients who met each SCr threshold level (Table 1). Numbers in parentheses were used to calculate the percentages. DM = type 1 or 2 diabetes mellitus, NA = not available.
Table 4.
Adult Inpatients with Stable Chronic Kidney Disease Who Met One or More eGFR Threshold Levels and One or More SCr Threshold Levels before Diagnostic CT Examinations of Any Type: Stratification Beginning with eGFR
Note.—The SCr level was measured in milligrams per deciliter, and the conversion factor for Système International units is given in Table 1. The eGFR was measured in milliliters per minute per 1.73 m2. The proportion of inpatients refers to the proportion of inpatients at that eGFR level. The denominator of each percentage is based on the total number of patients who met each eGFR threshold level (Table 1). Numbers in parentheses were used to calculate the percentages. DM = type 1 or 2 diabetes mellitus, NA = not available.
Table 5.
Adult Inpatients with Stable Chronic Kidney Disease Who Met One or More eGFR Threshold Levels and One or More SCr Threshold Levels before Diagnostic CT Examinations of Any Type: Stratification Beginning with eGFR
Note.—The SCr level was measured in milligrams per deciliter, and the conversion factor for Système International units is given in Table 1. The eGFR was measured in milliliters per minute per 1.73 m2. The proportion of inpatients refers to the proportion of inpatients at that eGFR level. The denominator of each percentage is based on the total number of patients in each eGFR category (Table 1). Numbers in parentheses were used to calculate the percentages. DM = type 1 or 2 diabetes mellitus, NA = not available.
Because inpatients with an eGFR of 45 mL/min/1.73 m2 or higher are probably not at substantial risk of developing CIN from IV iodinated contrast material (18–20), use of a 1.5 mg/dL or higher SCr screening threshold level will result in the inadvertent inclusion of approximately 20% (20.3% [427 of 2105]; 95% CI: 18.6%, 22.1%) of inpatients who are not at a particularly increased risk (eGFR, ≥45 mL/min/1.73 m2). However, on the basis of our data, conversion from a 1.5 mg/dL or higher SCr threshold level to a lower than 45 mL/min/1.73 m2 eGFR threshold level would actually result in a significantly larger fraction of patients being identified as at risk (Table 1) (7.4% [2105 of 28 390; 95% CI: 7.1%, 7.7%] vs 8.7% [2468 of 28 390; 95% CI: 8.4%, 9.0], P < .0001). This is because in our data set there were more inpatients (n = 790) with an eGFR lower than 45 mL/min/1.73 m2 who had an SCr level lower than 1.5 mg/dL than there were inpatients (n = 427) who had an eGFR of 45 mL/min/1.73 m2 or higher with an SCr level of 1.5 mg/dL or higher.
Using the ACR-considered SCr threshold level of 2.0 mg/dL or higher, 74.6% (491 of 658) of identified at-risk inpatients had an eGFR lower than 30 mL/min/1.73 m2, and 100% (658 of 658) had an eGFR lower than 45 mL/min/1.73 m2 (Table 2). This means that all identified inpatients with a SCr level of 2.0 mg/dL or higher had an eGFR that has been associated with either a borderline or substantially increased risk of CIN (18–20). However, an SCr threshold level of 2.0 mg/dL or higher would not identify an eGFR lower than 30 mL/min/1.73 m2 in 0.4% (112 of 28 390; 95% CI: 0.33%, 0.48%) of all inpatients and an eGFR lower than 45 mL/min/1.73 m2 in 6.4% (1810 of 28 390; 95% CI: 6.1%, 6.7%) of all inpatients. This indicates that a small number of potentially at-risk inpatients still will not be identified as at risk by using a 2.0 mg/dL SCr threshold level.
If the suggested threshold level of the ESUR of lower than 45 mL/min/1.73 m2 is used, approximately 30% (32.0% [790 of 2468]; 95% CI: 30.2%, 33.9%) of included inpatients will have an SCr level lower than 1.5 mg/dL. This represents a large proportion of inpatients that would not have been identified with most currently used SCr level–based screening methods (3). None of the inpatients (zero of 2468) in our population with both an eGFR lower than 45 mL/min/1.73 m2 and an SCr level lower than 1.5 mg/dL had an eGFR lower than 30 mL/min/1.73 m2. Therefore, all of the inpatients who were identified as potentially at risk by using the eGFR-based criterion of a level lower than 45 mL/min/1.73 m2 who also had an SCr level lower than 1.5 mg/dL were in the borderline-risk eGFR population, and not the highest-risk eGFR population (20).
If any of the commonly used SCr level–based screening threshold levels (SCr, ≥ 1.5–2.0 mg/dL) are converted to an eGFR-based screening method using a threshold level of lower than 45 mL/min/1.73 m2, there will be a significant increase in the number of patients labeled “at-risk” (for ≥ 1.5, ≥ 1.6, ≥ 1.7, ≥ 1.8, ≥ 1.9, and ≥ 2.0 mg/dL, P < .0001). As Table 1 shows, the SCr threshold levels of 1.5 mg/dL or higher and 2.0 mg/dL or higher could be used to identify 7.4% (2105 of 28 390; 95% CI: 7.1%, 7.7%) and 2.3% (658 of 28 390; 95% CI: 2.1%, 2.5%), respectively, of inpatients as at risk, compared with 8.7% (2468 of 28 390; 95% CI: 8.4%, 9.0%) for the eGFR threshold level of lower than 45 mL/min/1.73 m2. In contrast, if a commonly used SCr level–based screening threshold level (SCr, ≥1.5–2.0 mg/dL) is changed to a lower than 30 mL/min/1.73 m2 eGFR-based screening threshold level (the population at highest risk of CIN from IV iodinated contrast material [18–20]), there will be a significant reduction in the number of inpatients labeled as at risk (for ≥1.5, ≥1.6, ≥1.7, ≥1.8, and ≥1.9 mg/dL, P < .0001; for ≥2.0 mg/dL, P = .001).
Discussion
Our study results demonstrate the effect on inpatient CIN risk assignment of changing preprocedural screening practices from SCr level–based methods to eGFR-based methods, and vice versa. Converting from an SCr level–based method (SCr level, ≥1.5–2.0 mg/dL) to an eGFR-based method using a lower than 45 mL/min/1.73 m2 threshold level, as has been recommended by the ESUR (18,19), will result in an increase in the number of inpatients identified as at risk for CIN. This effect will be minor if an SCr threshold level of 1.5 mg/dL or higher was used previously (the number of identified inpatients will increase from 7.4% to 8.7%) or will be substantial if an SCr threshold level of 2.0 mg/dL or higher was used previously (the number of identified inpatients will increase from 2.3% to 8.7%). This effect is reversed if an eGFR threshold level of lower than 30 mL/min/1.73 m2 is chosen instead of the lower than 45 mL/min/1.73 m2 threshold level, with a reduction in the number of inpatients labeled as at risk for all commonly used SCr threshold levels (3).
In two large propensity-matched retrospective multivariate analyses in which CIN risk was stratified by using preprocedural SCr level (26) and eGFR (20), the researchers showed that the overall population of inpatients with either an SCr level lower than 1.5 mg/dL or an eGFR of 45 mL/min/1.73 m2 or higher were not at increased risk of CIN and that inpatients with an eGFR of 30–44 mL/min/1.73 m2 were at borderline increased risk of CIN (20). In our study, none of the inpatients with an SCr level lower than 1.5 mg/dL had an eGFR lower than 30 mL/min/1.73 m2, and only 3.0% (790 of 26 285) had an eGFR of 30–44 mL/min/1.73 m2. Of inpatients with an eGFR lower than 30 mL/min/1.73 m2, 100% (603 of 603) had an SCr level of 1.7 mg/dL or higher and 81.4% (491 of 603) had an SCr level of 2.0 mg/dL or higher.
In 2008, Herts et al (27) evaluated the incidence of renal insufficiency in patients being screened prior to outpatient CT (2689 patients had sufficient data to compute the four-variable MDRD eGFR formula) and then compared the number of patients who had an SCr level higher than 1.4 mg/dL with the number of patients with an eGFR lower than 60 mL/min/1.73 m2. The authors found that a substantially greater fraction of patients met the eGFR criterion than met the SCr level criterion (15.3% [412 of 2689] vs 6.2% [166 of 2689], P < .0001). These two threshold levels were chosen to determine the ramifications of changing CIN screening from a commonly used SCr threshold level (>1.4 mg/dL), which is the same as our ≥1.5 mg/dL threshold level, to a less commonly used eGFR threshold level (<60 mL/min/1.73 m2). The authors made an assumption that these SCr level and eGFR cutoff values appropriately indicated a threshold level above or below which a patient might be at increased risk for developing CIN. They concluded that using eGFR to identify patients with renal insufficiency prior to CT may lead to a substantially greater fraction (approximately 2.5 times) of patients being considered at risk. This conclusion differs somewhat from ours, but there are several important distinctions between our two studies that may explain this discrepancy.
Herts et al (27) evaluated outpatients prior to contrast-enhanced CT and did not limit their analysis to patients with stable renal function; in contrast, in our study, we assessed inpatients with stable renal function prior to CT examinations of any type (both nonenhanced and contrast enhanced). In addition, and more important, in their study, these researchers considered the use of eGFR lower than 60 mL/min/1.73 m2 to signify increased risk for post-CT acute kidney injury (and by extension, CIN risk). On the basis of recent work (20,21), and recommendations by the ESUR (18,19), it has been suggested that an eGFR threshold level of lower than 45 mL/min/1.73 m2 may be more appropriate to identify patients at risk for CIN from IV iodinated contrast material; of course, fewer patients will meet this criterion than will meet the eGFR of lower than 60 mL/min/1.73 m2 threshold level of Herts et al (27). Although we also detected a significant increase (P < .001) in the proportion of inpatients presenting for CT with an eGFR of lower than 45 mL/min/1.73 m2 compared with the proportion with an SCr level of 1.5 mg/dL or higher, the rates in our study are actually much closer to each other (8.7% [2468 of 28 390; 95% CI: 8.4%, 9.0%] vs 7.4% [2105 of 28 390; 95% CI: 7.1%, 7.7%]) than the difference reported by Herts et al (15.3% [412 of 2689] vs 6.2% [166 of 2689]) (27). In other words, switching from an SCr level–based screening strategy by using a 1.5 mg/dL or higher threshold level to an eGFR-based screening strategy by using a lower than 45 mL/min/1.73 m2 threshold level probably would not have a major effect on the fraction of inpatients labeled at higher risk of CIN. This is particularly true if inpatients with an eGFR of 30–44 mL/min/1.73 m2 are truly considered at borderline and not at substantially increased risk (in which case, the number of inpatients considered at higher risk may actually decrease if eGFR-based screening is adopted). Only 2.1% (603 of 28 390) of all inpatients with stable renal function in our study had an eGFR that was in the subgroup at greatest risk for developing CIN (eGFR, <30 mL/min/1.73 m2) (18–20).
If an SCr level–based screening strategy is continued instead, our results indicate that the threshold level suggested by the ACR (SCr level, ≥2.0 mg/dL) may fail to help detect all at-risk inpatients with stable renal function. Although this criterion is specific (74.6% [491 of 658] of identified inpatients had an eGFR lower than 30 mL/min/1.73 m2, and 100% [658 of 658] had an eGFR lower than 45 mL/min/1.73 m2), it failed to help identify an eGFR lower than 30 mL/min/1.73 m2 in 0.4% (112 of 28 390) of the inpatient population and an eGFR lower than 45 mL/min/1.73 m2 in 6.4% (1810 of 28 390) of the inpatient population. Therefore, while the statement of the ACR that a “threshold [level] of 2.0 mg/dL in the setting of stable chronic renal insufficiency is probably safe for most patients” is true, there are 0.4%–6.4% of potentially at-risk inpatients who would be falsely labeled as not at risk if this threshold level was utilized. Although these percentages are small, they may have clinical implications, given the large number of CT examinations performed each year. On the other hand, if an SCr threshold level of 1.5 mg/dL or higher is used instead, fully 20.3% (427 of 2105) of identified inpatients in our study had an eGFR of 45 mL/min/1.73 m2 or higher, a subgroup for which IV iodinated contrast material does not appear to represent a significant nephrotoxic risk factor (18–20).
Our study had several limitations. The database we used was originally derived to evaluate the effect of IV low-osmolality contrast material on the development of CIN. Therefore, 520 patients who did not have appropriate documentation in regard to the use of contrast material with their CT examination were excluded, despite that such absent information would not have been necessary for this study. However, given that this number of patients is small, relative to the overall study population (1.8%, 520 of 28 390), and that missing contrast material documentation is probably not a cause of bias with respect to SCr and/or eGFR determinations, we do not believe that this limitation is substantial. The study population was derived from patients with repeated SCr measurements. This factor could have biased our results toward patients with greater renal function impairment. However, we would not expect this potential bias to have had a greater effect on either SCr level or eGFR calculations; therefore, such a bias is unlikely to have affected our conclusions. An additional limitation was that, in our study, we solely assessed the relationship of SCr and eGFR with respect to the inpatient population. The inpatient population in this study is probably older than the general outpatient population, and older patients tend to have lower eGFR determinations than younger patients with otherwise identical SCr levels, age, and sex. Other studies would be needed to determine whether the conclusions of this study remain true for outpatient screening. Finally, our study population was composed solely of patients with stable renal function. This factor was so because both SCr level and the MDRD formula (which relies on SCr level) are inaccurate in patients with unstable renal function because SCr is a lagging indicator of renal function. Furthermore, the MDRD formula does not incorporate body mass index or other measures of muscle mass that may affect SCr levels.
In summary, screening by using eGFR lower than 45 mL/min/1.73 m2 instead of commonly used SCr threshold levels would result in a significant increase in the number of patients identified as at risk for CIN; this effect would be minor (8.7% vs 7.4%) compared with a threshold level of 1.5 mg/dL and substantial compared with a threshold level of 2.0 mg/dL (8.7% vs 2.3%). Our study results showed that a small number of inpatients with eGFR levels lower than 45 and/or lower than 30 mL/min/1.73 m2 are not captured by using an SCr threshold level of 2.0 mg/dL or higher; in addition, a large fraction of inpatients identified by using a 1.5 mg/dL or higher SCr threshold level are in fact at low risk for CIN on the basis of eGFR criteria (eGFR, ≥45 mL/min/1.73 m2).
Advances in Knowledge.
• Converting from a serum creatinine (SCr) level–based screening process using a 1.5 mg/dL or higher threshold level to an estimated glomerular filtration rate (eGFR)-based screening process using a lower than 45 mL/min/1.73 m2 threshold level for contrast medium–induced nephrotoxicity (CIN) risk in adult inpatients will result in a significant but small increase in the number of identified at-risk inpatients (7.4% [2105 of 28 390; 95% confidence interval {CI}: 7.1%, 7.7%] vs 8.7% [2468 of 28 390; 95% CI: 8.4%, 9.0%], respectively; P < .0001).
• An SCr screening threshold level for CIN of 2.0 mg/dL or higher would fail to identify an eGFR lower than 30 mL/min/1.73 m2 in 0.4% (112 of 28 390; 95% CI: 0.33%, 0.48%) and an eGFR lower than 45 mL/min/1.73 m2 in 6.4% (1810 of 28 390; 95% CI: 6.1%, 6.7%) of the adult inpatient population.
• An SCr screening threshold level for CIN of 1.5 mg/dL or higher will capture a large number of adult inpatients (20.3% [427 of 2105]; 95% CI: 18.6%, 22.1%) with an eGFR of 45 mL/min/1.73 m2 or higher.
• An eGFR screening threshold level for CIN of lower than 45 mL/min/1.73 m2 will capture a large minority of adult inpatients (32.0% [790 of 2468]; 95% CI: 30.2%, 33.9%) with an SCr level of lower than 1.5 mg/dL.
Implications for Patient Care.
• Conversion to an eGFR-based screening method for assessing preprocedural CIN risk by using a lower than 45 mL/min/1.73 m2 threshold level would result in a significant but small increase in the number of identified at-risk adult inpatients compared with the more commonly used SCr threshold level of 1.5 mg/dL or higher.
• Conversion to an eGFR-based screening method for assessing preprocedural CIN risk by using a lower than 45 mL/min/1.73 m2 threshold level would reduce the misidentification of a large number of adult inpatients at low risk for CIN on the basis of eGFR criteria that are identified by using a 1.5 mg/dL or higher SCr threshold level.
Disclosures of Conflicts of Interest: M.S.D. Financial activities related to the present article: institution received a direct-costs grant for research on CIN from the Society of Uroradiology. Financial activities not related to the present article: none to disclose. Other relationships: none to disclose. S.K. Financial activities related to the present article: institution received a Society of Uroradiology Research Award. Financial activities not related to the present article: none to disclose. Other relationships: none to disclose. R.H.C. Financial activities related to the present article: none to disclose. Financial activities not related to the present article: received consultancy fees from GE Healthcare; fees for expert testimony from GE Healthcare, U.S. Government Department of Justice, LeClair Ryan, Attorneys at law, John Hickey, Esq; and royalties from Lippincott, Williams, and Wilkins. Other relationships: none to disclose. J.H.E. Financial activities related to the present article: none to disclose. Financial activities not related to the present article: receives payment for serving on a medical advisory group regarding iodinated contrast agents from GE Healthcare. Other relationships: none to disclose.
Received November 16, 2012; revision requested December 17; final revision received December 22; accepted January 25, 2013; final version accepted January 29.
Supported by a grant from the Society of Uroradiology.
Funding: This research was supported by the National Institutes of Health (grant UL1RR024986).
Abbreviations:
- ACR
- American College of Radiology
- CI
- confidence interval
- CIN
- contrast medium–induced nephrotoxicity
- eGFR
- estimated glomerular filtration rate
- ESUR
- European Society of Urogenital Radiology
- IV
- intravenous
- MDRD
- Modification of Diet in Renal Disease
- SCr
- serum creatinine
References
- 1.National Kidney Foundation K/DOQI clinical practice guidelines for chronic kidney disease: evaluation, classification, and stratification. Am J Kidney Dis 2002;39(2 suppl 1):S1–S266 [PubMed] [Google Scholar]
- 2.Smith HW. Comparative physiology of the kidney. The kidney: structure and function in health and disease. New York, NY: Oxford University Press, 1951; 520–574 [Google Scholar]
- 3.Elicker BM, Cypel YS, Weinreb JC. IV contrast administration for CT: a survey of practices for the screening and prevention of contrast nephropathy. AJR Am J Roentgenol 2006;186(6):1651–1658 [DOI] [PubMed] [Google Scholar]
- 4.ACR Committee on Drugs and Contrast Media ACR manual on contrast media, version 8. American College of Radiology Web site. http://www.acr.org/-/media/ACR/Documents/PDF/QualitySafety/Resources/Contrast%. Published 2012. Accessed October 8, 2012
- 5.Katzberg RW, Lamba R. Contrast-induced nephropathy after intravenous administration: fact or fiction? Radiol Clin North Am 2009;47(5):789–800, v. [DOI] [PubMed] [Google Scholar]
- 6.Rao QA, Newhouse JH. Risk of nephropathy after intravenous administration of contrast material: a critical literature analysis. Radiology 2006;239(2):392–397 [DOI] [PubMed] [Google Scholar]
- 7.Newhouse JH, Kho D, Rao QA, Starren J. Frequency of serum creatinine changes in the absence of iodinated contrast material: implications for studies of contrast nephrotoxicity. AJR Am J Roentgenol 2008;191(2):376–382 [DOI] [PubMed] [Google Scholar]
- 8.Katzberg RW, Newhouse JH. Intravenous contrast medium-induced nephrotoxicity: is the medical risk really as great as we have come to believe? Radiology 2010;256(1):21–28 [DOI] [PubMed] [Google Scholar]
- 9.Bruce RJ, Djamali A, Shinki K, Michel SJ, Fine JP, Pozniak MA. Background fluctuation of kidney function versus contrast-induced nephrotoxicity. AJR Am J Roentgenol 2009;192(3):711–718 [DOI] [PubMed] [Google Scholar]
- 10.Baumgarten DA, Ellis JH. Contrast-induced nephropathy: contrast material not required? AJR Am J Roentgenol 2008;191(2):383–386 [DOI] [PubMed] [Google Scholar]
- 11.Ellis JH, Cohan RH. Reducing the risk of contrast-induced nephropathy: a perspective on the controversies. AJR Am J Roentgenol 2009;192(6):1544–1549 [DOI] [PubMed] [Google Scholar]
- 12.Tremblay LN, Tien H, Hamilton P, et al. Risk and benefit of intravenous contrast in trauma patients with an elevated serum creatinine. J Trauma 2005;59(5):1162–1166; discussion 1166–1167 [DOI] [PubMed] [Google Scholar]
- 13.Langner S, Stumpe S, Kirsch M, Petrik M, Hosten N. No increased risk for contrast-induced nephropathy after multiple CT perfusion studies of the brain with a nonionic, dimeric, iso-osmolal contrast medium. AJNR Am J Neuroradiol 2008;29(8):1525–1529 [DOI] [PMC free article] [PubMed] [Google Scholar]
- 14.Oleinik A, Romero JM, Schwab K, et al. CT angiography for intracerebral hemorrhage does not increase risk of acute nephropathy. Stroke 2009;40(7):2393–2397 [DOI] [PMC free article] [PubMed] [Google Scholar]
- 15.Bansal GJ, Darby M. Measurement of change in estimated glomerular filtration rate in patients with renal insufficiency after contrast-enhanced computed tomography: a case-control study. J Comput Assist Tomogr 2009;33(3):455–459 [DOI] [PubMed] [Google Scholar]
- 16.Lima FO, Lev MH, Levy RA, et al. Functional contrast-enhanced CT for evaluation of acute ischemic stroke does not increase the risk of contrast-induced nephropathy. AJNR Am J Neuroradiol 2010;31(5):817–821 [DOI] [PMC free article] [PubMed] [Google Scholar]
- 17.McGillicuddy EA, Schuster KM, Kaplan LJ, et al. Contrast-induced nephropathy in elderly trauma patients. J Trauma 2010;68(2):294–297 [DOI] [PubMed] [Google Scholar]
- 18.Stacul F, van der Molen AJ, Reimer P, et al. Contrast induced nephropathy: updated ESUR Contrast Media Safety Committee guidelines. Eur Radiol 2011;21(12):2527–2541 [DOI] [PubMed] [Google Scholar]
- 19.ESUR Contrast Medium Safety Committee ESUR guidelines on contrast media, version 8.0. European Society of Urogenital Radiology Web site. http://www.esur.org/guidelines/en/index.php. Published 2012. Accessed November 15, 2012 [Google Scholar]
- 20.Davenport MS, Khalatbari S, Cohan RH, Dillman JR, Myles JD, Ellis JH. Contrast material–induced nephrotoxicity and intravenous low-osmolality iodinated contrast material: risk stratification by using estimated glomerular filtration rate. Radiology 2013;268(3):719–728 [DOI] [PubMed] [Google Scholar]
- 21.Thomsen HS, Morcos SK. Risk of contrast-medium-induced nephropathy in high-risk patients undergoing MDCT: a pooled analysis of two randomized trials. Eur Radiol 2009;19(4):891–897 [DOI] [PubMed] [Google Scholar]
- 22.Weisbord SD, Mor MK, Resnick AL, Hartwig KC, Palevsky PM, Fine MJ. Incidence and outcomes of contrast-induced AKI following computed tomography. Clin J Am Soc Nephrol 2008;3(5):1274–1281 [DOI] [PMC free article] [PubMed] [Google Scholar]
- 23.Kim SM, Cha RH, Lee JP, et al. Incidence and outcomes of contrast-induced nephropathy after computed tomography in patients with CKD: a quality improvement report. Am J Kidney Dis 2010;55(6):1018–1025 [DOI] [PubMed] [Google Scholar]
- 24.Valette X, Parienti JJ, Plaud B, Lehoux P, Samba D, Hanouz JL. Incidence, morbidity, and mortality of contrast-induced acute kidney injury in a surgical intensive care unit: a prospective cohort study. J Crit Care 2012;27(3):322.e1–322.e5 [DOI] [PubMed] [Google Scholar]
- 25.Mehta RL, Kellum JA, Shah SV, et al. Acute Kidney Injury Network: report of an initiative to improve outcomes in acute kidney injury. Crit Care 2007;11(2):R31:1–8 [DOI] [PMC free article] [PubMed] [Google Scholar]
- 26.Davenport MS, Khalatbari S, Dillman JR, Cohan RH, Caoili EM, Ellis JH. Contrast material–induced nephrotoxicity and intravenous low-osmolality iodinated contrast material. Radiology 2013;267(1):94–105 [DOI] [PMC free article] [PubMed] [Google Scholar]
- 27.Herts BR, Schneider E, Poggio ED, Obuchowski NA, Baker ME. Identifying outpatients with renal insufficiency before contrast-enhanced CT by using estimated glomerular filtration rates versus serum creatinine levels. Radiology 2008;248(1):106–113 [DOI] [PubMed] [Google Scholar]