

Transplanted mesenchymal stem cells (MSCs) could be detected and tracked with MR imaging, if the donor is treated with an intravenous injection of the Food and Drug Administration–approved iron supplement ferumoxytol prior to MSC harvesting.
Abstract
Purpose:
To determine whether intravenous ferumoxytol can be used to effectively label mesenchymal stem cells (MSCs) in vivo and can be used for tracking of stem cell transplants.
Materials and Methods:
This study was approved by the institutional animal care and use committee. Sprague-Dawley rats (6–8 weeks old) were injected with ferumoxytol 48 hours prior to extraction of MSCs from bone marrow. Ferumoxytol uptake by these MSCs was evaluated with fluorescence, confocal, and electron microscopy and compared with results of traditional ex vivo–labeling procedures. The in vivo–labeled cells were subsequently transplanted in osteochondral defects of 14 knees of seven athymic rats and were evaluated with magnetic resonance (MR) imaging up to 4 weeks after transplantation. T2 relaxation times of in vivo–labeled MSC transplants and unlabeled control transplants were compared by using t tests. MR data were correlated with histopathologic results.
Results:
In vivo–labeled MSCs demonstrated significantly higher ferumoxytol uptake compared with ex vivo–labeled cells. With electron microscopy, iron oxide nanoparticles were localized in secondary lysosomes. In vivo–labeled cells demonstrated significant T2 shortening effects in vitro and in vivo when they were compared with unlabeled control cells (T2 in vivo, 15.4 vs 24.4 msec; P < .05) and could be tracked in osteochondral defects for 4 weeks. Histologic examination confirmed the presence of iron in labeled transplants and defect remodeling.
Conclusion:
Intravenous ferumoxytol can be used to effectively label MSCs in vivo and can be used for tracking of stem cell transplants with MR imaging. This method eliminates risks of contamination and biologic alteration of MSCs associated with ex vivo–labeling procedures.
© RSNA, 2013
Supplemental material: http://radiology.rsna.org/lookup/suppl/doi:10.1148/radiol.13130858/-/DC1
Introduction
Each year, arthritis results in 44 million outpatient visits, 992 100 hospitalizations, and 700 000 knee replacement procedures (www.cdc.gov/arthritis) (1–3). The need for knee replacement is rapidly increasing, with 3.48 million expected procedures by 2030 (4). However, artificial implants are associated with potential complications, such as periprosthetic fractures, loosening, and metal sensitivity (4–6). Even in the absence of complications, the lifetime of an artificial prosthesis is limited to approximately 10 years because of wear of the implant (7–9). Cell transplants, particularly stem cell–scaffold nanocomposites, overcome these problems by providing long-term biologic restoration of joint defects (10–14). Bone marrow–derived mesenchymal stem cells (MSCs) have been established as a promising source for stem cell–mediated joint repair in a clinical setting. MSCs can be easily obtained with a bone marrow aspirate, are efficiently expanded in vitro, and can differentiate into all joint components (15–17). However, interactions between transplanted MSCs and the patient’s host environment are still poorly understood. To monitor successful engraftment and recognize complications such as graft failure or tumor formation, MSC therapies require in vivo tracking of the transplanted stem cells with noninvasive imaging technologies.
In the past, stem cell tracking has been achieved on the basis of the concept of ex vivo contrast agent labeling (18–23). This approach requires multiple ex vivo manipulations of stem cells between their harvest and transplantation. Clinical translation of ex vivo–labeling procedures is complicated from a regulatory point of view, as these manipulations greatly enhance the risk of cell sample contamination (24), alterations in stem cell biology, or in vivo side effects from added transfection agents (25–27). Most transfection agents (Lipofectamine 2000 [Invitrogen, Carlsbad, Calif] or poly-l-lysine [Sigma-P4707; Sigma-Aldrich, St Louis, Mo]) are not U.S. Food and Drug Administration (FDA) approved (28). In addition, some ultrasmall superparamagnetic iron oxide–transfection agent combinations have induced cytotoxic effects (29–32) or altered the stem cell biology (33). To avoid these complications, we undertook to determine whether an immediately clinically applicable approach for stem cell labeling, which would not require ex vivo manipulations of harvested cells and which would eliminate the need for transfection agents, could be used to track transplanted MSCs. Our approach relies on intravenous administration of the FDA-approved iron supplement ferumoxytol (Feraheme; Advanced Magnetics, Cambridge, Mass) to a stem cell donor prior to stem cell harvest from bone marrow. Ferumoxytol is composed of iron oxide nanoparticles (34), which are taken up by the reticuloendothelial system in vivo (13,35–39) and which provide a strong signal intensity effect on magnetic resonance (MR) images (13,40–42). On the basis of these properties, we postulated that intravenously injected ferumoxytol would be taken up by MSCs in bone marrow, would be retained in the cells through harvesting and ex vivo expansion, and allow for sensitive in vivo MSC detection with MR imaging after transplantation into osteochondral defects. Thus, our aim was to determine whether intravenous ferumoxytol as a clinically applicable iron supplement can be used to effectively label MSCs in vivo and can be used for tracking of stem cell transplants.
Materials and Methods
In Vivo MSC Labeling
The study was approved by the animal care and use committee at Stanford University (Stanford, Calif). Sixteen 6–8-week-old Sprague-Dawley rats (Charles River, Wilmington, Mass) served as MSC donors: Seven rats remained untreated, while nine rats were injected intravenously with ferumoxytol (n = 7) or fluorescein isothiocyanate (FITC) (Fisher Scientific, Pittsburgh, Pa)-conjugated ferumoxytol (n = 2) (hereafter referred to as FITC-ferumoxytol) at a dose of 28 mg of iron per kilogram. The details for synthesis are included in Appendix E1 (online). This dose had led to significant MR signal intensity effects of the bone marrow in rodents in previous studies (13,43). Seven athymic Sprague-Dawley rats served as MSC recipients and underwent MR imaging up to 4 weeks after stem cell transplantation.
MSC Extraction and Cultivation
Donor Sprague-Dawley rats were euthanized by means of CO2 inhalation 2 days after intravenous ferumoxytol injection to allow sufficient time for phagocytosis by reticuloendothelial system cells, considering a blood half-life of 67 minutes in rodents (13,42,44). Both femurs and tibias were isolated. The epiphyses were removed, and the bone marrow was flushed with Dulbecco’s modified Eagle’s medium (Invitrogen), supplemented with 10% fetal bovine serum (Invitrogen). The cells were separated on a cell strainer (BD, Franklin Lakes, NJ) to prevent adding any coagulated tissue in the culture flask, centrifuged at 1800 rpm for 10 minutes and resuspended in 1 mL of ammonium-chloride-potassium buffer (ACK Lysing Buffer; Invitrogen) for 2 minutes, washed with phosphate-buffered saline, and spun again at 1800 rpm for 10 minutes. The cells were plated in a flask with a 75-cm2 flask area (culture surface area) in full media, supplemented with 50 pg of fibroblast growth factor (Gibco, Gaithersburg, Md) and maintained at 37°C with 5% CO2 for 7 days (Fig 1). The medium was replaced every 72 hours or when cells reached confluence. Nonadherent hematopoietic stem cells, red blood cells, and white blood cells were eliminated with every change in culture medium, leaving the adherent and expanding MSCs behind. This “direct adherence” method has shown improved efficiencies for MSC selection, compared with “density gradient centrifugation” (45,46).
Figure 1:
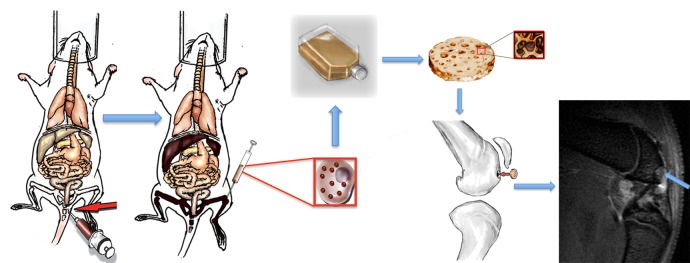
Concept of in vivo ferumoxytol labeling of bone marrow MSCs and subsequent in vivo tracking of transplanted MSCs with MR imaging. The technique relies on intravenous injection of ferumoxytol (red arrow) and its phagocytosis by cells in the reticuloendothelial system (liver, spleen, and bone marrow). Ferumoxytol-labeled bone marrow cells are harvested by using bone marrow aspiration (red square insets) and expanded in vitro for 7 days. Larger inset: A cell. Smaller inset: Cells seeded on a scaffold. The labeled cells are then seeded in an agarose scaffold and implanted in an osteochondral defect of the distal femur. Sagittal T2-weighted MR image (repetition time msec/echo time msec, 4000/15, 30, 45, 60) shows monitoring of transplant engraftment (arrow).
All in vivo experiments were performed with cells at passage 0 (day 7 of labeling). In vitro studies involved evaluation of ferumoxytol-labeled cells and unlabeled cells until day 28, corresponding to passage 0–6. Viability assays were performed at each passage by using the trypan blue exclusion test with the use of an automatic cell counter (Countess; Invitrogen).
MSC Immunostaining
Day 7 cells were fixed with 10% formalin (BDH, West Chester, Pa) and plated on chamber slides at a concentration of cells of 60 000/cm2. Immunohistochemical stains against CD105 for MSC (Endoglin M-20; Santa Cruz Biotechnology, Dallas, Tex) and CD68 for macrophages (Abcam, Cambridge, Mass) were performed, and slides were counterstained by using 4′,6-diamidine-2-phenylindole. Two researchers counted the number of CD105- and CD68-positive cells separately, and data were averaged over 12 high-power fields (magnification, ×20) for each stain.
Evaluation of Ferumoxytol Uptake by MSCs
MSCs labeled with FITC-ferumoxytol in vivo or FITC-conjugated ferumoxytol and protamine (hereafter referred to as FITC-ferumoxytol-protamine) ex vivo (47), as well as untreated control cells, were evaluated for the presence or absence of green FITC fluorescence by using a fluorescence microscope (Olympus BH-2; Scion, Frederick, Md) and image processing software (Metamorph; Molecular Devices, Sunnyvale, Calif). Cell samples were also analyzed by using confocal microscopy (LSM 510; Carl Zeiss, Thornwood, NY). Fluorescence intensities and three-dimensional (3D) intensity plots were calculated with ImageJ software (http://rsbweb.nih.gov/ij/) by using an established protocol (48) and a threshold of 20 fluorescence units.
To evaluate the compartmentalization of iron oxide nanoparticles in MSCs, 400 000 cells (in triplicate) labeled in vivo with ferumoxytol, labeled ex vivo with ferumoxytol and protamine, or untreated (control cells) were processed for electron microscopy (49). Sections of 100-nm thickness of resin-embedded cell samples were placed on 100-mesh Formvar-coated copper grids (FCF2010-Cu; Electron Microscopy Sciences, Hatfield, Pa) and imaged using a transmission electron microscope (Tecnai F20 X-Twin; FEI, Hillsboro, Ore).
In addition, triplicate samples of in vivo–labeled MSCs (at days 7 and 14), ex vivo–labeled MSCs, and unlabeled control cells underwent inductively coupled plasma optical emission spectrometry for quantification of intracellular iron content. The iron content per sample was divided by cell concentration to provide iron content per cell.
Evaluation of in Vitro MR Signal Intensity Effects of Ferumoxytol-labeled MSCs
Triplicate samples of 400 000 labeled and unlabeled control cells at days 7, 14, 21, and 28 after extraction were suspended in 10 μL of agarose scaffold (Sigma-Aldrich) and underwent MR imaging with a 7-T animal MR imaging unit (“microSigna 7.0” collaboration between GE Healthcare [Waukesha, Wis] and Varian [Walnut Creek, Calif]) using a single-channel transmit-receive partial birdcage radiofrequency coil. Sagittal MR images of the cell samples were obtained with a fast spin-echo sequence (3000/30) and a multiple-echo spin-echo sequence (4000/15, 30, 45, 60), using a field-of-view of 3.5 × 3.5 cm, a matrix of 256 × 256 pixels, and a section thickness of 0.5 mm. Pixelwise T2 relaxation time maps generated by using custom research software (Cinetool; GE Global Research Center, Niskayuna, NY) were used to measure T2 relaxation times of each sample through operator-defined regions of interest. Following MR imaging, the chondrogenic potential of the cell samples was evaluated per established protocols (50).
In Vivo MR Tracking of Ferumoxytol-labeled MSCs
The animal experiments were approved by the animal care and use committee at Stanford University. Next, in vivo–labeled MSCs were implanted into osteochondral defects of knee joints of seven recipient rats (14 knees). Osteochondral defects were created in the distal femoral trochlear groove of both knee joints by using a microdrill (Ideal, Sycamore, Ill). In each rat, 1 × 10⁶ in vivo ferumoxytol-labeled MSCs in an agarose scaffold were implanted into the right femur and 1 × 10⁶ unlabeled MSCs in an agarose scaffold were implanted into the left femur. MSC transplants were evaluated with MR imaging immediately after stem cell transplantation (n = 7), as well as 2 weeks (n = 7) and 4 weeks (n = 6) after transplantation, by using the same MR technique described above. T2 relaxation time maps were generated. After the last MR image was obtained, at 2 weeks (n = 1) and 4 weeks (n = 6) after transplantation, animals were sacrificed, and specimens were processed for histopathologic correlations, which included hematoxylin-eosin, 3,3′diaminobenzidine–Prussian blue, and Alcian blue staining. Immunohistochemical staining against CD105 (Endoglin M-20; Santa Cruz Biotechnology) and CD68 (Abcam) were performed to evaluate MSCs and macrophage populations in osteochondral defects, respectively.
Statistical Analysis
T2 relaxation times and iron uptake data were compared for significant differences between different experimental groups by using t tests. Within each group, changes in MR data over time were examined by using ordinary least squares linear regression analyses. The t tests, analysis of variance, and linear models were computed by using the t test and the aov and lm functions in R (version 2.15.2), respectively. Because the right and left knees of each rat contained different implants, we assumed that MR images of each rat’s knee were independent observations. To examine the possibility that data from the same rats were dependent (eg, different rats metabolized the iron labels at different rates), multilevel models were fit to MR data by using the R package lme4 (version 0.999999–0), with specifications identical to each linear model. A variable that identified each rat was added as a random effect, and the fit of each model was compared. In each case, the model fits were not significantly different. For all analyses, a P value of less than .05 was considered to indicate a significant difference among different experimental groups or different times of observation.
Results
MSC Immunostaining
The yield from bone marrow aspirates was approximately 400 million cells for both ferumoxytol-injected animals and untreated control animals. MSC-selective culture led to separation of MSCs (attached to the flask) from other cells (in solution). At day 7, approximately 5 million cells remained attached to the flask. Staining in a mean of 181.3 day 7 cells per high-power field ± 7.9 (standard deviation) (70.2% ± 1.9) was positive for CD105, while staining in only a mean of 33.4 day 7 cells per high-power field ± 5.6 (13.5% ± 2.3) was positive for CD68 (Fig 2). Of note, freshly extracted MSCs are small in size and slowly expand in culture (51). Expansion in cell culture is needed prior to ex vivo labeling to achieve satisfactory cell survival. Ex vivo labeling requires 4 hours of fetal bovine serum deprivation, exposure to a transfection agent (protamine), and multiple centrifugation steps that freshly extracted cells can hardly withstand (47) (Figs 2, 3).
Figure 2:
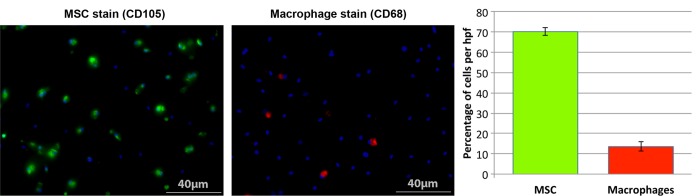
MSC and macrophage immunostaining. CD105 and CD68 stains of bone marrow–derived cells after 7 days of MSC-selective culture. Evaluation of 3000 4′,6-diamidine-2-phenylindole–positive cells in 12 high-power fields (magnification, ×20) revealed a mean of 70.2% ± 1.9 MSCs (CD105-positive cells = green) and of 13.5% ± 2.3 macrophages (CD68-positive cells = red) per high-power field. 4′,6-Diamidine-2-phenylindole (blue) counterstain visualized cell nuclei of all cells in these samples, including CD105- and CD68-positive cells and other cells. hpf = High-power field.
Figure 3:

Ferumoxytol uptake by MSCs, labeled in vivo via ferumoxytol injection or labeled ex vivo via protamine transfection. 3,3′Diaminobenzidine (DAB)–Prussian blue staining, fluorescence microscopy, confocal microscopy, and corresponding 3D fluorescent plots show intracellular iron uptake for in vivo– and ex vivo–labeled cells, with a higher effectiveness of the in vivo–labeling technique compared with ex vivo labeling. Transmission electron microscopy images show compartmentalization of iron oxide nanoparticles (arrows) in secondary lysosomes in in vivo– and ex vivo–labeled cells, with relatively higher intralysosomal nanoparticle quantities in the in vivo–labeled cells. Nonlabeled control cells are shown for comparison. 4′,6-Diamidine-2-phenylindole (blue), rhodamine (red), and FITC (green) signals represent nuclei, cytoskeleton, and iron nanoparticles, respectively. Colocalization of red and green signals indicates the presence of iron nanoparticles in the cytoplasm. This colocallization of green and red signals results in yellow signal for high concentrations of iron nanoparticles in in vivo–labeled cells and orange color for smaller concentrations of iron nanoparticles in ex vivo–labeled cells. The 3D plots reveal the amount of FITC-positive signal (iron nanoparticles) as peaks per pixel in each cell.
Evaluation of Ferumoxytol Uptake by MSCs
MSCs labeled with FITC-ferumoxytol demonstrated cellular iron oxide uptake at fluorescence and confocal microscopy, without apparent differences in cytoplasmic nanoparticle compartmentalization between in vivo– or ex vivo–labeled cells (Fig 3). Electron microscopy localized iron oxide nanoparticles in secondary lysosomes (Fig 3). However, confocal and electron microscopy examinations revealed a higher quantity of iron oxide nanoparticles in in vivo–labeled MSCs compared with ex vivo–labeled MSCs (Fig 3, Fig E1 [online]). The fluorescence intensity of in vivo–labeled cells (Δ intensity = 47.025) was 3.2 times higher compared with the fluorescence intensity of ex vivo–labeled cells (Δ intensity = 14.527, P = .00005). The 3D plots, representing FITC-ferumoxytol concentrations as peaks per pixel on the area of individual cells (Fig 3) confirm that labeled in vivo cells are smaller in size and contain more iron nanoparticles than labeled ex vivo cells. Both labeling techniques showed significantly higher fluorescence intensities as compared with control cells (P < .001) (Fig 3).
Evaluation of in Vitro MR Signal Intensity Effects of Ferumoxytol-labeled MSCs
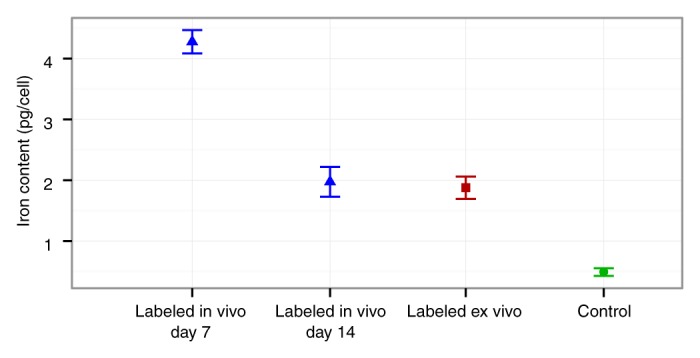
In vivo–labeled MSCs displayed strong signal intensity effects on T2-weighted MR images with significantly shortened T2 relaxation times (mean, 8.292 msec ± 2.326) compared with unlabeled control cells (mean, 33.614 msec ± 5.111; P = .024) (Fig 4a). Follow up studies demonstrated a slow decline in T2 signal intensity effects of labeled MSCs over time, which corresponded to a slow decline in cellular iron content (Fig 4). After 3 weeks of cell culture, the T2 signal intensity of in vivo–labeled MSCs was not significantly different from that of unlabeled control cells (P = .167) (Fig 4b). A two-way analysis of variance confirmed that differences between groups (F = 52.75; df = 1, 20; P = .00000002) and between weeks (F = 20.99; df = 1, 20; P = .00006) and the interaction between the two (F = 6.29; df = 1, 20; P = .017) were all significant. Accordingly, the iron uptake per cell, as measured by inductively coupled plasma optical emission spectrometry, was significantly higher for in vivo–labeled MSCs at day 7 (at day of transplantation, mean was 4.276 pg per cell ± 0.190) compared with unlabeled cells (mean, 0.490 pg per cell ± 0.063; P < .0001) and ex vivo–labeled cells (mean, 1.877 pg per cell ± 0.183; P < .0001) (Fig 4b). Labeled cells at day 14 showed significantly higher iron uptake than unlabeled cells (P = .02) but not ex vivo–labeled cells (P > .05) (Fig 4b). In vivo–labeled MSCs and unlabeled control cells showed no differences in chondrogenic differentiation (Fig 5).
Figure 4a:
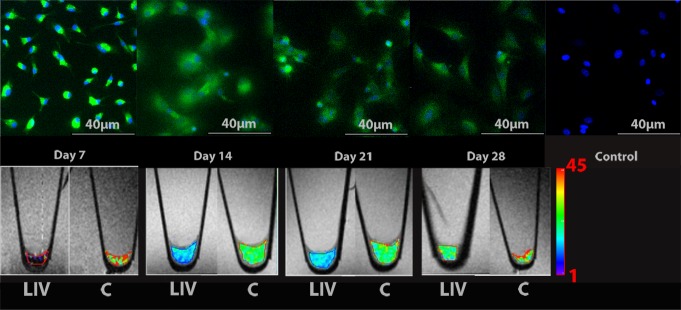
Longitudinal in vitro evaluations of FITC-ferumoxytol–labeled MSCs. (a) Fluorescence microscopy demonstrates green fluorescence signal of in vivo FITC-ferumoxytol–labeled cells. The fluorescence signal slowly declines over time. Corresponding T2 relaxation time maps of cell pellets in test tubes show shortening of T2 relaxation times of in vivo–labeled cell pellets compared with unlabeled control pellets, which also decreases slowly over time. Color spectrum = color scale for T2 time (milliseconds) that signifies MR signal intensity of the pellet; the more iron (ferumoxytol) the cells contain, the lower the T2 value. LIV = labeled in vivo, C = control cells. (b) Quantitative T2 relaxation times of in vivo–labeled cell pellets and unlabeled control cells at weeks 1, 2, 3, and 4 after extraction from bone marrow show shortening of T2 relaxation times of in vivo–labeled cell pellets compared with unlabeled control cells. (c) Iron content per cell of in vivo–labeled cells, ex vivo–labeled cells, and control cells, as measured by inductively coupled plasma optical emission spectrometry. In vivo–labeled cells show significantly higher iron uptake at day 7 compared with ex vivo–labeled cells and control cells. Data are displayed as means and standard errors (error bars) of triplicate samples per experimental group, with 4 × 10⁵ cells per sample.
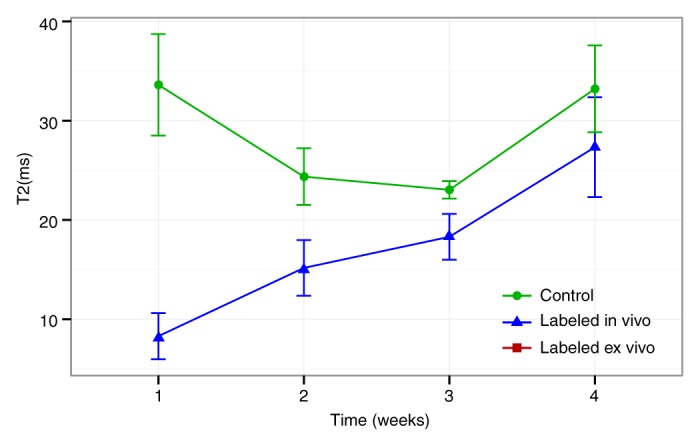
Figure 4b:
Longitudinal in vitro evaluations of FITC-ferumoxytol–labeled MSCs. (a) Fluorescence microscopy demonstrates green fluorescence signal of in vivo FITC-ferumoxytol–labeled cells. The fluorescence signal slowly declines over time. Corresponding T2 relaxation time maps of cell pellets in test tubes show shortening of T2 relaxation times of in vivo–labeled cell pellets compared with unlabeled control pellets, which also decreases slowly over time. Color spectrum = color scale for T2 time (milliseconds) that signifies MR signal intensity of the pellet; the more iron (ferumoxytol) the cells contain, the lower the T2 value. LIV = labeled in vivo, C = control cells. (b) Quantitative T2 relaxation times of in vivo–labeled cell pellets and unlabeled control cells at weeks 1, 2, 3, and 4 after extraction from bone marrow show shortening of T2 relaxation times of in vivo–labeled cell pellets compared with unlabeled control cells. (c) Iron content per cell of in vivo–labeled cells, ex vivo–labeled cells, and control cells, as measured by inductively coupled plasma optical emission spectrometry. In vivo–labeled cells show significantly higher iron uptake at day 7 compared with ex vivo–labeled cells and control cells. Data are displayed as means and standard errors (error bars) of triplicate samples per experimental group, with 4 × 10⁵ cells per sample.
Figure 5:

In vivo–labeled MSCs maintain their chondrogenic differentiation potential in vitro. MSC pellets after differentiation in chondrogenic media for 4 weeks maintain a 3D structure, as shown by hematoxylin-eosin (H & E) stains. Alcian blue– and safranin O–positive stains confirm chondrogenic matrix production for both in vivo–labeled cells and control cells.
Figure 4c:
Longitudinal in vitro evaluations of FITC-ferumoxytol–labeled MSCs. (a) Fluorescence microscopy demonstrates green fluorescence signal of in vivo FITC-ferumoxytol–labeled cells. The fluorescence signal slowly declines over time. Corresponding T2 relaxation time maps of cell pellets in test tubes show shortening of T2 relaxation times of in vivo–labeled cell pellets compared with unlabeled control pellets, which also decreases slowly over time. Color spectrum = color scale for T2 time (milliseconds) that signifies MR signal intensity of the pellet; the more iron (ferumoxytol) the cells contain, the lower the T2 value. LIV = labeled in vivo, C = control cells. (b) Quantitative T2 relaxation times of in vivo–labeled cell pellets and unlabeled control cells at weeks 1, 2, 3, and 4 after extraction from bone marrow show shortening of T2 relaxation times of in vivo–labeled cell pellets compared with unlabeled control cells. (c) Iron content per cell of in vivo–labeled cells, ex vivo–labeled cells, and control cells, as measured by inductively coupled plasma optical emission spectrometry. In vivo–labeled cells show significantly higher iron uptake at day 7 compared with ex vivo–labeled cells and control cells. Data are displayed as means and standard errors (error bars) of triplicate samples per experimental group, with 4 × 10⁵ cells per sample.
In Vivo MR TrackIng of Ferumoxytol-labeled MSCs
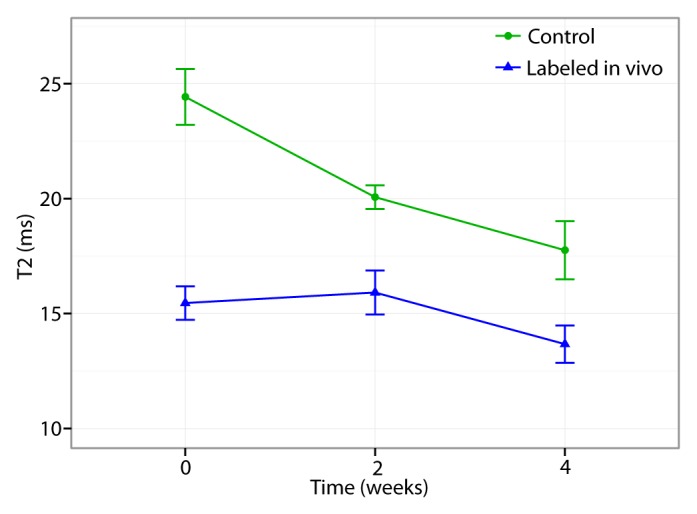
MSCs from ferumoxytol-treated donors, transplanted into osteochondral defects of recipient rats, showed strong signal intensity effects on T2-weighted MR images with significantly shortened T2 relaxation times (mean, 15.459 msec ± 0.729) compared with unlabeled control cells (mean, 24.423 msec ± 1.213 P = .0002) (Fig 6). Longitudinal follow-up studies revealed slowly decreasing T2 signal intensity effects of unlabeled control cells over time, apparently because of local cell proliferation and decreasing proton (water) content of the scaffold. Conversely, the T2 signal intensity effects of iron-labeled cells remained stable over time, with the coefficient on week, βweek, of −0.465 msec ± 0.311 (P = .152), which may be due to combined effects of decreasing scaffold proton (water) content and slow iron metabolism over time. T2 relaxation times of iron-labeled MSC transplants were significantly lower compared with those of unlabeled control cells at all times of observation (P < .05) (Fig 6), although the difference between labeled and unlabeled cells decreased slowly during 4 weeks. A two-way analysis of variance confirmed that differences between groups (F = 17.14; df = 1, 20; P = .0005) and between weeks (F = 5.60; df = 1, 20; P = .028) and the interaction between the two (F = 6.64; df = 1, 20; P = .018) were all significant. A power analysis indicated that future validation studies will need at least five samples in each treatment group to achieve 80% power by using a two-sample t test to detect an effect at week 2 and at least eight samples per treatment group to detect an effect at week 4.
Figure 6a:

Sagittal T2-weighted MR images (4000/15, 30, 45, 60) of matrix-associated stem cell implants in osteochondral defects of rat knee joints. (a) Representative T2 relaxation time maps show shortened T2 relaxation times of in vivo–labeled MSC transplants (arrow) compared with unlabeled control transplants (arrowhead) at weeks 0, 2, and 4 after transplantation. The T2 signal effect of labeled transplants slowly decreases over time. Color spectrum = color scale for T2 time (milliseconds) that signifies MR signal intensity of the implant; the more iron (ferumoxytol) the implanted cells contain, the lower the T2 value. (b) Corresponding T2 relaxation times show significantly shorter T2 values of in vivo–labeled transplants compared with unlabeled control transplants up to 4 weeks after implantation. Data are displayed as means and standard errors (error bars) of six animals in each group.
Figure 6b:
Sagittal T2-weighted MR images (4000/15, 30, 45, 60) of matrix-associated stem cell implants in osteochondral defects of rat knee joints. (a) Representative T2 relaxation time maps show shortened T2 relaxation times of in vivo–labeled MSC transplants (arrow) compared with unlabeled control transplants (arrowhead) at weeks 0, 2, and 4 after transplantation. The T2 signal effect of labeled transplants slowly decreases over time. Color spectrum = color scale for T2 time (milliseconds) that signifies MR signal intensity of the implant; the more iron (ferumoxytol) the implanted cells contain, the lower the T2 value. (b) Corresponding T2 relaxation times show significantly shorter T2 values of in vivo–labeled transplants compared with unlabeled control transplants up to 4 weeks after implantation. Data are displayed as means and standard errors (error bars) of six animals in each group.
Corresponding 3,3′diaminobenzidine–Prussian blue stains confirmed decreasing iron staining of labeled MSC transplants over time, indicating slow iron metabolization (Fig 7). Hematoxylin-eosin staining in histopathologic examinations demonstrated engraftment of ferumoxytol-labeled MSCs in the osteochondral defect, without any notable morphologic difference, compared with unlabeled control cells (Fig 7). At 4 weeks after MSC implantation, both labeled and unlabeled implants had started to remodel the defect and to produce a chondrogenic matrix, as evidenced by staining that was positive for Alcian blue (Fig 7). A stain that was positive for CD105 for both week 2 and week 4 implants confirmed implantation of MSCs (Fig E2 [online]). Immunohistochemical stains revealed staining that was negative for CD68 for week 2 implants but slightly positive for CD68 surrounding the defect in week 4 implants, suggesting minimal host macrophage influx (Fig E2 [online]).
Figure 7:

Histopathologic correlation of matrix-associated stem cell implants. Representative sections at 2 weeks and 4 weeks after implantation. Hematoxylin-eosin (H & E) stains show engraftment of all implants, and 3,3′diaminobenzidine (DAB)–Prussian blue stains show implanted cells containing iron (brown staining) at 2 and 4 weeks for labeled in vivo transplants, whereas unlabeled control transplants remain unstained. Alcian blue stains show cartilage formation in all implants.
Discussion
Our data showed that transplanted MSCs could be detected and tracked with MR imaging, if the donor is treated with an intravenous injection of the FDA-approved iron supplement ferumoxytol prior to MSC harvesting. The described in vivo–MSC labeling procedure with ferumoxytol may provide an immediately clinically applicable approach for in vivo stem cell tracking in patients (52,53). Thousands of patients have received intravenous ferumoxytol injections for the purpose of anemia treatment (54–57). An off-label use of this drug for in vivo MSC labeling would not require any changes of the FDA-approved administration route or dose. In vivo labeling may eliminate safety concerns associated with ex vivo stem cell manipulations and enable in vivo detection of lost or rejected stem cell transplants early enough for corrective actions. The presented approach might not only affect patients with MSC transplants in arthritic joints, but also patients with a variety of other stem cell transplants in other target organs.
Classic methods of tracking the in vivo distribution of stem cells rely on introducing a genetic marker (eg, a vector carrying the lacZ gene that encodes β-galactosidase) into transplanted stem cells that can be specifically stained after extraction (58,59). This approach is limited to preclinical investigations. Imaging techniques, on the other hand, enable noninvasive, longitudinal investigations of engraftment processes in patients. Among various available imaging techniques for cell tracking (60–63), MR imaging is the only technique that can allow visualization of cartilage directly (without any adjustments or treatment beforehand) (64). Stem cells have been tracked in cartilage defects after ex vivo labeling with either gadolinium chelates (65–67) or iron oxide nanoparticles (12,13,42,68,69). However, none of these labeling techniques have been translated to clinical stem cell tracking applications in arthritic joints so far.
Human neural stem cells (70), MSCs (71), dendritic cells (72), and pancreatic islet cells (73) have been tracked in patients in other anatomic and biologic contexts, such as traumatic brain injury, stroke, cancer, and islet grafts for diabetes mellitus treatment (70–74). These studies relied on ex vivo cell labeling with the superparamagnetic iron oxide nanoparticle compound ferumoxides (Feridex; Bayer HealthCare Pharmaceuticals, Montville, NJ), which had the advantage of being spontaneously phagocytosed by stem cells. Unfortunately, ferumoxides is no longer produced by the pharmaceutical industry (75). Meanwhile, newer, second-generation, ultrasmall superparamagnetic iron oxides, such as ferumoxytol, have been introduced (13,40–42) and they require assisted labeling techniques with transfection agents, such as protamine (68) or protamine-heparin combinations (76). Heparin may cause cartilage damage and secondary bleeds (77,78). Concerns related to side effects of transfection procedures can be circumvented by using in vivo labeling (24).
It is unclear why MSCs efficiently phagocytose ferumoxytol without transfection agents in vivo but not ex vivo. Possible explanations include longer exposure of MSCs to ferumoxytol or in vivo signaling events that facilitate MSC phagocytosis (44,79). Our data showed that in vivo ferumoxytol phagocytosis by MSCs was more efficient than ex vivo ferumoxytol labeling with protamine transfection. Probably because of this higher initial iron load, we found a longer in vivo detectability of in vivo ferumoxytol-labeled MSCs (4 weeks) compared with ex vivo ferumoxytol-labeled MSCs (2 weeks) (76). On the other hand, in vivo labeling with the ultrasmall superparamagnetic iron oxide ferumoxytol was less efficient compared with previously published ex vivo–labeling procedures with the larger superparamagnetic iron oxides such as ferumoxides (mean, 4.5 pg per cell ± 0.27) (80) and ferucarbotran (mean, 7.08 pg per cell ± 0.48) (81). However, the iron load achieved with our technique was sensitive enough for in vivo detection and did not cause any impairment in chondrogenesis, whereas the previously described superparamagnetic iron oxide caused a dose-dependent impairment in chondrogenesis (29,50).
We recognize several limitations of our study. We found different T2 relaxation times of labeled stem cells in an agarose scaffold in our in vitro and in vivo studies. This observation can be explained by a well-described degradation and replacement of the scaffold by an extracellular matrix in vivo (82,83): At every time in vitro (weeks 0, 2, and 4), a new scaffold was used for our in vitro MR images, while in vivo, the same scaffold was evaluated during 4 weeks. A faster increase in T2 relaxation times of labeled cells in vitro (significant for 3 weeks) may be due to higher cell proliferation and stable water content of the scaffold. By comparison, nearly constant T2 relaxation times during 4 weeks in vivo may be due to a combined effect of iron metabolization of labeled cell transplants (increasing T2 relaxation times) and scaffold degradation with extracellular matrix production (decreasing T2 relaxation times). More important, the MR imaging signal intensity of labeled and unlabeled stem cell transplants was significantly different at week 0 and week 2, thereby allowing a diagnosis of successful stem cell deposition and short-term persistence in the defect. Clinical translations of longitudinal imaging studies have to take into account signal intensity changes of both labeled stem cells and scaffolds.
Investigators in several previous studies confirmed uptake of iron oxide nanoparticles by bone marrow macrophages in animal models and in patients (13,38). We have previously described that bone marrow macrophages are labeled by means of intravenous ferumoxytol injection and that these iron-labeled macrophages migrate into apoptotic stem cell transplants, but not viable transplants (13). This effect could be an additional variable for our stem cell tracking approach, if stem cell donor and recipient were the same. On the basis of our previous observations, we would expect that ferumoxytol-labeled viable stem cell transplants would demonstrate stable or decreasing T2 signal intensity effects over time, while apoptotic transplants would be expected to show increasing T2 signal intensity effect (ie, T2 shortening, lower signal intensity) over time owing to the influx of iron-labeled macrophages.
Our data were acquired in rodents and have to be confirmed in humans. Researchers in previous studies (38,84) have confirmed bone marrow T2 signal intensity enhancement after intravenous ultrasmall superparamagnetic iron oxide injection in patients, corroborating the feasibility of our approach in a clinical setting. We found relatively small T2 signal intensity effects of our labeled cells, but previous groups (85) were able to diagnose an acute rejection of cardiac transplants on the basis of T2 relaxation time changes as low as 7 milliseconds. We could use more sensitive T2*-weighted sequences or increase the intravenously administered iron dose if needed. Although some clinical protocols also use MSC expansion times of 7 days or shorter (86), other clinical protocols expand MSCs for longer intervals (87,88) or not at all (89,90). This would lead to more or less dilution of the iron label and require adjustment of MR pulse sequences for sensitive in vivo cell detection. Moreover, even though ferumoxytol is generally well tolerated (56), rare events of serious anaphylactic reactions (0.2%) have been described (91). This risk would apply to any ferumoxytol-related imaging approach (intravenous injection or transplantation of ex vivo–labeled cells). Patients will have to be screened carefully for any history of allergies, especially in regard to dextran and iron compounds. Investigators in a study (92) similar to ours reported no major adverse effects during a follow-up of 25 months after intravenous and intrathecal injection of autologous superparamagnetic iron oxide–labeled MSCs in patients with multiple sclerosis and amyotrophic lateral sclerosis.
In summary, we developed an immediately available, potentially clinically applicable approach for in vivo stem cell labeling with an FDA-approved iron supplement. This approach eliminates risks of contamination and biologic alteration of bone marrow–derived stem cells caused by ex vivo–labeling procedures and could be immediately applied in a clinical setting for in vivo tracking of bone marrow–derived stem cells in arthritic joints or other target tissues.
Advances in Knowledge.
• Bone marrow mesenchymal stem cells (MSCs) can be labeled through intravenous injection of the Food and Drug Administration (FDA)-approved iron supplement ferumoxytol; the iron content of in vivo–labeled MSCs was 2.3 times higher compared with that of ex vivo–labeled MSCs (P < .0001).
• In vivo ferumoxytol-labeled MSCs, harvested from bone marrow and transplanted into osteochondral knee defects, showed significantly shortened T2 relaxation times compared with unlabeled control cells (15.459 vs 24.423 msec, P = .0002).
• In vivo labeling eliminates safety concerns associated with ex vivo–labeling techniques that require stem cell manipulations between stem cell harvest and transplantation.
Implication for Patient Care.
• In vivo stem cell labeling with the FDA-approved iron supplement ferumoxytol eliminates safety concerns associated with ex vivo–labeling procedures, such as contamination and biological alteration of MSCs.
Disclosures of Conflicts of Interest: A.K. No relevant conflicts of interest to disclose. F.C. No relevant conflicts of interest to disclose. G.B. No relevant conflicts of interest to disclose. O.D.L. No relevant conflicts of interest to disclose. J.D. No relevant conflicts of interest to disclose. H.N. No relevant conflicts of interest to disclose. S.M. No relevant conflicts of interest to disclose. N.D. No relevant conflicts of interest to disclose. R.C.F.C. No relevant conflicts of interest to disclose. A.G. No relevant conflicts of interest to disclose. B.S. No relevant conflicts of interest to disclose. D.M.M. No relevant conflicts of interest to disclose. P.J.K. No relevant conflicts of interest to disclose. G.A.T. No relevant conflicts of interest to disclose. J.R. No relevant conflicts of interest to disclose. H.E.D. Financial activities related to the present article: none to disclose. Financial activities not related to the present article: none to disclose. Other relationships: filed for provisional patent on this work, no. 61/663681, on June 25, 2012.
Supplementary Material
Acknowledgments
We thank the Imaging Core at Stanford for providing access to the small-animal 7-T MR imaging unit and assistance with MR imaging experiments. We thank Sandeep Gupta, PhD, from GE Global Research (Niskayuna, NY) for providing Cinetool postprocessing software for this project. We thank Christopher Klenk, MD, and Christopher Dove, BS, from Department of Radiology and Molecular Imaging Program at Stanford, Stanford University School of Medicine (Stanford, Calif) for editing the manuscript.
Received April 10, 2013; revision requested April 26; final revision received May 13; final version accepted May 29.
Funding: This research was supported by the National Institutes of Health (grants 2R01AR054458-05 and R21CA138353A2) and by the NCI Center for Cancer Nanotechnology Excellence (grants CCNE U54 CA119367 and CCNE U54 CA151459).
See also Science to Practice in this issue.
Abbreviations:
- FDA
- Food and Drug Administration
- FITC
- fluorescein isothiocyanate
- MSC
- mesenchymal stem cell
- 3D
- three-dimensional
References
- 1.Total number of discharges for knee arthoplastly in 2010 in US. http://hcupnet.ahrq.gov/HCUPnet.jsp. Published 2010. Accessed October 16, 2012.
- 2.Brooks PM. Impact of osteoarthritis on individuals and society: how much disability? social consequences and health economic implications. Curr Opin Rheumatol 2002;14(5):573–577 [DOI] [PubMed] [Google Scholar]
- 3.Gupta S, Hawker GA, Laporte A, Croxford R, Coyte PC. The economic burden of disabling hip and knee osteoarthritis (OA) from the perspective of individuals living with this condition. Rheumatology (Oxford) 2005;44(12):1531–1537 [DOI] [PubMed] [Google Scholar]
- 4.Kurtz S, Ong K, Lau E, Mowat F, Halpern M. Projections of primary and revision hip and knee arthroplasty in the United States from 2005 to 2030. J Bone Joint Surg Am 2007;89(4):780–785 [DOI] [PubMed] [Google Scholar]
- 5.Basko-Plluska JL, Thyssen JP, Schalock PC. Cutaneous and systemic hypersensitivity reactions to metallic implants. Dermatitis 2011;22(2):65–79 [PubMed] [Google Scholar]
- 6.Gittens RA, Olivares-Navarrete R, Tannenbaum R, Boyan BD, Schwartz Z. Electrical implications of corrosion for osseointegration of titanium implants. J Dent Res 2011;90(12):1389–1397 [DOI] [PMC free article] [PubMed] [Google Scholar]
- 7.Daniel J, Ziaee H, Kamali A, Pradhan C, Band T, McMinn DJ. Ten-year results of a double-heat-treated metal-on-metal hip resurfacing. J Bone Joint Surg Br 2010;92(1):20–27 [DOI] [PubMed] [Google Scholar]
- 8.Fary C, Thomas GE, Taylor A, Beard D, Carr A, Glyn-Jones S. Diagnosing and investigating adverse reactions in metal on metal hip implants. BMJ 2011;343:d7441. [DOI] [PubMed] [Google Scholar]
- 9.Murray DW, Grammatopoulos G, Pandit H, Gundle R, Gill HS, McLardy-Smith P. The ten-year survival of the Birmingham hip resurfacing: an independent series. J Bone Joint Surg Br 2012;94(9):1180–1186 [DOI] [PubMed] [Google Scholar]
- 10.Roemer FW, Crema MD, Trattnig S, Guermazi A. Advances in imaging of osteoarthritis and cartilage. Radiology 2011;260(2):332–354 [DOI] [PubMed] [Google Scholar]
- 11.Berner A, Siebenlist S, Reichert JC, Hendrich C, Nöth U. Reconstruction of osteochondral defects with a stem cell-based cartilage-polymer construct in a small animal model [in German]. Z Orthop Unfall 2010;148(1):31–38 [DOI] [PubMed] [Google Scholar]
- 12.Henning TD, Gawande R, Khurana A, et al. Magnetic resonance imaging of ferumoxide-labeled mesenchymal stem cells in cartilage defects: in vitro and in vivo investigations. Mol Imaging 2012;11(3):197–209 [PMC free article] [PubMed] [Google Scholar]
- 13.Khurana A, Nejadnik H, Gawande R, et al. Intravenous ferumoxytol allows noninvasive MR imaging monitoring of macrophage migration into stem cell transplants. Radiology 2012;264(3):803–811 [DOI] [PMC free article] [PubMed] [Google Scholar]
- 14.Toh WS, Lee EH, Guo XM, et al. Cartilage repair using hyaluronan hydrogel-encapsulated human embryonic stem cell-derived chondrogenic cells. Biomaterials 2010;31(27):6968–6980 [DOI] [PubMed] [Google Scholar]
- 15.Beyer Nardi N, da Silva Meirelles L. Mesenchymal stem cells: isolation, in vitro expansion and characterization. Handbook Exp Pharmacol 2006;174(174):249–282 [PubMed] [Google Scholar]
- 16.Caplan AI. Review: mesenchymal stem cells—cell-based reconstructive therapy in orthopedics. Tissue Eng 2005;11(7-8):1198–1211 [DOI] [PubMed] [Google Scholar]
- 17.Osugi M, Katagiri W, Yoshimi R, Inukai T, Hibi H, Ueda M. Conditioned media from mesenchymal stem cells enhanced bone regeneration in rat calvarial bone defects. Tissue Eng Part A 2012;18(13-14):1479–1489 [DOI] [PMC free article] [PubMed] [Google Scholar]
- 18.Cao J, Wang YN, Shi XL, et al. In vivo and in vitro imaging tracing of dual-labeled bone mesenchymal stem cells transplanted into myocardium of F344 rats. Zhongguo Yi Xue Ke Xue Yuan Xue Bao 2012;34(5):474–479 [DOI] [PubMed] [Google Scholar]
- 19.Drey F, Choi YH, Neef K, et al. Noninvasive in vivo tracking of mesenchymal stem cells and evaluation of cell therapeutic effects in a murine model using a clinical 3.0 T MRI [abstr]. Cell Transplant http://www.ncbi.nlm.nih.gov/pubmed/23050950. Published October 8, 2012. Accessed April 3, 2013 [DOI] [PubMed] [Google Scholar]
- 20.Kraitchman DL, Bulte JW. Imaging of stem cells using MRI. Basic Res Cardiol 2008;103(2):105–113 [DOI] [PMC free article] [PubMed] [Google Scholar]
- 21.Lalande C, Miraux S, Derkaoui SM, et al. Magnetic resonance imaging tracking of human adipose derived stromal cells within three-dimensional scaffolds for bone tissue engineering. Eur Cell Mater 2011;21:341–354 [DOI] [PubMed] [Google Scholar]
- 22.Lin Y, Tang W, Wu L, et al. Bone regeneration by BMP-2 enhanced adipose stem cells loading on alginate gel. Histochem Cell Biol 2008;129(2):203–210 [DOI] [PubMed] [Google Scholar]
- 23.Sun JH, Zhang YL, Qian SP, et al. Assessment of biological characteristics of mesenchymal stem cells labeled with superparamagnetic iron oxide particles in vitro. Mol Med Rep 2012;5(2):317–320 [DOI] [PubMed] [Google Scholar]
- 24.U.S. Food and Drug Administration Inspection of human cells, tissues, and cellular and tissue-based products HCT/Ps. Silver Spring, Md: U.S. Food and Drug Administration, 2012 [Google Scholar]
- 25.Kuroda T, Yasuda S, Sato Y. Tumorigenicity studies for human pluripotent stem cell-derived products. Biol Pharm Bull 2013;36(2):189–192 [DOI] [PubMed] [Google Scholar]
- 26.Motaln H, Schichor C, Lah TT. Human mesenchymal stem cells and their use in cell-based therapies. Cancer 2010;116(11):2519–2530 [DOI] [PubMed] [Google Scholar]
- 27.Soenen SJ, De Cuyper M. Assessing cytotoxicity of (iron oxide-based) nanoparticles: an overview of different methods exemplified with cationic magnetoliposomes. Contrast Media Mol Imaging 2009;4(5):207–219 [DOI] [PubMed] [Google Scholar]
- 28.Arbab AS, Yocum GT, Wilson LB, et al. Comparison of transfection agents in forming complexes with ferumoxides, cell labeling efficiency, and cellular viability. Mol Imaging 2004;3(1):24–32 [DOI] [PubMed] [Google Scholar]
- 29.Kostura L, Kraitchman DL, Mackay AM, Pittenger MF, Bulte JW. Feridex labeling of mesenchymal stem cells inhibits chondrogenesis but not adipogenesis or osteogenesis. NMR Biomed 2004;17(7):513–517 [DOI] [PubMed] [Google Scholar]
- 30.Sykova E, Jendelova P. In vivo tracking of stem cells in brain and spinal cord injury. Prog Brain Res 2007;161:367–383 [DOI] [PubMed] [Google Scholar]
- 31.Mailänder V, Lorenz MR, Holzapfel V, et al. Carboxylated superparamagnetic iron oxide particles label cells intracellularly without transfection agents. Mol Imaging Biol 2008;10(3):138–146 [DOI] [PubMed] [Google Scholar]
- 32.Wilhelm C, Gazeau F. Universal cell labelling with anionic magnetic nanoparticles. Biomaterials 2008;29(22):3161–3174 [DOI] [PubMed] [Google Scholar]
- 33.Schäfer R, Kehlbach R, Wiskirchen J, et al. Transferrin receptor upregulation: in vitro labeling of rat mesenchymal stem cells with superparamagnetic iron oxide. Radiology 2007;244(2):514–523 [DOI] [PubMed] [Google Scholar]
- 34.Neuwelt EA, Hamilton BE, Varallyay CG, et al. Ultrasmall superparamagnetic iron oxides (USPIOs): a future alternative magnetic resonance (MR) contrast agent for patients at risk for nephrogenic systemic fibrosis (NSF)? Kidney Int 2009;75(5):465–474 [DOI] [PMC free article] [PubMed] [Google Scholar]
- 35.Daldrup-Link HE, Golovko D, Ruffell B, et al. MRI of tumor-associated macrophages with clinically applicable iron oxide nanoparticles. Clin Cancer Res 2011;17(17):5695–5704 [DOI] [PMC free article] [PubMed] [Google Scholar]
- 36.Hasan DM, Mahaney KB, Magnotta VA, et al. Macrophage imaging within human cerebral aneurysms wall using ferumoxytol-enhanced MRI: a pilot study. Arterioscler Thromb Vasc Biol 2012;32(4):1032–1038 [DOI] [PMC free article] [PubMed] [Google Scholar]
- 37.Ferumoxides LeungK. In: Molecular imaging and contrast agent database (MICAD) [Internet]. Bethesda, Md: U.S. National Center for Biotechnology Information, 2004–2013. http://www.ncbi.nlm.nih.gov/books/NBK23037/. Accessed April 3, 2013 [PubMed] [Google Scholar]
- 38.Metz S, Lohr S, Settles M, et al. Ferumoxtran-10-enhanced MR imaging of the bone marrow before and after conditioning therapy in patients with non-Hodgkin lymphomas. Eur Radiol 2006;16(3):598–607 [DOI] [PubMed] [Google Scholar]
- 39.Trivedi RA, U-King-Im JM, Graves MJ, et al. In vivo detection of macrophages in human carotid atheroma: temporal dependence of ultrasmall superparamagnetic particles of iron oxide-enhanced MRI. Stroke 2004;35(7):1631–1635 [DOI] [PubMed] [Google Scholar]
- 40.Hamilton BE, Nesbit GM, Dosa E, et al. Comparative analysis of ferumoxytol and gadoteridol enhancement using T1- and T2-weighted MRI in neuroimaging. AJR Am J Roentgenol 2011;197(4):981–988 [DOI] [PMC free article] [PubMed] [Google Scholar]
- 41.Hasan DM, Amans M, Tihan T, et al. Ferumoxytol-enhanced MRI to image inflammation within human brain arteriovenous malformations: a pilot investigation. Transl Stroke Res 2012;3(suppl 1):166–173 [DOI] [PMC free article] [PubMed] [Google Scholar]
- 42.Simon GH, von Vopelius-Feldt J, Fu Y, et al. Ultrasmall supraparamagnetic iron oxide-enhanced magnetic resonance imaging of antigen-induced arthritis: a comparative study between SHU 555 C, ferumoxtran-10, and ferumoxytol. Invest Radiol 2006;41(1):45–51 [DOI] [PubMed] [Google Scholar]
- 43.Simon GH, Raatschen HJ, Wendland MF, et al. Ultrasmall superparamagnetic iron-oxide-enhanced MR imaging of normal bone marrow in rodents: original research original research. Acad Radiol 2005;12(9):1190–1197 [DOI] [PubMed] [Google Scholar]
- 44.Wang J, Chen Y, Chen B, et al. Pharmacokinetic parameters and tissue distribution of magnetic Fe(3)O(4) nanoparticles in mice. Int J Nanomedicine 2010;5:861–866 [DOI] [PMC free article] [PubMed] [Google Scholar]
- 45.Li X, Zhang Y, Qi G. Evaluation of isolation methods and culture conditions for rat bone marrow mesenchymal stem cells. Cytotechnology 2013;65(3):323–334 [DOI] [PMC free article] [PubMed] [Google Scholar]
- 46.Rouger K, Fornasari B, Armengol V, et al. Progenitor cell isolation from muscle-derived cells based on adhesion properties. J Histochem Cytochem 2007;55(6):607–618 [DOI] [PubMed] [Google Scholar]
- 47.Castaneda RT, Khurana A, Khan R, Daldrup-Link HE. Labeling stem cells with ferumoxytol, an FDA-approved iron oxide nanoparticle [abstr]. J Vis Exp 2011 Nov 4;(57):e3482 [DOI] [PMC free article] [PubMed] [Google Scholar]
- 48.Inai T, Mancuso M, Hashizume H, et al. Inhibition of vascular endothelial growth factor (VEGF) signaling in cancer causes loss of endothelial fenestrations, regression of tumor vessels, and appearance of basement membrane ghosts. Am J Pathol 2004;165(1):35–52 [DOI] [PMC free article] [PubMed] [Google Scholar]
- 49.Kircher MF, de la Zerda A, Jokerst JV, et al. A brain tumor molecular imaging strategy using a new triple-modality MRI-photoacoustic-Raman nanoparticle. Nat Med 2012;18(5):829–834 [DOI] [PMC free article] [PubMed] [Google Scholar]
- 50.Henning TD, Sutton EJ, Kim A, et al. The influence of ferucarbotran on the chondrogenesis of human mesenchymal stem cells. Contrast Media Mol Imaging 2009;4(4):165–173 [DOI] [PMC free article] [PubMed] [Google Scholar]
- 51.Baker BM, Chen CS. Deconstructing the third dimension: how 3D culture microenvironments alter cellular cues. J Cell Sci 2012;125(pt 13):3015–3024 [DOI] [PMC free article] [PubMed] [Google Scholar]
- 52.Kode JA, Mukherjee S, Joglekar MV, Hardikar AA. Mesenchymal stem cells: immunobiology and role in immunomodulation and tissue regeneration. Cytotherapy 2009;11(4):377–391 [DOI] [PubMed] [Google Scholar]
- 53.Adult stem cell therapy for repairing articular cartilage in gonarthrosis http://clinicaltrials.gov/ct2/show/NCT01227694. Published October 22, 2010. Updated July 22, 2011. Accessed October 16, 2012.
- 54.Coyne DW. Ferumoxytol for treatment of iron deficiency anemia in patients with chronic kidney disease. Expert Opin Pharmacother 2009;10(15):2563–2568 [DOI] [PubMed] [Google Scholar]
- 55.Schwenk MH. Ferumoxytol: a new intravenous iron preparation for the treatment of iron deficiency anemia in patients with chronic kidney disease. Pharmacotherapy 2010;30(1):70–79 [DOI] [PubMed] [Google Scholar]
- 56.Singh A, Patel T, Hertel J, Bernardo M, Kausz A, Brenner L. Safety of ferumoxytol in patients with anemia and CKD. Am J Kidney Dis 2008;52(5):907–915 [DOI] [PubMed] [Google Scholar]
- 57.Spinowitz BS, Schwenk MH, Jacobs PM, et al. The safety and efficacy of ferumoxytol therapy in anemic chronic kidney disease patients. Kidney Int 2005;68(4):1801–1807 [DOI] [PubMed] [Google Scholar]
- 58.Ma X, de Bruijn M, Robin C, et al. Expression of the Ly-6A (Sca-1) lacZ transgene in mouse haematopoietic stem cells and embryos. Br J Haematol 2002;116(2):401–408 [DOI] [PubMed] [Google Scholar]
- 59.Ozdemir M, Attar A, Kuzu I, et al. Stem cell therapy in spinal cord injury: in vivo and postmortem tracking of bone marrow mononuclear or mesenchymal stem cells. Stem Cell Rev 2012;8(3):953–962 [DOI] [PubMed] [Google Scholar]
- 60.Srinivas M, Aarntzen EH, Bulte JW, et al. Imaging of cellular therapies. Adv Drug Deliv Rev 2010;62(11):1080–1093 [DOI] [PubMed] [Google Scholar]
- 61.Chung E, Nam SY, Ricles LM, Emelianov SY, Suggs LJ. Evaluation of gold nanotracers to track adipose-derived stem cells in a PEGylated fibrin gel for dermal tissue engineering applications. Int J Nanomedicine 2013;8:325–336 [DOI] [PMC free article] [PubMed] [Google Scholar]
- 62.Guenoun J, Ruggiero A, Doeswijk G, et al. In vivo quantitative assessment of cell viability of gadolinium or iron-labeled cells using MRI and bioluminescence imaging. Contrast Media Mol Imaging 2013;8(2):165–174 [DOI] [PubMed] [Google Scholar]
- 63.Templin C, Zweigerdt R, Schwanke K, et al. Transplantation and tracking of human-induced pluripotent stem cells in a pig model of myocardial infarction: assessment of cell survival, engraftment, and distribution by hybrid single photon emission computed tomography/computed tomography of sodium iodide symporter transgene expression. Circulation 2012;126(4):430–439 [DOI] [PubMed] [Google Scholar]
- 64.Loeuille D, Chary-Valckenaere I. MRI in OA: from cartilage to bone marrow lesion. Osteoporos Int 2012;23(suppl 8):S867–S869 [DOI] [PubMed] [Google Scholar]
- 65.Shen Y, Shao Y, He H, et al. Gadolinium(3+)-doped mesoporous silica nanoparticles as a potential magnetic resonance tracer for monitoring the migration of stem cells in vivo. Int J Nanomedicine 2013;8:119–127 [DOI] [PMC free article] [PubMed] [Google Scholar]
- 66.Guenoun J, Koning GA, Doeswijk G, et al. Cationic Gd-DTPA liposomes for highly efficient labeling of mesenchymal stem cells and cell tracking with MRI. Cell Transplant 2012;21(1):191–205 [DOI] [PubMed] [Google Scholar]
- 67.Nejadnik H, Henning TD, Do T, et al. MR imaging features of gadofluorine-labeled matrix-associated stem cell implants in cartilage defects. PLoS ONE 2012;7(12):e49971. [DOI] [PMC free article] [PubMed] [Google Scholar]
- 68.Khurana A, Nejadnik H, Chapelin F, et al. Ferumoxytol: a new, clinically applicable label for stem-cell tracking in arthritic joints with MRI [abstr]. Nanomedicine (Lond)http://www.ncbi.nlm.nih.gov/pubmed/?term=23534832. Published March 27, 2013. Accessed March 28, 2013 [DOI] [PMC free article] [PubMed]
- 69.Nedopil A, Klenk C, Kim C, et al. MR signal characteristics of viable and apoptotic human mesenchymal stem cells in matrix-associated stem cell implants for treatment of osteoarthritis. Invest Radiol 2010;45(10):634–640 [DOI] [PMC free article] [PubMed] [Google Scholar]
- 70.Zhu J, Zhou L, XingWu F. Tracking neural stem cells in patients with brain trauma. N Engl J Med 2006;355(22):2376–2378 [DOI] [PubMed] [Google Scholar]
- 71.Callera F, de Melo CM. Magnetic resonance tracking of magnetically labeled autologous bone marrow CD34+ cells transplanted into the spinal cord via lumbar puncture technique in patients with chronic spinal cord injury: CD34+ cells’ migration into the injured site. Stem Cells Dev 2007;16(3):461–466 [DOI] [PubMed] [Google Scholar]
- 72.de Vries IJ, Lesterhuis WJ, Barentsz JO, et al. Magnetic resonance tracking of dendritic cells in melanoma patients for monitoring of cellular therapy. Nat Biotechnol 2005;23(11):1407–1413 [DOI] [PubMed] [Google Scholar]
- 73.Toso C, Vallee JP, Morel P, et al. Clinical magnetic resonance imaging of pancreatic islet grafts after iron nanoparticle labeling. Am J Transplant 2008;8(3):701–706 [DOI] [PubMed] [Google Scholar]
- 74.Bulte JW. In vivo MRI cell tracking: clinical studies. AJR Am J Roentgenol 2009;193(2):314–325 [DOI] [PMC free article] [PubMed] [Google Scholar]
- 75.Richards JM, Shaw CA, Lang NN, et al. In vivo mononuclear cell tracking using superparamagnetic particles of iron oxide: feasibility and safety in humans. Circ Cardiovasc Imaging 2012;5(4):509–517 [DOI] [PubMed] [Google Scholar]
- 76.Thu MS, Bryant LH, Coppola T, et al. Self-assembling nanocomplexes by combining ferumoxytol, heparin and protamine for cell tracking by magnetic resonance imaging. Nat Med 2012;18(3):463–467 [DOI] [PMC free article] [PubMed] [Google Scholar]
- 77.Brown CC, Balian G. Effect of heparin on synthesis of short chain collagen by chondrocytes and smooth muscle cells. J Cell Biol 1987;105(2):1007–1012 [DOI] [PMC free article] [PubMed] [Google Scholar]
- 78.Roosendaal G, Vianen ME, van den Berg HM, Lafeber FP, Bijlsma JW. Cartilage damage as a result of hemarthrosis in a human in vitro model. J Rheumatol 1997;24(7):1350–1354 [PubMed] [Google Scholar]
- 79.Arbab AS, Janic B, Haller J, Pawelczyk E, Liu W, Frank JA. In vivo cellular imaging for translational medical research. Curr Med Imaging Rev 2009;5(1):19–38 [DOI] [PMC free article] [PubMed] [Google Scholar]
- 80.Nejadnik H, Henning TD, Castaneda RT, et al. Somatic differentiation and MR imaging of magnetically labeled human embryonic stem cells. Cell Transplant 2012;21(12):2555–2567 [DOI] [PubMed] [Google Scholar]
- 81.Henning TD, Wendland MF, Golovko D, et al. Relaxation effects of ferucarbotran-labeled mesenchymal stem cells at 1.5T and 3T: discrimination of viable from lysed cells. Magn Reson Med 2009;62(2):325–332 [DOI] [PMC free article] [PubMed] [Google Scholar]
- 82.Bhat S, Tripathi A, Kumar A. Supermacroprous chitosan-agarose-gelatin cryogels: in vitro characterization and in vivo assessment for cartilage tissue engineering. J R Soc Interface 2011;8(57):540–554 [DOI] [PMC free article] [PubMed] [Google Scholar]
- 83.Xu H, Othman SF, Magin RL. Monitoring tissue engineering using magnetic resonance imaging. J Biosci Bioeng 2008;106(6):515–527 [DOI] [PubMed] [Google Scholar]
- 84.Daldrup-Link HE, Rummeny EJ, Ihssen B, Kienast J, Link TM. Iron-oxide-enhanced MR imaging of bone marrow in patients with non-Hodgkin’s lymphoma: differentiation between tumor infiltration and hypercellular bone marrow. Eur Radiol 2002;12(6):1557–1566 [DOI] [PubMed] [Google Scholar]
- 85.Usman AA, Taimen K, Wasielewski M, et al. Cardiac magnetic resonance T2 mapping in the monitoring and follow-up of acute cardiac transplant rejection: a pilot study. Circ Cardiovasc Imaging 2012;5(6):782–790 [DOI] [PubMed] [Google Scholar]
- 86.Centeno CJ, Busse D, Kisiday J, Keohan C, Freeman M, Karli D. Regeneration of meniscus cartilage in a knee treated with percutaneously implanted autologous mesenchymal stem cells. Med Hypotheses 2008;71(6):900–908 [DOI] [PubMed] [Google Scholar]
- 87.Orozco L, Soler R, Morera C, Alberca M, Sánchez A, García-Sancho J. Intervertebral disc repair by autologous mesenchymal bone marrow cells: a pilot study. Transplantation 2011;92(7):822–828 [DOI] [PubMed] [Google Scholar]
- 88.Wakitani S, Imoto K, Yamamoto T, Saito M, Murata N, Yoneda M. Human autologous culture expanded bone marrow mesenchymal cell transplantation for repair of cartilage defects in osteoarthritic knees. Osteoarthritis Cartilage 2002;10(3):199–206 [DOI] [PubMed] [Google Scholar]
- 89.Beitzel K, McCarthy MB, Cote MP, et al. Rapid isolation of human stem cells (connective progenitor cells) from the distal femur during arthroscopic knee surgery. Arthroscopy 2012;28(1):74–84 [DOI] [PubMed] [Google Scholar]
- 90.Spahr L, Chalandon Y, Terraz S, et al. Autologous bone marrow mononuclear cell transplantation in patients with decompensated alcoholic liver disease: a randomized controlled trial. PLoS ONE 2013;8(1):e53719. [DOI] [PMC free article] [PubMed] [Google Scholar]
- 91.Lu M, Cohen MH, Rieves D, Pazdur R. FDA report: ferumoxytol for intravenous iron therapy in adult patients with chronic kidney disease. Am J Hematol 2010;85(5):315–319 [DOI] [PubMed] [Google Scholar]
- 92.Karussis D, Karageorgiou C, Vaknin-Dembinsky A, et al. Safety and immunological effects of mesenchymal stem cell transplantation in patients with multiple sclerosis and amyotrophic lateral sclerosis. Arch Neurol 2010;67(10):1187–1194 [DOI] [PMC free article] [PubMed] [Google Scholar]
Associated Data
This section collects any data citations, data availability statements, or supplementary materials included in this article.