

The MR measures of maximal cross-sectional area, contractile area, T2, and lipid fraction were highly reproducible in boys with Duchenne muscular dystrophy (DMD) and control subjects and therefore show the feasibility of using multiple vendor systems and radiofrequency coil configurations in a multicenter study to examine involvement of the skeletal muscles of boys with DMD.
Abstract
Purpose:
To validate a multicenter protocol that examines lower extremity skeletal muscles of children with Duchenne muscular dystrophy (DMD) by using magnetic resonance (MR) imaging and MR spectroscopy in terms of reproducibility of these measurements within and across centers.
Materials and Methods:
This HIPAA-compliant study was approved by the institutional review boards of all participating centers, and informed consent was obtained from each participant or a guardian. Standardized procedures with MR operator training and quality assurance assessments were implemented, and data were acquired at three centers by using different 3-T MR imaging instruments. Measures of maximal cross-sectional area (CSAmax), transverse relaxation time constant (T2), and lipid fraction were compared among centers in two-compartment coaxial phantoms and in two unaffected adult subjects who visited each center. Also, repeat MR measures were acquired twice on separate days in 30 boys with DMD (10 per center) and 10 unaffected boys. Coefficients of variation (CVs) were computed to examine the repeated-measure variabilities within and across centers.
Results:
CSAmax, T2 from MR imaging and MR spectroscopy, and lipid fraction were consistent across centers in the phantom (CV, <3%) and in the adult subjects who traveled to each site (CV, 2%–7%). High day-to-day reproducibility in MR measures was observed in boys with DMD (CSAmax, CV = 3.7% [25th percentile, 1.3%; 75th percentile, 5.1%]; contractile area, CV = 4.2% [25th percentile, 0.8%; 75th percentile, 4.9%]; MR imaging T2, CV = 3.1% [25th percentile, 1.2%; 75th percentile, 4.7%]; MR spectroscopy T2, CV = 3.9% [25th percentile, 1.5%; 75th percentile, 5.1%]; and lipid fraction, CV = 4.7% [25th percentile, 1.0%; 75th percentile, 5.3%]).
Conclusion:
The MR protocol implemented in this multicenter study achieved highly reproducible measures of lower extremity muscles across centers and from day to day in ambulatory boys with DMD.
© RSNA, 2013
Supplemental material: http://radiology.rsna.org/lookup/suppl/doi:10.1148/radiol.13121948/-/DC1
Introduction
Duchenne muscular dystrophy (DMD) is an X-linked recessive disorder that is due to a mutation in the dystrophin gene (1). DMD has an incidence of one in 3600–6000 male births and is characterized by progressive muscle deterioration, loss of functional abilities, and reduced life expectancy (2). Structural and compositional changes in skeletal muscle with disease progression of DMD include altered cross-sectional area (3); increased susceptibility to muscle damage, inflammation, and edema (4); fatty tissue infiltration (5); and fibrosis (6).
To date, treatments have shown limited effectiveness, and currently there is no cure for DMD. However, there are a number of interventions that have shown promise in preclinical and early clinical trials, including viral delivery of microdystrophin genes (7), exon skipping (8), and small-molecule therapies such as ataluren (9). As a result, there is a pressing need for sensitive and reliable biomarkers to track disease progression and provide a surrogate means to evaluate the efficacy of therapeutic interventions in clinical trials. Owing to the relatively low prevalence of children with DMD, these studies require that data be acquired at multiple centers.
Magnetic resonance (MR) imaging and MR spectroscopy data collection across multiple centers, utilizing different clinical MR system vendors and radiofrequency coil configurations, presents substantial logistic challenges because of a number of possible confounding factors, including interoperator variability (eg, spatial selection variability in section group or voxel position), systemic bias due to differences in hardware configurations, and variations in manufacturer pulse sequences (10). To minimize the impact of these differences within and across centers, certain precautions and procedures can be implemented. These include developing standardized methods for setting up subjects, muscle selection, and matching key acquisition parameters (10,11). Therefore, the goal of this study was to evaluate the variability of MR imaging and MR spectroscopy measurements across multiple centers and from day to day within centers in skeletal muscles of boys with DMD and control boys.
Materials and Methods
The study was approved by the institutional review boards at the University of Florida (center 1), Oregon Health and Science University (center 2), and Children’s Hospital of Philadelphia (center 3). The study was in compliance with the Health Insurance Portability and Accountability Act, and informed written consent was obtained from each subject or a guardian prior to participation in the study.
Participants
Two healthy adult male subjects (ages, 35 and 42 years), 30 boys with DMD (mean age, 8.5 years ± 2.1 [standard deviation]; range, 5–14 years), and 10 unaffected control boys (mean age, 9.2 years ± 2.1; range, 5–13 years) were recruited to participate in this study (Table 1). The boys with DMD (10 per center) were ambulatory; some were receiving glucocorticosteroids and some had never received glucocorticosteroids. The control boys (five at center 1, three at center 2, and two at center 3) were similar (P > .05) in age to the boys with DMD. All participants were asked to avoid any excessive physical activity beyond their normal levels for 3 days prior to the study.
Table 1.
Demographic Data in Unaffected Control Boys and Boys with DMD
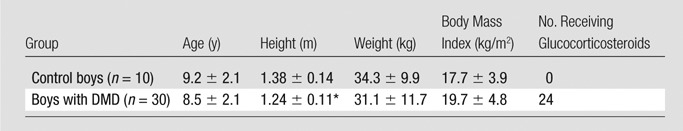
Note.—Unless otherwise specified, data are means ± standard deviations.
Significantly different (P ≤ .05) between boys with DMD and control subjects.
Training of MR Operators
MR data were acquired by using a 3-T Achieva Quasar Dual imaging unit (Philips, Best, the Netherlands) at center 1, a 3-T Magnetom TIM Trio imaging unit (Siemens, Erlangen, Germany) at center 2, and a 3-T Magnetom Verio imaging unit (Siemens) at center 3. To help ensure MR data were acquired in a consistent manner across centers, an MR standardized operating procedures manual was established, with both general and center-specific procedures documented. In addition, an MR training video was created to demonstrate subject preparation and study planning. It included a precise description of MR imaging section group and MR spectroscopy voxel positioning. Also, a series of training data sets were created and distributed to enable practice in voxel placement in the soleus and vastus lateralis (VL) muscles. Furthermore, training sessions were offered at collective meetings, and center visits were performed prior to commencement of the study. Finally, automated data-processing streams (eg, spectroscopic analysis requiring no user intervention) were established to support biweekly Internet conferencing in which images and spectra were reviewed and each center was provided with timely feedback regarding quality assessment using a standardized form with specific criteria.
Phantom Studies
Initial comparisons across centers were performed by using two-compartment coaxial phantoms (Fig E1 [online]; see Appendix E1 [online] for phantom details). Three phantoms were produced at center 1 and were distributed to the other centers. The phantoms were imaged at center 1 to measure variability among the phantoms at a single center; then, phantom data were acquired at each center on 2 separate days separated by 3 weeks, and measurements were compared across sites.
Preparation of Participants and Acquisition of MR Data
MR measurements of the right leg were obtained in two adult male subjects who visited each site, in 30 boys with DMD, and in 10 control boys. The subjects were placed in a supine feet-first position in the bore of the magnet, with the leg secured by using foam padding and weighted bags. Radiofrequency coil configurations differed between centers. An eight-channel sensitivity encoding volume receive-only knee coil (Invivo [Gainesville, Fla], centers 1 and 3) or a transmit-receive quadrature extremity coil (center 2) was used for the lower leg. A two-channel surface coil (FLEX; Invivo [center 1]), a body matrix array coil (center 3), or a transmit-receive quadrature extremity coil (center 2) was used for the thigh. A radiofrequency-shielded blanket (Accusorb RF shielding; Millimeter Wave Technologies, Passaic, NJ) was wrapped around the left leg to reduce signal contamination and allow reduced–field of view acquisitions. To improve participant compliance, a staff member and a parent were present during imaging in the MR suite, and a movie was shown during the examination (total imaging time, 75–90 minutes). The subjects were briefly removed from the magnet (typically, for 5–10 minutes) for repositioning between the lower leg and thigh acquisitions.
The lower extremity skeletal muscles were evaluated by using T1-weighted three-dimensional gradient-echo images with spectral presaturation by inversion recovery and without fat suppression (acquisition parameters are given in Table 2). The section packet was aligned along the length of the tibia, covered approximately the proximal half of the lower leg, and was centered at the largest girth of the lower leg in the head-to-foot direction. For the thigh, the section packet was placed from the knee to approximately the proximal quarter of the thigh, which includes the maximal cross-sectional area (CSAmax) of the hamstrings and quadriceps. T2-weighted spin-echo images with spectral attenuated inversion recovery and without fat suppression were acquired in the lower leg and thigh, with the refocusing pulse width set at 1.5 times the excitation pulse width on all imaging units (Table 2). Single-voxel 1H MR spectroscopy was performed for assessment of muscle composition by using STEAM (12,13) in the soleus and VL (Table 2). Finally, proton spectroscopic relaxometry was performed by using STEAM in the soleus and VL (Table 2). In addition to the MR studies, body weight and height were measured, and any deviations from the MR protocol were recorded.
Table 2.
MR Acquisition Parameters for Lower Leg and Thigh Studies across Centers

Note.—MR spectroscopy was performed with hydrogen 1 (1H). NA = not applicable, SPAIR = spectral attenuated inversion recovery, SPIR = spectral presaturation with inversion recovery, STEAM = stimulated-echo acquisition mode.
MR Analysis
The MR data, as well as details of acquisition parameters, were transferred, verified, and organized at a central location using a shared infrastructure (center 1). All data analyses were performed at a single center (center 1). CSAmax, contractile area, and transverse relaxation time constant (T2) were measured for the tibialis anterior (TA) muscle, the peroneus longus (PL) and peroneus brevis (PB) muscles, the soleus muscle, the medial gastrocnemius (MG) muscle, the long head of the biceps femoris (LHBF) muscle, the semitendinosus (ST) muscle, the VL muscle, and the gracilis muscle. Each of these measurements used an average of three contiguous axial sections, and each of the image readers completed a formal training period that included comparisons of measurements being made with those of experienced users. Those directly involved in the analysis of images had between 1 year and 9 years of experience in the analysis of MR imaging studies (readers included D.J.L. [5 years], S.C.F. [9 years], and R.J.W. [2 years]). Proton MR spectroscopy measures of lipid fraction and T2 were performed for the soleus and VL by using automated processing of spectra under the direction of W.T. (with 6 years of experience) and G.A.W. (with 20 years of experience). These automatic procedures require no user intervention and thus enable rapid feedback. Lipid fraction was assessed by means of area integration of the phase-corrected spectra from the lipid (0.5–2.75 ppm) and 1H2O (4.3–5.10 ppm) regions of the spectrum with Interactive Data Language, version 8.1 (Excelis Visual Information Solutions, Boulder, Colo). The spectroscopic T2 values were derived by using the amplitude peak height of the 1H2O signal at nonlinear spaced echo times and complex principal component analysis. A detailed description of the MR analyses are provided in Appendix E1 (online).
Statistical Analysis
The coefficient of variation (CV) was computed to examine the variability between repeated measures within and across centers and between raters. Specifically, for each MR measure, CV (as a percentage) was calculated separately for each subject or phantom by dividing the standard deviation of the repeated measure by the mean of the repeated measure and multiplying the result by 100%. The mean of the CV and MR measures are reported, along with the 25th and 75th percentiles of the population of subjects measured. Also, the linear relationship between raters was quantified by using the Pearson correlation coefficient (r value). Comparisons between boys with DMD and control subjects and among centers were performed by using the Wilcoxon rank sum test (Prism, version 6.0b; GraphPad, La Jolla, Calif). P ≤ .05 was considered to indicate a significant difference.
Results
Demographic Data
Descriptive characteristics and the glucocorticoid status of the boys with DMD and the control boys are presented in Table 1. The control boys were taller (P < .01) than the boys with DMD, with no differences in mean age (P = .39), weight (P = .46), or body mass index (P = .25). MR measures were obtained in all subjects on both days of testing. In the 80 testing sessions, 74 of the MR protocols were fully completed. In the six MR sessions that were not fully completed, lack of completion was due to a technical MR problem, to limited time and scheduling conflicts, to excessive subject movement, or to a subject asking to be removed from the magnet. Overall, the subjects tolerated the procedures well, and no adverse events were identified.
Variability of MR Measures across Centers
From the phantom measurements, CVs of less than 3% among centers and less than 1% within centers were observed for CSAmax, MR imaging T2, and MR spectroscopy T2 (Table 3; Fig E1 [online]). The CVs between the different phantoms measured at a single center (center 1) were 0.2% for CSAmax, 2.8% for MR imaging T2, and 1.5% for MR spectroscopy T2. This variability was similar to that of the between-center CVs for these measures (Table 3). The phantom enabled determination of the appropriate distance of voxel placement away from the neighboring lipid compartment to avoid contamination (lipid-to-water ratio, <0.005). This was found to be 1.5 mm at center 1 and 1.3 mm at centers 2 and 3. As a result, these distances were implemented as a guide for voxel placement in the muscles of the subjects.
Table 3.
Results of Comparison of Measurements of CSAmax, MR Imaging T2, and MR Spectroscopy T2 in a Coaxial Phantom within and across Three Centers
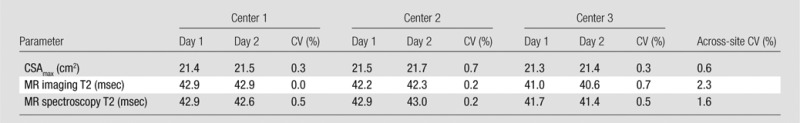
Note.—Measurements were made in the inner compartment (CuSO4) of the phantom and were acquired on 2 different days separated by 3 weeks. Temperature was similar among sites during imaging (center 1: 23.1°C; center 2: 22.2°C; center 3: 22.2°C).
Two healthy adult subjects were imaged at all three sites, and variability in CSAmax, T2 at MR imaging and MR spectroscopy, and lipid fraction at 1H MR spectroscopy was examined. All measures showed high reproducibility among sites, with CVs ranging from 0.7% to 7.2% (Table 4 Fig E2 [online]).
Table 4.
Comparison of CSAmax, MR Imaging T2 without and That with Fat Saturation, MR Spectroscopy T2, and Lipid Fraction across Three Centers in Two Unaffected Adult Subjects
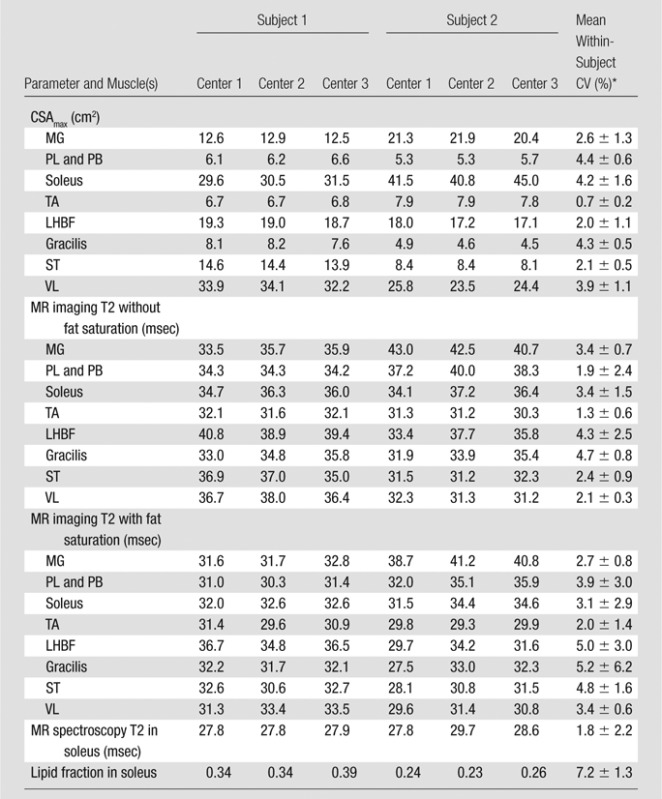
Data are means ± standard deviations.
Interrater Variability of MR Measures in DMD
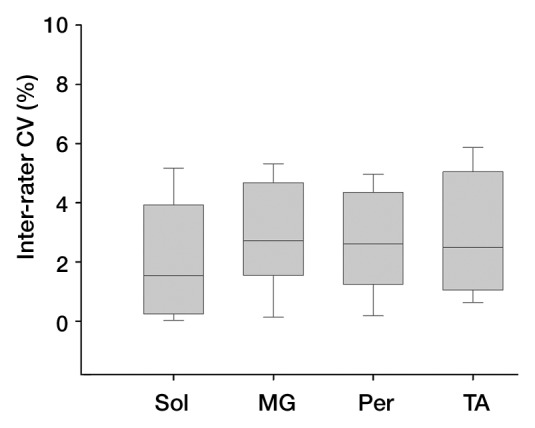
Interrater reliability was examined for each of the analysis types that involved manual tracing with potential for rater interpretation of muscle boundaries (Fig 1). The average interrater reliability (ie, CV) for CSAmax was 2.5% (25th percentile, 0.7%; 75th percentile, 3.9%), with no differences (P > .05) between lower and upper leg muscles. High reproducibility between readers was also observed for MR imaging T2 (CV, 1.2% [25th percentile, 0.7%; 75th percentile, 1.4%]) and contractile area analysis (CV, 1.2% [25th percentile, 0.5%; 75th percentile, 1.4%]).
Figure 1a:
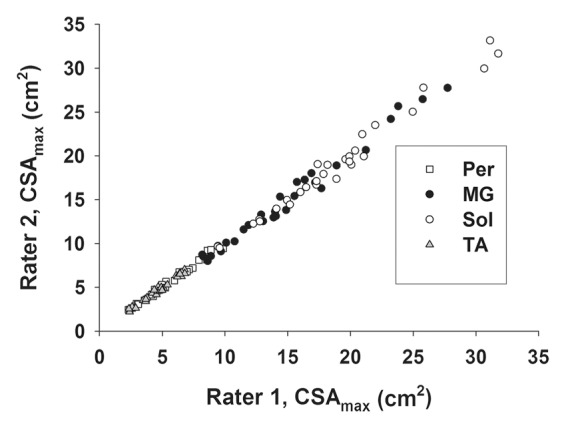
Graphs show interrater reliability of CSAmax in lower leg muscles in subjects with DMD as measured by (a) Pearson correlation (r = 0.997) and (b) CV. Per = PL and PB muscles, Sol = soleus muscle.
Figure 1b:
Graphs show interrater reliability of CSAmax in lower leg muscles in subjects with DMD as measured by (a) Pearson correlation (r = 0.997) and (b) CV. Per = PL and PB muscles, Sol = soleus muscle.
Day-to-Day Variability of MR Measures in DMD
All MR measures were found to be highly reproducible in boys with DMD and control boys (Tables 5–7; Fig 2). Collectively, in all boys (boys with DMD and control boys), the mean within-subject CV for CSAmax was 3.8% (25th percentile, 1.3%; 75th percentile, 5.1%) and ranged from 2.5% (25th percentile, 0.6%; 75th percentile, 3.6%) in the PL and PB muscles to 5.8% (25th percentile, 1.6%; 75th percentile, 7.2%) in the gracilis muscle (Table 5). Within-subject variability in boys with DMD did not differ from that in control boys in all muscles (P > .05). Likewise, measures of contractile area were also shown to be reproducible from day to day in boys with DMD and control boys (Table 5), although this measure had greater day-to-day variability in boys with DMD (CV, 4.0%) than in control boys (CV, 1.4%) in the majority of muscles (Table 5). T2 values derived by using MR imaging T2 mapping were also highly reproducible among all muscles, with CVs ranging from 1.7% (25th percentile, 0.3%; 75th percentile, 2.8%) in the PL and PB muscles to 5.1% (25th percentile, 2.3%; 75th percentile, 7.2%) in the gracilis muscle in all boys (Table 6; Fig 3). No differences in CV were observed for MR imaging T2 between boys with DMD (mean group CV, 3.0% [25th percentile, 0.9%; 75th percentile, 4.5%]) and control boys (mean group CV, 3.3% [25th percentile, 0.8%; 75th percentile, 4.9%]). Furthermore, the CVs of T2 were similar whether fat suppression was used (CV, 3.0% [25th percentile, 1.2%; 75th percentile, 3.8%]) or was not used (CV, 3.2% [25th percentile, 1.3%; 75th percentile, 4.6%]).
Table 5.
Day-to-Day Variability in CSAmax and Contractile Area in Control Boys and Boys with DMD
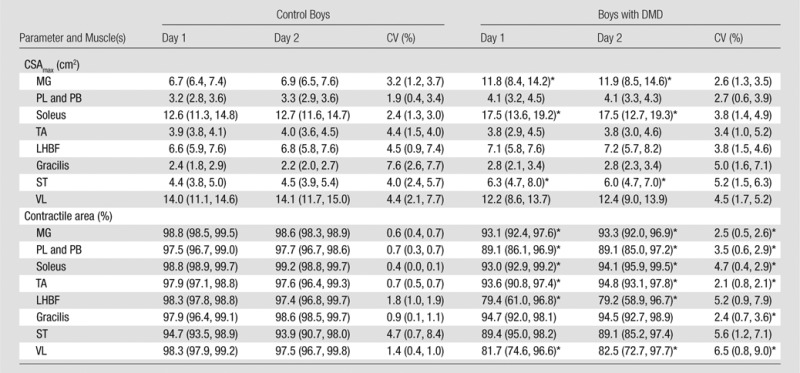
Note.—Data are means, with 25th and 75th percentiles in parentheses. Within-subject CV was calculated by dividing the standard deviation by the mean and multiplying the result by 100%.
Significantly different (P ≤ .05) between boys with DMD and control boys.
Table 7.
Day-to-Day Variability of MR Spectroscopy T2 and Lipid Fraction in the Soleus and VL Muscles of Control Boys and Boys with DMD
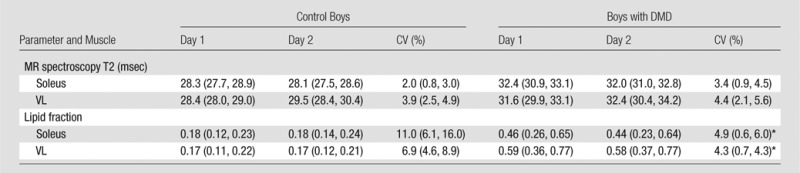
Note.—Data are means, with 25th and 75th percentiles in parentheses. All day 1 and day 2 values were significantly different (P ≤ .05) between boys with DMD and control boys.
Significantly different (P ≤ .05) between boys with DMD and control boys.
Figure 2a:
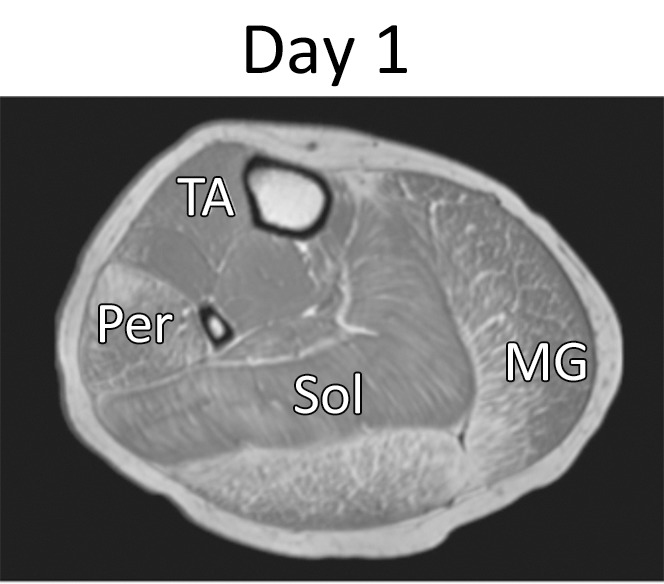
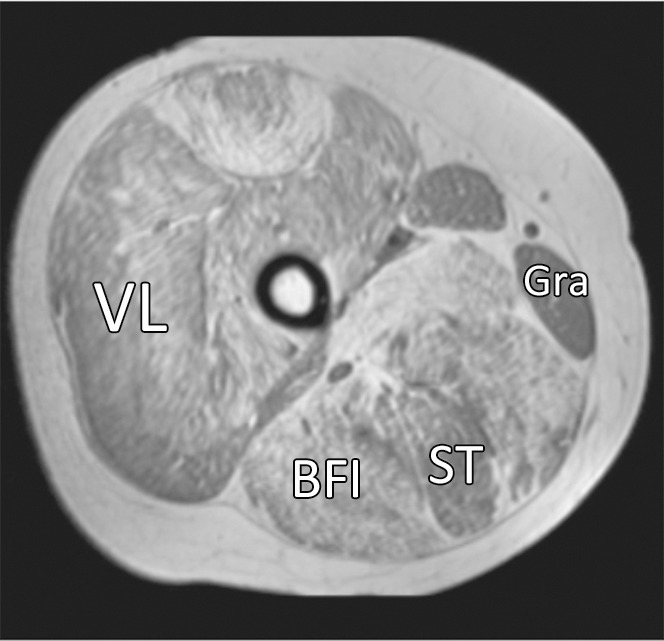
Representative gradient-echo axial MR images (lower leg: repetition time msec/echo time msec, 12/2.2; flip angle, 20°; thigh: 12/2.3; flip angle, 20°) acquired on separate days (day 1: a and c; day 2: b and d) in (a, b) lower right leg and (c, d) upper right leg in 11.6-year-old boy with DMD. MR imaging analysis of the TA, PL and PB (Per), MG, soleus (Sol), VL, LHBF (BFI), gracilis (Gra), and ST muscles was performed.
Table 6.
Day-to-Day Variability of MR Imaging T2 without and That with Fat Saturation in Control Boys and Boys with DMD

Note.—Data are means, with 25th and 75th percentiles in parentheses. All day 1 and day 2 values were significantly different (P ≤ .05) between boys with DMD and control boys.
Significantly different (P ≤ .05) between boys with DMD and control boys.
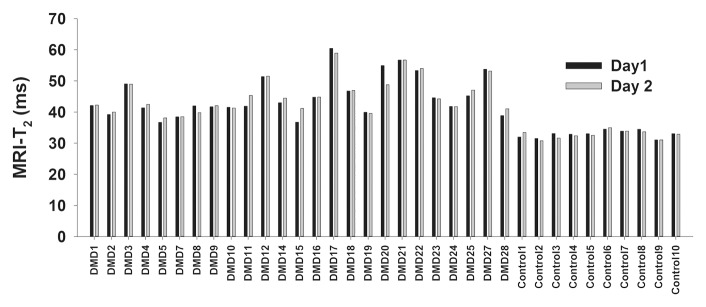
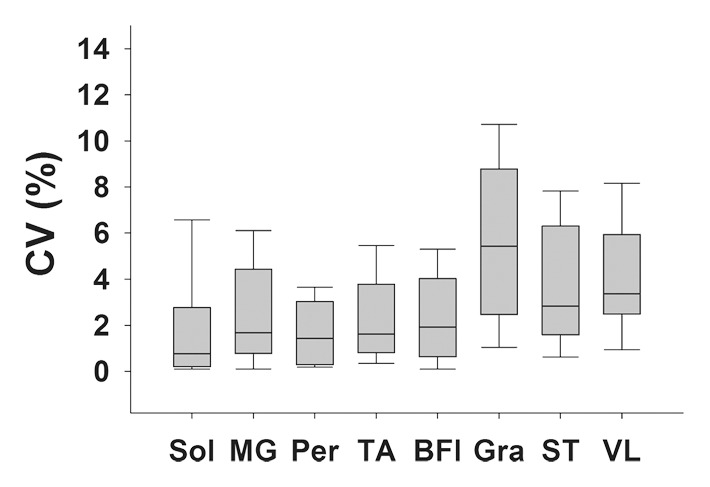
Figure 3a:
(a) Bar graph shows day-to-day variability of MR imaging T2 measures in the soleus for boys with DMD and control subjects. (b) Box plot shows median within-subject day-to-day CV and 10th, 25th, 75th, and 90th percentiles for the soleus (Sol), MG, PL and PB (Per), TA, gracilis (Gra), ST, and VL muscles in boys with DMD. (c) Box plot shows CVs of the three centers. Within-subject CV was calculated by dividing the standard deviation by the mean and multiplying the result by 100%.
Figure 2b:

Representative gradient-echo axial MR images (lower leg: repetition time msec/echo time msec, 12/2.2; flip angle, 20°; thigh: 12/2.3; flip angle, 20°) acquired on separate days (day 1: a and c; day 2: b and d) in (a, b) lower right leg and (c, d) upper right leg in 11.6-year-old boy with DMD. MR imaging analysis of the TA, PL and PB (Per), MG, soleus (Sol), VL, LHBF (BFI), gracilis (Gra), and ST muscles was performed.
Figure 2c:
Representative gradient-echo axial MR images (lower leg: repetition time msec/echo time msec, 12/2.2; flip angle, 20°; thigh: 12/2.3; flip angle, 20°) acquired on separate days (day 1: a and c; day 2: b and d) in (a, b) lower right leg and (c, d) upper right leg in 11.6-year-old boy with DMD. MR imaging analysis of the TA, PL and PB (Per), MG, soleus (Sol), VL, LHBF (BFI), gracilis (Gra), and ST muscles was performed.
Figure 2d:

Representative gradient-echo axial MR images (lower leg: repetition time msec/echo time msec, 12/2.2; flip angle, 20°; thigh: 12/2.3; flip angle, 20°) acquired on separate days (day 1: a and c; day 2: b and d) in (a, b) lower right leg and (c, d) upper right leg in 11.6-year-old boy with DMD. MR imaging analysis of the TA, PL and PB (Per), MG, soleus (Sol), VL, LHBF (BFI), gracilis (Gra), and ST muscles was performed.
Figure 3b:
(a) Bar graph shows day-to-day variability of MR imaging T2 measures in the soleus for boys with DMD and control subjects. (b) Box plot shows median within-subject day-to-day CV and 10th, 25th, 75th, and 90th percentiles for the soleus (Sol), MG, PL and PB (Per), TA, gracilis (Gra), ST, and VL muscles in boys with DMD. (c) Box plot shows CVs of the three centers. Within-subject CV was calculated by dividing the standard deviation by the mean and multiplying the result by 100%.
Figure 3c:

(a) Bar graph shows day-to-day variability of MR imaging T2 measures in the soleus for boys with DMD and control subjects. (b) Box plot shows median within-subject day-to-day CV and 10th, 25th, 75th, and 90th percentiles for the soleus (Sol), MG, PL and PB (Per), TA, gracilis (Gra), ST, and VL muscles in boys with DMD. (c) Box plot shows CVs of the three centers. Within-subject CV was calculated by dividing the standard deviation by the mean and multiplying the result by 100%.
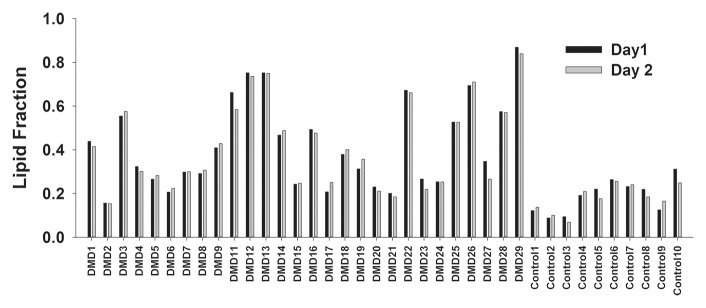
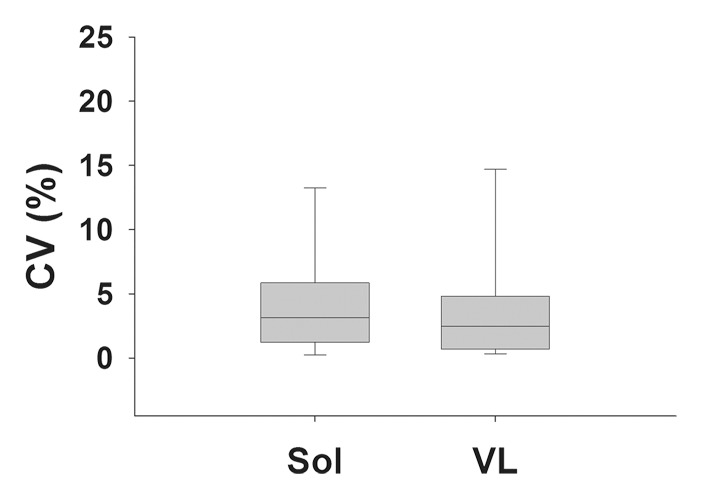
MR spectroscopy measures of skeletal muscle were also shown to be consistent from day to day (Table 7; Fig 4). T2 of 1H2O derived by using 1H MR spectroscopy was highly reproducible (CV, <5%) in the soleus and VL muscles of boys with DMD and control boys (Table 7). Also, day-to-day variability of the lipid fraction measured by using 1H MR spectroscopy was well within anticipated levels for being sensitive in the monitoring of disease progression in boys with DMD in the soleus and VL (Table 7; Fig 4). In addition, day-to-day variability of the MR measures was similar among centers (Figs 3, 4).
Figure 4a:
(a) Bar graph shows day-to-day variability of lipid fraction in the soleus in boys with DMD and control boys. (b) Box plot shows median within-subject CV with 10th, 25th, 75th, and 90th percentiles for the soleus (Sol) and VL muscles in boys with DMD. (c) Box plot shows the day-to-day CV of the three centers.
Figure 4b:
(a) Bar graph shows day-to-day variability of lipid fraction in the soleus in boys with DMD and control boys. (b) Box plot shows median within-subject CV with 10th, 25th, 75th, and 90th percentiles for the soleus (Sol) and VL muscles in boys with DMD. (c) Box plot shows the day-to-day CV of the three centers.
Figure 4c:

(a) Bar graph shows day-to-day variability of lipid fraction in the soleus in boys with DMD and control boys. (b) Box plot shows median within-subject CV with 10th, 25th, 75th, and 90th percentiles for the soleus (Sol) and VL muscles in boys with DMD. (c) Box plot shows the day-to-day CV of the three centers.
Discussion
This multicenter study evaluated the reproducibility among centers and the day-to-day variability of MR imaging and MR spectroscopy measures of skeletal muscle structure and composition in boys with DMD. The MR sequences utilized in this study included fat-suppressed and unsuppressed transaxial three-dimensional gradient-echo, spin-echo sequences and localized 1H-spectroscopy. The MR protocol was based on routine sequences readily available on clinical imaging units and provided quantitative evaluations of muscle size, contractile area, lipid fraction, and T2. All MR measures reported in this study were found to be highly reproducible across centers and were observed to have a low within-center day-to-day variability, as determined from repeated measures in boys with DMD and control boys.
CV provides a dimensionless measure of variability, enabling various tools to be compared across studies. Although quite arbitrarily, some investigators have chosen a CV of 10% or less as an acceptable level of agreement (14). The CV of the MR imaging and MR spectroscopy measures implemented in this study ranged from 3.1%–4.7% within centers for boys with DMD and 1.8%–7.2% across centers in adult subjects. While previous studies examining the reproducibility of skeletal muscle MR imaging measures across multiple centers have been limited, reproducibility within centers has been reported. For example, MR imaging measures of the size of forearm muscles were reported to have CVs of 0.8%–5.7% (15). Also, Deoni et al (16) reported a CV of 8% both within and across centers in repeated T2 measures of the brain.
The MR protocol described in this article was aimed to target structural and compositional changes expected to accompany disease progression in DMD muscle during the ambulation phase, when therapeutic trials for DMD are likely to be performed. During the development of this protocol, a number of strategies were considered and key parameters were matched across sites. For example, section profile imperfections can have a substantial effect on the amount of magnetization passaged through stimulated echo pathways and can result in elevated T2 values (17). To mitigate these effects, a ratio of refocusing to excitation pulse section thickness of 1.5 was implemented at each center in this study. T2 measurements as implemented appeared to be sensitive for detecting differences between boys with DMD and control subjects even in the more preserved muscles of DMD, such as the gracilis, ST, and TA muscles. An advantage of the gradient-echo acquisition for contractile area analysis is that it can be performed relatively quickly (60–90 seconds) with high spatial resolution and is readily available on clinical imaging units. However, it tends to be more affected by B1 inhomogeneity and requires postprocessing procedures to improve the uniformity of signal of the image, which were implemented in this study.
For the spectroscopic studies, the strategy of using a large single voxel in the belly of the muscle was utilized to provide a reasonable representation of the entire muscle and to minimize the impact of growth over time. Two 1H spectroscopy studies were acquired by using STEAM. STEAM has been reported to be more accurate for fat fraction estimates than point-resolved spectroscopy, likely because it is less affected by spin-spin coupling (18). Although single-voxel MR spectroscopy has low spatial resolution, it provides a high-confidence composition measure of relative changes in lipid in the soleus and VL muscles. This was implemented with a relatively long echo time (108 msec) to reduce macromolecular and 1H2O signals (ie, T2 filtering), to decrease baseline distortions, and to minimize spectral overlap (19). Second, a spectroscopic relaxometry sequence was implemented to quantify changes in muscle 1H2O T2. An advantage of the MR spectroscopy relaxometry method is that it provides clear discrimination between water and lipid signals and therefore can more directly measure changes in edema, inflammation, or fibrosis with high signal-to-noise ratio and independence from lipid contamination.
For the analyses of the MR images, various muscles were chosen that represent different regions and varying degrees of involvement of the lower leg and thigh. While the boys with DMD in this study displayed a range of disease progression and involvement, overall the subjects were relatively young (mean age, 8.5 years), were highly functional, and, on average, showed less involvement than previous studies in our (20) and other laboratories (21). Therefore, with older subjects, it would be anticipated that the differences between boys with DMD and control boys would be even more pronounced, particularly in the lower leg, where disease progression is slower.
Nonetheless, in both muscles that tend to be relatively preserved (eg, the TA muscle, the gracilis muscle) and those that show faster-progressing disease (eg, the LHBF muscle), reproducible values were observed in this study for all measures. To help minimize day-to-day variability, careful attention was paid to standardizing setup and procedures, and several strategies were used to minimize movement and motion artifacts, such as the use of padding and weighted bags, in-magnet video display, and having a guardian and a well-trained staff member in the MR suite. Studies were typically re-performed when motion was observed during imaging. In addition, acquisition and postprocessing strategies were implemented to reduce the effects of movement. For example, MR spectra were acquired dynamically, and individual spectra outliers (>2.3 standard deviations from the mean signal intensity) were omitted and the remaining spectra were summed.
While the results of this multicenter project are encouraging, there were limitations. Here, we demonstrate excellent agreement in quantitative MR imaging and MR spectroscopy results within and between centers, but data are presented for only three centers. Furthermore, each of these centers has established MR research programs and infrastructure that support implementation of nonstandard MR imaging–MR spectroscopy sequences. We believe that this limitation is not serious and can be addressed with increased support from the coordinating center. It also must be appreciated that the resources needed to establish and maintain quality standards are considerable. We have identified ways to reduce personnel resources. One example includes the increased use of automated techniques for rapid specific feedback on study quality. Such techniques have been developed and are now in routine use.
This multicenter study implemented various MR techniques to measure muscle involvement in ambulant children with DMD. The MR methods were standardized across centers using 3-T MR systems, and variability across sites was tested by using identical phantoms and subjects who traveled to each site. The MR measures of CSAmax, contractile area, T2, and lipid fraction were highly reproducible in boys with DMD and control boys, and therefore show the feasibility of using multiple vendor systems and radiofrequency coil configurations in a multicenter study to examine muscle involvement in the skeletal muscles of DMD.
Advance in Knowledge.
• This study demonstrates the feasibility of MR for measuring skeletal muscle cross-sectional area, transverse relaxation time constant (T2), and lipid fraction across multiple centers in boys with Duchenne muscular dystrophy (DMD).
Implication for Patient Care.
• The high level of reproducibility of MR imaging and MR spectroscopy measures within and across centers achieved in this study supports the use of MR to assess muscle involvement in children with DMD in multicenter studies.
Disclosures of Conflicts of Interest: S.C.F. No relevant conflicts of interest to disclose. G.A.W. No relevant conflicts of interest to disclose. W.D.R. No relevant conflicts of interest to disclose. D.J.W. No relevant conflicts of interest to disclose. S.D. No relevant conflicts of interest to disclose. J.P. No relevant conflicts of interest to disclose. W.T. No relevant conflicts of interest to disclose. D.J.L. No relevant conflicts of interest to disclose. R.J.W. No relevant conflicts of interest to disclose. C.S. No relevant conflicts of interest to disclose. M.J.D. No relevant conflicts of interest to disclose. B.J.B. No relevant conflicts of interest to disclose. B.R. No relevant conflicts of interest to disclose. R.S.F. Financial activities related to the present article: none to disclose. Financial activities not related to the present article: institution received a grant from PTC Therapeutics for a study of ataluren in DMD for which R.S.F. is the primary investigator (some of the subjects in that study also participated in the current study, but no financial conflict is identified). Other relationships: none to disclose. J.S.M. No relevant conflicts of interest to disclose. H.L.S. No relevant conflicts of interest to disclose. K.V. No relevant conflicts of interest to disclose.
Supplementary Material
Acknowledgments
We thank Emily Senesac, BS, Audrey Selzer, BS, Ishu Arpan, PT, Ravneet Vohra, PhD, Abhi Batra, MA, Derek Wilson, BS, Catherine Powers, BA, Renee Cunkle, Alexandre Millette, BS, and Brittany Cools-Lartigue, BS, for assistance with data acquisition and analysis.
Received September 18, 2012; revision requested November 6; revision received January 28, 2013; final version accepted February 26.
Funding: This research was supported by the National Institutes of Health (grant RO1AR056973).
Abbreviations:
- CSAmax
- maximal cross-sectional area
- CV
- coefficient of variation
- DMD
- Duchenne muscular dystrophy
- LHBF
- long head of the biceps femoris
- MG
- medial gastrocnemius
- PB
- peroneus brevis
- PL
- peroneus longus
- ST
- semitendinosus
- STEAM
- stimulated-echo acquisition mode
- TA
- tibialis anterior
- VL
- vastus lateralis
References
- 1.Hoffman EP, Brown RH, Jr, Kunkel LM. Dystrophin: the protein product of the Duchenne muscular dystrophy locus. Cell 1987;51(6):919–928 [DOI] [PubMed] [Google Scholar]
- 2.Bushby K, Finkel R, Birnkrant DJ, et al. Diagnosis and management of Duchenne muscular dystrophy. I. Diagnosis, and pharmacological and psychosocial management. Lancet Neurol 2010;9(1):77–93 [DOI] [PubMed] [Google Scholar]
- 3.Mathur S, Lott DJ, Senesac C, et al. Age-related differences in lower-limb muscle cross-sectional area and torque production in boys with Duchenne muscular dystrophy. Arch Phys Med Rehabil 2010;91(7):1051–1058 [DOI] [PMC free article] [PubMed] [Google Scholar]
- 4.Petrof BJ. Molecular pathophysiology of myofiber injury in deficiencies of the dystrophin-glycoprotein complex. Am J Phys Med Rehabil 2002;81(11 Suppl):S162–S174 [DOI] [PubMed] [Google Scholar]
- 5.Wren TA, Bluml S, Tseng-Ong L, Gilsanz V. Three-point technique of fat quantification of muscle tissue as a marker of disease progression in Duchenne muscular dystrophy: preliminary study. AJR Am J Roentgenol 2008;190(1):W8–W12 [DOI] [PubMed] [Google Scholar]
- 6.Pastoret C, Sebille A. mdx mice show progressive weakness and muscle deterioration with age. J Neurol Sci 1995;129(2):97–105 [DOI] [PubMed] [Google Scholar]
- 7.Harper SQ, Hauser MA, DelloRusso C, et al. Modular flexibility of dystrophin: implications for gene therapy of Duchenne muscular dystrophy. Nat Med 2002;8(3):253–261 [DOI] [PubMed] [Google Scholar]
- 8.Kinali M, Arechavala-Gomeza V, Feng L, et al. Local restoration of dystrophin expression with the morpholino oligomer AVI-4658 in Duchenne muscular dystrophy: a single-blind, placebo-controlled, dose-escalation, proof-of-concept study. Lancet Neurol 2009;8(10):918–928 [DOI] [PMC free article] [PubMed] [Google Scholar]
- 9.Welch EM, Barton ER, Zhuo J, et al. PTC124 targets genetic disorders caused by nonsense mutations. Nature 2007;447(7140):87–91 [DOI] [PubMed] [Google Scholar]
- 10.Ashton E. Quantitative MR in multi-center clinical trials. J Magn Reson Imaging 2010;31(2):279–288 [DOI] [PubMed] [Google Scholar]
- 11.Poussaint TY, Phillips PC, Vajapeyam S, et al. The Neuroimaging Center of the Pediatric Brain Tumor Consortium-collaborative neuroimaging in pediatric brain tumor research: a work in progress. AJNR Am J Neuroradiol 2007;28(4):603–607 [PMC free article] [PubMed] [Google Scholar]
- 12.Frahm JBH, Bruhn H, Gyngell ML, Merboldt KD, Hänicke W, Sauter R. Localized high-resolution proton NMR spectroscopy using stimulated echoes: initial applications to human brain in vivo. Magn Reson Med 1989;9(1):79–93 [DOI] [PubMed] [Google Scholar]
- 13.Bruhn HFJ, Frahm J, Gyngell ML, Merboldt KD, Hänicke W, Sauter R. Localized proton NMR spectroscopy using stimulated echoes: applications to human skeletal muscle in vivo. Magn Reson Med 1991;17(1):82–94 [DOI] [PubMed] [Google Scholar]
- 14.Atkinson G, Nevill AM. Statistical methods for assessing measurement error (reliability) in variables relevant to sports medicine. Sports Med 1998;26(4):217–238 [DOI] [PubMed] [Google Scholar]
- 15.Smeulders MJC, van den Berg S, Oudeman J, Nederveen AJ, Kreulen M, Maas M. Reliability of in vivo determination of forearm muscle volume using 3.0 T magnetic resonance imaging. J Magn Reson Imaging 2010;31(5):1252–1255 [DOI] [PubMed] [Google Scholar]
- 16.Deoni SCL, Williams SCR, Jezzard P, Suckling J, Murphy DGM, Jones DK. Standardized structural magnetic resonance imaging in multicentre studies using quantitative T1 and T2 imaging at 1.5 T. Neuroimage 2008;40(2):662–671 [DOI] [PubMed] [Google Scholar]
- 17.Welch EB, Does MD, Avison R, et al. B0 and B1 correction of high field T2 maps of human calf muscle [abstr]. In: Proceedings of the Seventeenth Meeting of the International Society for Magnetic Resonance in Medicine. Berkeley, Calif: International Society for Magnetic Resonance in Medicine, 2009; 3953 [Google Scholar]
- 18.Hamilton G, Middleton MS, Bydder M, et al. Effect of PRESS and STEAM sequences on magnetic resonance spectroscopic liver fat quantification. J Magn Reson Imaging 2009;30(1):145–152 [DOI] [PMC free article] [PubMed] [Google Scholar]
- 19.Ren J, Sherry AD, Malloy CR. 1H MRS of intramyocellular lipids in soleus muscle at 7 T: spectral simplification by using long echo times without water suppression. Magn Reson Med 2010;64(3):662–671 [DOI] [PMC free article] [PubMed] [Google Scholar]
- 20.Akima H, Lott D, Senesac C, et al. Relationships of thigh muscle contractile and non-contractile tissue with function, strength, and age in boys with Duchenne muscular dystrophy. Neuromuscul Disord 2012;22(1):16–25 [DOI] [PMC free article] [PubMed] [Google Scholar]
- 21.Kim HK, Laor T, Horn PS, Racadio JM, Wong B, Dardzinski BJ. T2 mapping in Duchenne muscular dystrophy: distribution of disease activity and correlation with clinical assessments. Radiology 2010;255(3):899–908 [DOI] [PubMed] [Google Scholar]
Associated Data
This section collects any data citations, data availability statements, or supplementary materials included in this article.