Abstract
Dietary methionine restriction (MR) produces an integrated series of biochemical and physiological responses that improve biomarkers of metabolic health, limit fat accretion, and enhance insulin sensitivity. Using transcriptional profiling to guide tissue-specific evaluations of molecular responses to MR, we report that liver and adipose tissue are the primary targets of a transcriptional program that remodeled lipid metabolism in each tissue. The MR diet produced a coordinated downregulation of lipogenic genes in the liver, resulting in a corresponding reduction in the capacity of the liver to synthesize and export lipid. In contrast, the transcriptional response in white adipose tissue (WAT) involved a depot-specific induction of lipogenic and oxidative genes and a commensurate increase in capacity to synthesize and oxidize fatty acids. These responses were accompanied by a significant change in adipocyte morphology, with the MR diet reducing cell size and increasing mitochondrial density across all depots. The coordinated transcriptional remodeling of lipid metabolism between liver and WAT by dietary MR produced an overall reduction in circulating and tissue lipids and provides a potential mechanism for the increase in metabolic flexibility and enhanced insulin sensitivity produced by the diet.
Changes in dietary macronutrient composition (protein, carbohydrate, fat) are perceived through nutrient-sensing systems that affect overall energy balance through adaptive changes in behavior and peripheral metabolism. Diets lacking an essential amino acid (EAA) produce a conditioned aversive response that rapidly reduces food consumption by 20–30% (1–4). EAA deprivation also produces a paradoxical increase in energy expenditure (EE) that accentuates weight loss and reduces adiposity (4–6). Leucine deprivation increases sympathetic nervous system (SNS) outflow to brown (BAT) and white adipose tissue (WAT), but the diet also decreases the expression of genes required for de novo lipogenesis and triglyceride synthesis (5). Short-term leucine deprivation enhances hepatic insulin sensitivity (7), in part through a reduction in adiposity, but also through a mechanism involving diet-induced AMP-activated protein kinase activation and decreased signaling through mammalian target of rapamycin/S6K1 (7). Although leucine deprivation produces beneficial responses in short-term studies (5,7), consumption of EAA-deficient diets beyond 2–3 weeks rapidly jeopardizes the animal’s health (4,8,9).
In contrast, restriction of dietary methionine from normal levels of ∼0.8–0.17% actually increases the life span of rats (10,11), mice (12,13), and flies (14) by 20–25%. Short-term responses to dietary methionine restriction (MR) and EAA deprivation are also fundamentally different. For example, although EAA deprivation rapidly reduces food intake (1–4), dietary MR produces an immediate and persistent increase in food intake (10,15–17). The transcriptional responses in WAT are also fundamentally different, with MR increasing lipogenic gene expression and function (18) and leucine deprivation having exactly the opposite effect (5). Thus, the collective responses to EAA deprivation result in a rapidly developing nutritional crisis, whereas the responses to MR are highly beneficial to the short- and long-term metabolic health of the animal. The increase in rodent life span produced by MR is accompanied by coordinated behavioral and physiological responses that limit fat deposition through paradoxical effects on energy intake and expenditure (15,17). The persistent increase in food intake (10,15–17) is accompanied by a significant increase in EE that fully compensates for increased energy intake (17,19). The increase in EE is associated with an exaggerated heat increment of feeding, increased core body temperature, increased SNS stimulation of BAT and WAT, and a significant increase in metabolic flexibility (17,19). These responses translate into a reduction in fasting insulin and decrease the amount of insulin required to clear a standard glucose load (15).
The translational potential of the concepts developed in preclinical studies of dietary MR were recently evaluated in patients with metabolic syndrome (20). A retrospective analysis has shown that the experimental approach to achieving the desired restriction of dietary methionine was suboptimal in this study. These limitations notwithstanding, dietary MR proved beneficial in this population, reducing hepatic lipid content while increasing overall fat oxidation during the 16-week study (20). Development of palatable low-methionine foods represents an important next step in evaluating the translational potential of this approach in the clinic.
Transcriptional responses to MR have been reported (17,19,21,22), but an integrative picture of their regulation and linkage to physiological responses is lacking. Using transcriptional profiling to identify molecular responses to MR in peripheral tissues, we report that liver and WAT are the primary tissue targets and that lipid metabolism is the primary biological process. These findings support the concept that remodeling of lipid metabolism between liver and WAT is an essential component of the mechanism through which metabolic flexibility and insulin sensitivity are enhanced by dietary MR.
RESEARCH DESIGN AND METHODS
Animals and diets.
Experiments were approved by the Pennington Institutional Animal Care and Use Committee. Three experiments were conducted using male F344 rats obtained from Harlan Laboratories Inc. (Indianapolis, IN) immediately after weaning or at 5 months of age. In experiments 1 and 2, weanling rats were singly housed and assigned to the control or MR diet. In experiment 3, 5-month-old rats were adapted to the control diet for 30 days and then randomly assigned to receive the control or MR diet for 3 or 6 months thereafter. The control diet used in this previously described feeding paradigm (17) contained 0.86% methionine, whereas the MR diet was identical but contained only 0.17% methionine. Diets and water were provided ad libitum, room temperature was 22–23°C, and lights were on from 7:00 a.m. to 7:00 p.m. Before tissue harvest, rats were given Nembutal to achieve tertiary stage of anesthesia.
Experimental design
Experiment 1.
To assess chronic responses to dietary MR, two groups of eight rats received the control or MR diet from 5 weeks to 20 months of age. Tissues were harvested 4 h after the start of the light cycle.
Experiment 2.
To examine developmental responses to dietary MR, two groups of 32 rats were provided the control or MR diet beginning at 5 weeks of age. Two cohorts of 16 rats per diet were evaluated after 3 and 9 months. At each time point, eight rats per diet were killed at 1:00 p.m. and eight per group at 1:00 a.m. This provided tissue and blood samples from the midpoint of the dark (fed state) and light cycles (fasted state) for analysis of tissues and assay of insulin and triglyceride, as before (17).
Experiment 3.
To assess responses to MR when initiated after physical maturity, two groups of 16 rats were provided the control or MR diet beginning at 6 months of age. After 3 and 6 months, tissues and blood were harvested for analysis 4 h after the start of the light cycle from cohorts of eight rats per dietary group.
RNA isolation and microarray hybridization.
Gene expression profiles were evaluated in tissues from experiment 1 animals using Applied Biosystems Rat Genome Survey microarrays. Liver, muscle, inguinal WAT (IWAT), and BAT were quickly harvested at 11:00 a.m., and total RNA was isolated from each tissue. Integrity of extracted RNA was assessed using a NanoDrop spectrophotometer (NanoDrop Technologies, Wilmington, DE) and an Agilent Bioanalyzer (Agilent Technologies, Santa Clara, CA). The RNA Integrity Number for all samples fell within a range of 8.8 to 9.1 (3 = heavily degraded and 10 = nondegraded).
Gene expression profiles were generated by pooling equal amounts of RNA from each tissue from randomly selected pairs of animals fed each diet. One microgram of total RNA from each of the resulting four samples for each tissue was transcribed to digoxigenin-labeled cRNA using an Applied Biosystems Chemiluminescent NanoAmp RT-IVT Kit, and 10 μg of the fragmented digoxigenin-labeled cRNA was used for microarray hybridization. Processing, detection, and image analysis were performed using 1700 Chemiluminescent Microarray Analyzer Software v. 1.0.3. Differential gene expression was determined using ABarray software (http://www.bioconductor.org). The microarray data have been deposited in the National Center for Biotechnology Information Gene Expression Omnibus (accession no. GSE28599).
Quantitative real-time PCR analysis.
Expression of selected genes was validated using individual samples from each animal and tissue by quantitative real-time PCR (RT-PCR). The concentration of target mRNAs in each sample was estimated by reverse calibration from standard curves relating mass of target cDNA to cycle threshold, as described previously (23,24).
Western blotting.
Tissue-specific expression of acetyl-CoA cocarboxylase (ACC-1), fatty acid synthase (FASN), and stearyl-CoA desaturase (SCD-1) were measured by Western blotting. FASN and total ACC-1 were evaluated in cytoplasmic extracts, whereas SCD-1 was measured in microsomes. Expression of precursor and nuclear forms of hepatic sterol regulatory element–binding protein (SREBP)-1c was determined as before (25) using an antibody (sc-13551) from Santa Cruz Biotechnology (Santa Cruz, CA). The FASN antibody was from Santa Cruz (sc-48357), and the ACC-1 antibody (#3662) was from Cell Signaling (Danvers, MA). The SCD-1 antibody was made by immunizing rabbits with the COOH terminus do-decapeptide sequence of rat SCD-1 conjugated to keyhole limpet hemocyanin. After a 5-month immunization protocol, anti-serum was purified using peptide affinity chromatography. The specificity and affinity of the purified SCD-1 IgG were validated using liver microsomes from SCD-1–null mice and extracts of COS-7 cells transformed with mouse SCD-1.
Fatty acid oxidation.
Fatty acid oxidation was assessed in freshly harvested liver, quadriceps muscle, BAT, and IWAT homogenates, as previously described (26,27), by measuring the 14CO2 and 14C-labeled acid-soluble metabolites formed from [1-14C]-palmitic acid. Citrate synthase activity was measured as a surrogate of mitochondrial content and tricarboxylic acid (TCA) cycle activity/flux by a modification (28) of the method of Srere and Matsuoka (29).
Adipocyte morphology and mitochondrial DNA.
Cell size of adipocytes in hematoxylin-stained sections of epididymal (EWAT; visceral), retroperitoneal (RPWAT; visceral) and IWAT (subcutaneous) was measured in replicate sections from each depot using the area measurement tool in Image J software. To assess changes in mitochondrial DNA (mtDNA), genomic DNA was isolated and the ratio of mtDNA to nuclear DNA copy number was determined by RT-PCR of NADH dehydrogenase subunit 1 (ND1) and lipoprotein lipase (LPL) as before (30).
Data analysis.
Signal intensities across microarrays were normalized via quantile normalization (http://www.bioconductor.org). Features with signal-to-noise values ≥3 and quality flag values <5,000 were considered “detected” and subjected to ANOVA (P < 0.05) using Spotfire DecisionSite Software (Spotfire, Somerville, MA). Differentially expressed genes with a cutoff of 1.25-fold change at P < 0.05 were evaluated for biological pathway enrichment using the Ingenuity Pathway Analysis tool (Ingenuity Systems, Redwood City, CA). In addition, the Ingenuity Upstream Regulator Analytic module was used to determine significant overlap between dataset genes and established transcription regulator target genes, as maintained in the Ingenuity Knowledge Base. The analysis is based on expected causal effects of transcription factors on their targets relative to the observed direction of change in those targets, allowing it to predict whether specific transcription factors are activated or inhibited. The analysis examines mechanistic networks to identify transcription factors that function together to orchestrate transcriptional programs. The predicted state of the transcription regulator (activation or inhibition) was determined from the relationships in the molecular regulatory network that represent experimentally observed gene expression and are associated with literature-derived reports of regulator activation or inhibition. Additional details are available at http://pages.ingenuity.com/IngenuityUpstreamRegulatorAnalysisWhitepaper.html.
ANOVA was used to compare mRNA levels of individual genes measured by RT-PCR, protein expression levels from Western blots, mtDNA concentration per cell, rates of fatty acid oxidation, and measures of adipocyte cell size, followed by post hoc testing for differences within time point using the Bonferroni correction. Protection against type I errors was 5% (α = 0.05).
RESULTS
The effects of dietary MR on body weight, fat deposition, energy expenditure, and metabolic flexibility for the rats used in experiments 1–3 described here have been reported previously (17).
Experiment 1.
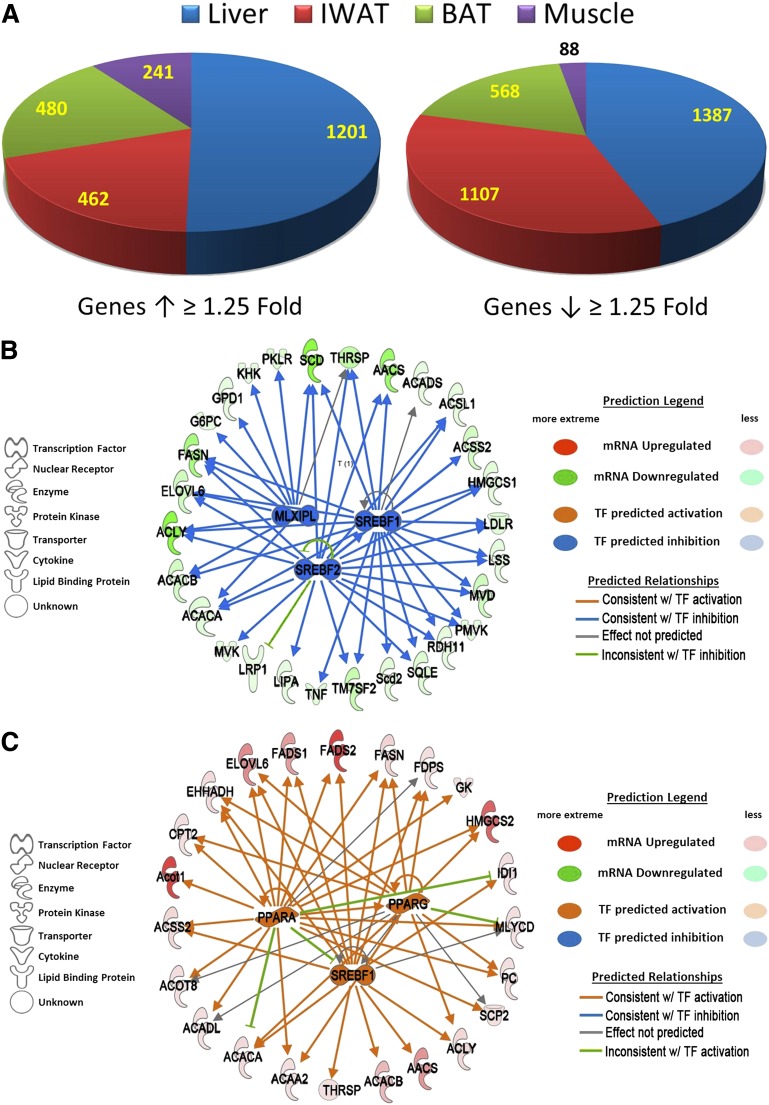
Microarrays were used to examine the tissue-specific transcriptional changes in liver, IWAT, BAT, and muscle after long-term dietary MR that are associated with the decrease in serum and hepatic triglyceride and the increase in metabolic flexibility produced by the diet (15,17). A summary of the differentially expressed genes (e.g., fold-change of MR/control ≥1.25 at P < 0.05) shows that >75% of all differentially expressed genes were found in liver and IWAT (Fig. 1A). To understand the systems biology of transcriptional responses to MR, differentially expressed genes were screened against annotated databases to identify gene set enrichment within biological processes and canonical pathways. Lipid metabolism was the top biological function and molecular and cellular process affected in liver, to which more than 16% (e.g., 417/2,588) of differentially expressed molecules were annotated. An upstream regulator prediction algorithm was used to identify candidate transcription factors that are responsible for observed programmatic changes in gene expression. The upstream regulator algorithm predicted that sterol regulatory element-binding transcription factor 1 (SREBF1), SREBF2, and carbohydrate response element-binding protein (MLXIPL) were inhibited by MR and functioning as a network to decrease expression of genes involved in hepatic lipid metabolism, particularly those involved in fatty acid and triglyceride synthesis (Fig. 1B). However, a comparison of the fold-changes in expression of genes within this network across all tissues illustrates that their coordinated downregulation was unique to the liver, because these genes were either unaffected or significantly upregulated in IWAT, BAT, and muscle (Table 1). Of the 28 genes in this network, 19 receive transcriptional input from at least two of the three transcription factors (Fig. 1B). Lastly, inhibition of this transcriptional network is consistent with a 1.7-fold decrease in mRNA expression of the three transcription factors in the liver (Table 1 and Fig. 1B).
FIG. 1.
Differential regulation of gene expression by dietary MR for 20 months in liver, IWAT, BAT, and muscle as assessed by microarray. A: Pie chart illustrating transcriptional effect of dietary MR by tissue. Genes were identified as differentially expressed if dietary MR increased or decreased their expression by ≥1.25-fold and P < 0.05. Upstream regulator analysis is shown of differentially expressed genes in liver (B) and IWAT (C). B: In liver, the algorithm detected coordinated downregulation of genes involved in lipid metabolism and predicted that the transcriptional network was being regulated by SREBF1, SREBF2, and MLXIPL and that the network was inhibited. C: In IWAT, the algorithm detected coordinated upregulation of genes involved in lipid metabolism. The algorithm predicted that the transcriptional network was being regulated by SREBF1, PPARα, and PPARγ and that the transcriptional activity of the network was activated. The prediction legend for panels B and C denotes the observed changes in gene expression (green to red ellipses) and predicted activation/inhibition of TFs that may explain such differences (blue and orange ellipses). The nature of the interaction between a TF and its target gene is described as follows: A blue arrow indicates that the TF normally activates the target gene and that the downregulation of the target gene is therefore consistent with TF inhibition; conversely, an orange arrow indicates target gene expression changes that are consistent with TF activation; and a gray arrow indicates that the effect of the TF on the target is not unambiguously known. A green line indicates cases where the literature-based relationship between a TF and its target (activating or inhibitory) was not matched by the expression data, leading to an inconsistent prediction of TF activation or inhibition.
TABLE 1.
Changes in mRNA expression of genes involved in lipid metabolism that are regulated or coregulated by SREBP-1c, SREBP2, and MLXIPL during dietary MRa
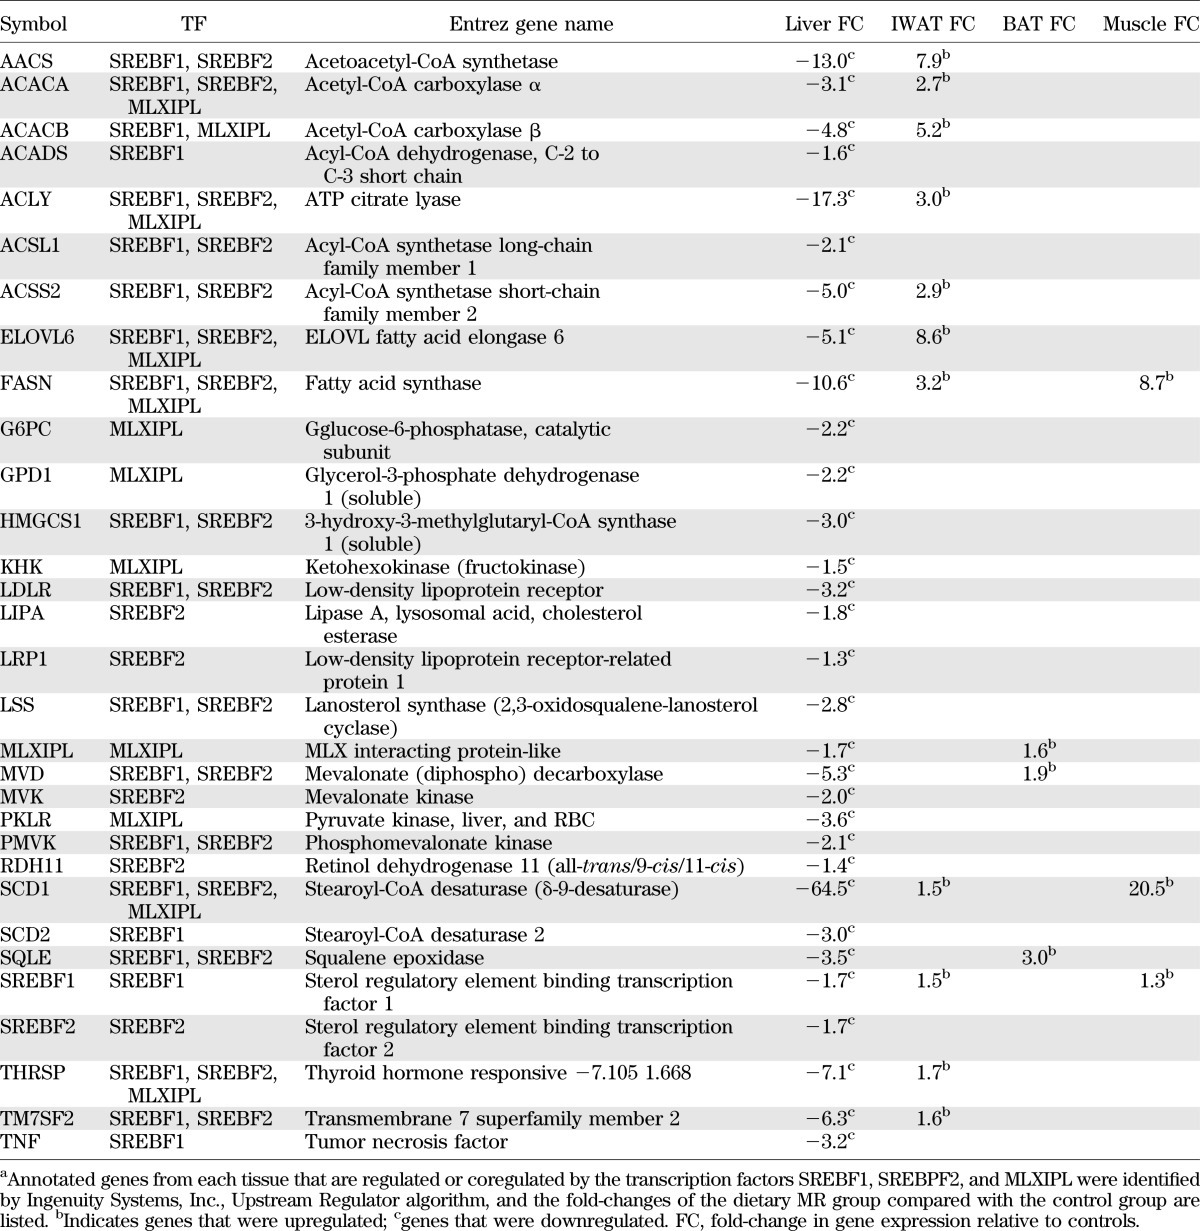
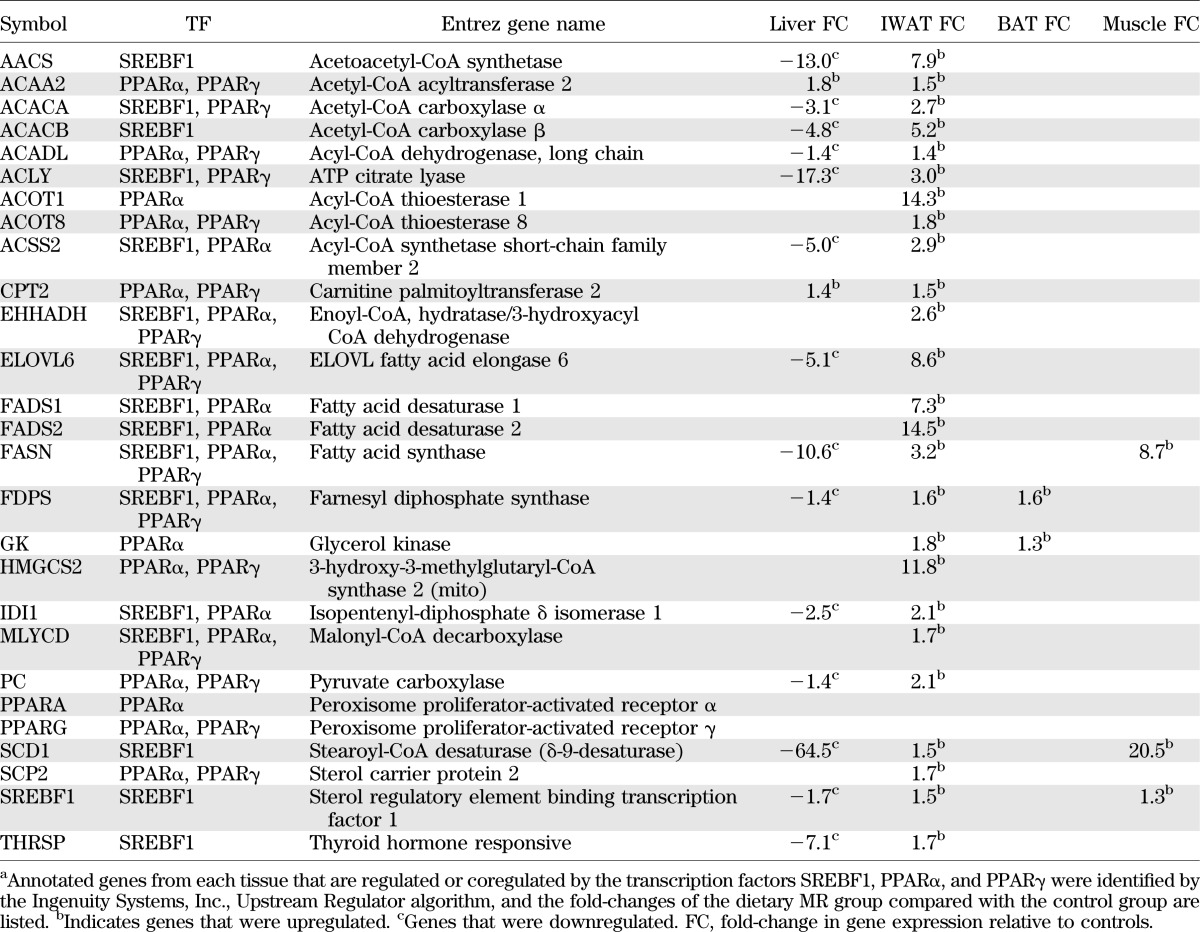
Analysis of transcriptional links to lipid metabolism in IWAT also pointed to involvement of SREBF1, but predicted that SREBF1 was activated by MR, along with nuclear receptors, peroxisome proliferator–activated receptor (PPAR)α and PPARγ (Fig. 1C). This network explains the coordinated upregulation of many of the same genes downregulated in the liver (Table 1), plus additional genes recruited by PPARs (Fig. 1C). Changes in gene expression within IWAT and liver networks illustrate that dietary MR produced fundamentally different responses between the tissues with respect to lipid metabolism (Tables 1 and 2) and did so by recruiting an inhibitory network in liver and an activating network in IWAT. The transcriptional responses in BAT and muscle were far less extensive but, in general, were more like IWAT than liver.
TABLE 2.
Changes in mRNA expression of genes involved in lipid metabolism that are regulated or coregulated by SREBF1, PPARα, and PPARγ during dietary MRa
RT-PCR of rate limiting enzymes for de novo lipogenesis (FASN, ACC-1) and triglyceride synthesis (SCD-1) shows that SCD-1, FASN, and ACC-1 were increased by MR in all WAT depots (Table 3). SCD-1 and FASN mRNAs were much lower in muscle than WAT, but dietary MR increased expression of each by ∼20-fold (Table 3). In liver, MR reduced SCD-1 by ∼100-fold and lowered FASN and ACC-1 expression by 8- to 10-fold. BAT was the only tissue where expression of the three genes was unchanged (Table 3). Collectively, the findings demonstrate that long-term dietary MR produced reciprocal, tissue-specific changes in lipogenic genes.
TABLE 3.
Tissue-specific changes in SCD-1, FASN, and ACC-1 mRNA expression after 18 months of dietary MRa

Experiment 2.
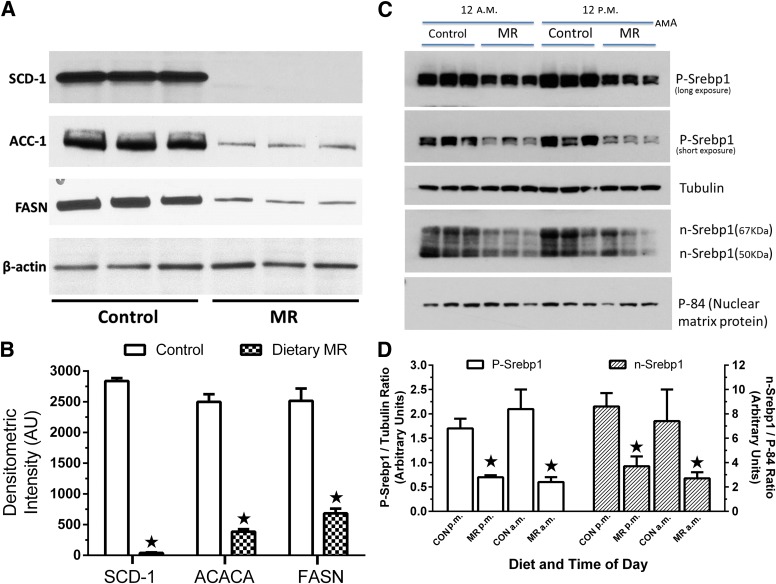
Consumption of MR diets for 3 and 9 months after weaning also reduced hepatic expression of SCD-1, FASN, and ACC-1, while increasing the expression of these genes in all three WAT depots (Supplementary Table 1). In general, the magnitude of the dietary effect on SCD-1, FASN, and ACC-1 mRNAs increased between 3 and 9 months in all tissues (Supplementary Table 1). Diet-induced changes in protein expression in liver and WAT mirrored changes in mRNA levels for the respective genes (Figs. 2A and 3). For example, the 340-fold reduction in SCD-1 mRNA by MR translated into essentially undetectable SCD-1 expression in the MR group, even after long exposures (Fig. 2A). Diet-induced reductions of FASN mRNA (36-fold) and protein expression (3.7-fold) differed quantitatively, but the reductions in ACC-1 mRNA (4.6-fold) and protein expression (6.5-fold) were comparable (Supplementary Table 1 and Fig. 2A). On the basis of the predicted involvement of SREBF1 in downregulating these genes in liver (Fig. 1B), expression of SREBP-1c was examined in cohorts of rats killed at the midpoints of the light (12 P.M.) and dark cycles (12 A.M.). Expression of precursor and nuclear forms of SREBP-1c were both reduced by dietary MR on the order of 2.3-fold in 12 A.M. samples and ∼3-fold in 12 P.M. samples (Fig. 2C and D).
FIG. 2.
Effects of 9 months of dietary MR after weaning are shown on protein expression of lipogenic genes in the liver. A: Hepatic SCD-1, ACC-1, and FASN expression was measured by Western blotting of 30 μg microsomal membranes (SCD-1) and 15 μg cytosolic extracts (ACC-1, FASN) using antibodies described in Research Design and Methods. β-Actin served as a loading control. B: Scanning densitometry was used to quantitate expression levels for each protein between groups. ★Means differ from controls at P < 0.05. C: Western blots of precursor (P-Srebp1) and nuclear forms (n-Srebp1) of SREBP-1c in hepatic extracts of rats killed in the middle of the daily dark (12:00 a.m.) and light (12:00 p.m.) cycles. Tubulin was used as a loading control for the precursor form, and P-84 was used for the nuclear form. D: Expression levels were compared by densitometry. ★Means differ from controls at P < 0.05. CON, control diet.
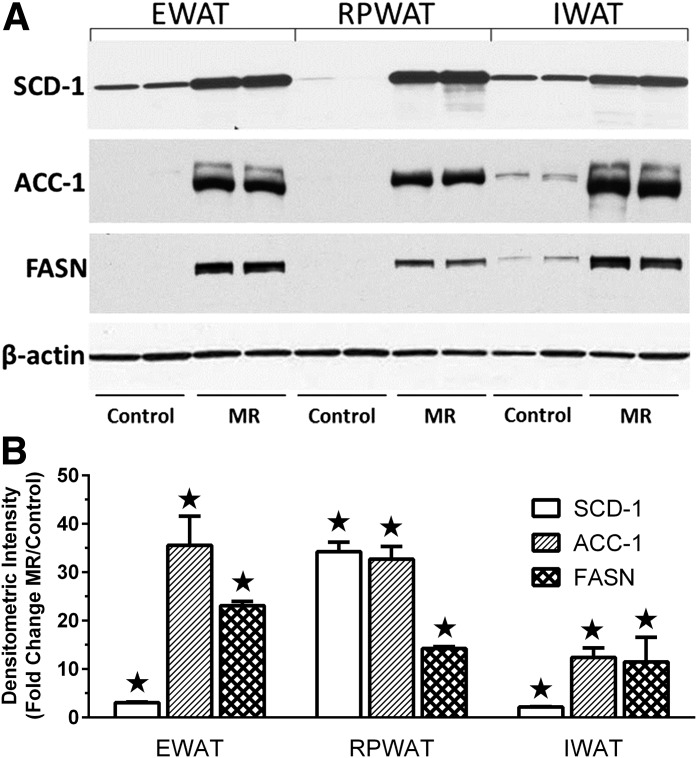
FIG. 3.
Effects of 9 months of dietary MR after weaning are shown on protein expression of lipogenic genes among WAT depots. A: SCD-1, ACC-1, and FASN expression in the EWAT, RPWAT, and IWAT depots were measured by Western blotting of 15 μg microsomal membranes (SCD-1) and 15 μg cytosolic extracts (ACC-1, FASN) using antibodies described in Research Design and Methods. β-Actin was measured as a loading control. B: Scanning densitometry was used to quantitate expression levels for each protein and expressed as fold-change of each protein in each depot relative to controls. ★Means differ from controls at P < 0.05.
In WAT depots, SCD-1 protein expression was comparable in control EWAT and IWAT, and significantly higher than the low levels in RPWAT (Fig. 3A). However, MR increased SCD-1 expression to comparable levels among the depots (Fig. 3A), which translated into a much larger fold-increase in RPWAT SCD-1 (Fig. 3B). MR also increased ACC-1 and FAS expression to comparable levels among depots, transforming the lipogenic potential of all three depots. Together, these findings establish that MR produced opposite effects on genes essential to the synthesis of fatty acids and triglycerides in liver and WAT.
To examine transcriptional responses to MR when initiated after physical maturity, MR was initiated at 6 months of age, with responses evaluated 3 and 6 months later. Hepatic expression of lipogenic genes was significantly decreased at both time points, whereas lipogenic gene expression was reciprocally increased in WAT depots (Supplementary Table 2). The findings show that initiation of MR after physical maturity does not alter the transcriptional remodeling of lipogenic gene expression by the diet in liver and WAT.
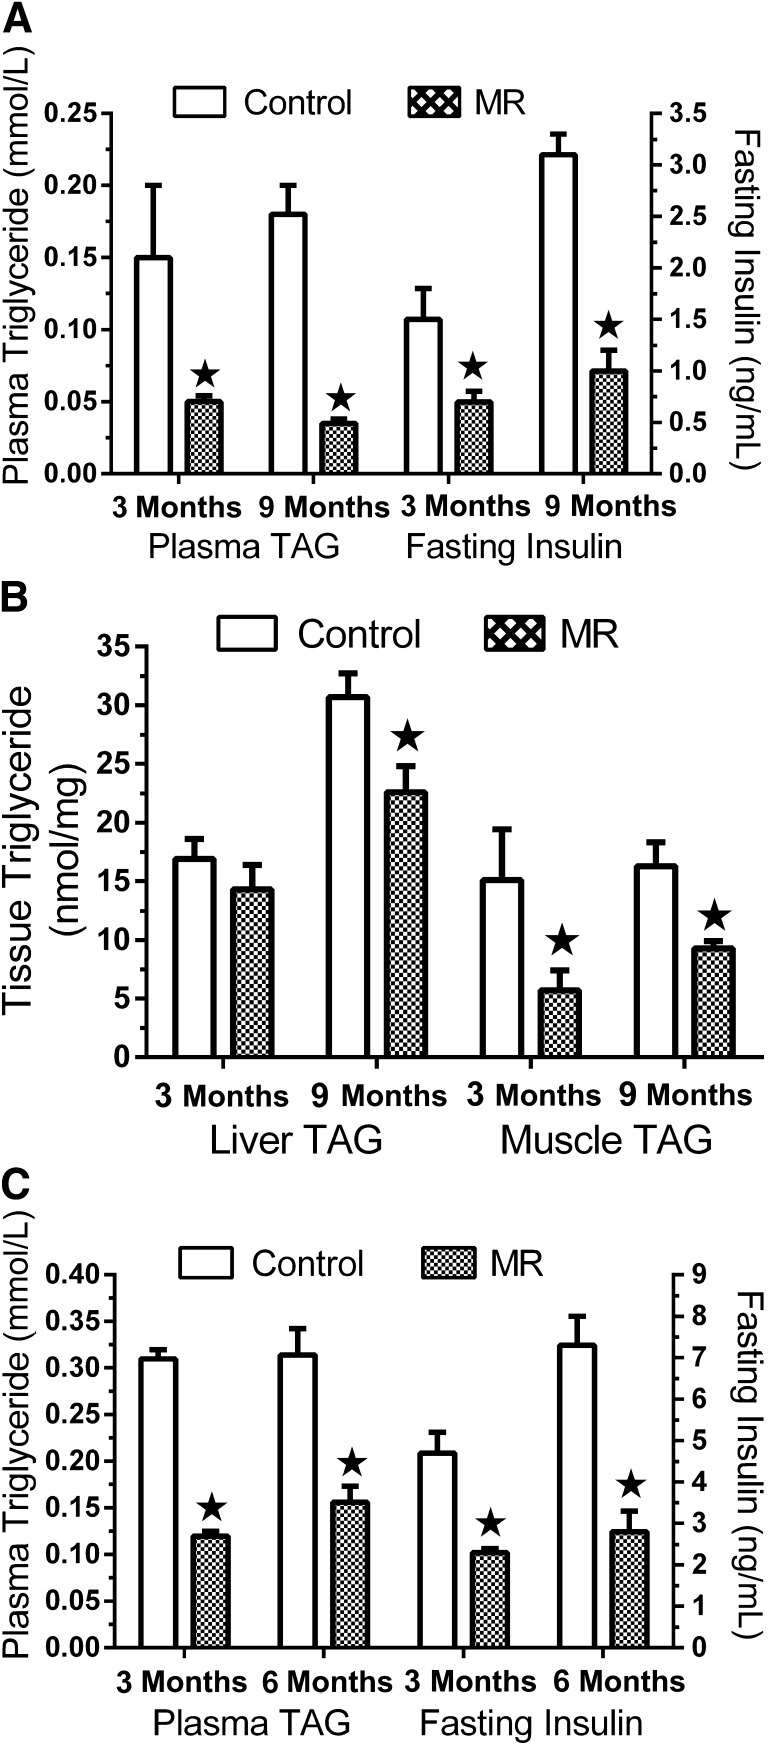
The physiological impact of MR in both experimental contexts is illustrated by the diet-induced decrease in fasting insulin, plasma triglyceride, and tissue triglyceride levels (Fig. 4). Whether initiated after weaning or at 6 months of age, dietary MR reduced insulin by two- to threefold in both models (Fig. 4A and C). Plasma triglyceride was also reduced by the diet in both experiments (Fig. 4A and C). MR also reduced hepatic and muscle triglycerides when initiated after weaning (Fig. 4B), but when initiated at 6 months of age, MR failed to reduce triglyceride levels in liver or muscle (data not shown).
FIG. 4.
Plasma triglyceride and insulin levels (A) and liver and muscle triglyceride levels (B) after 3 and 9 months of MR in experiment 2, and plasma triglyceride and insulin levels after 3 and 6 months of dietary MR in experiment 3 (C). Plasma was obtained from each rat at euthanasia in the respective experiments and means ± SEM are from seven to eight rats per group and time point in each experiment. ★Means differ from controls at P < 0.05.
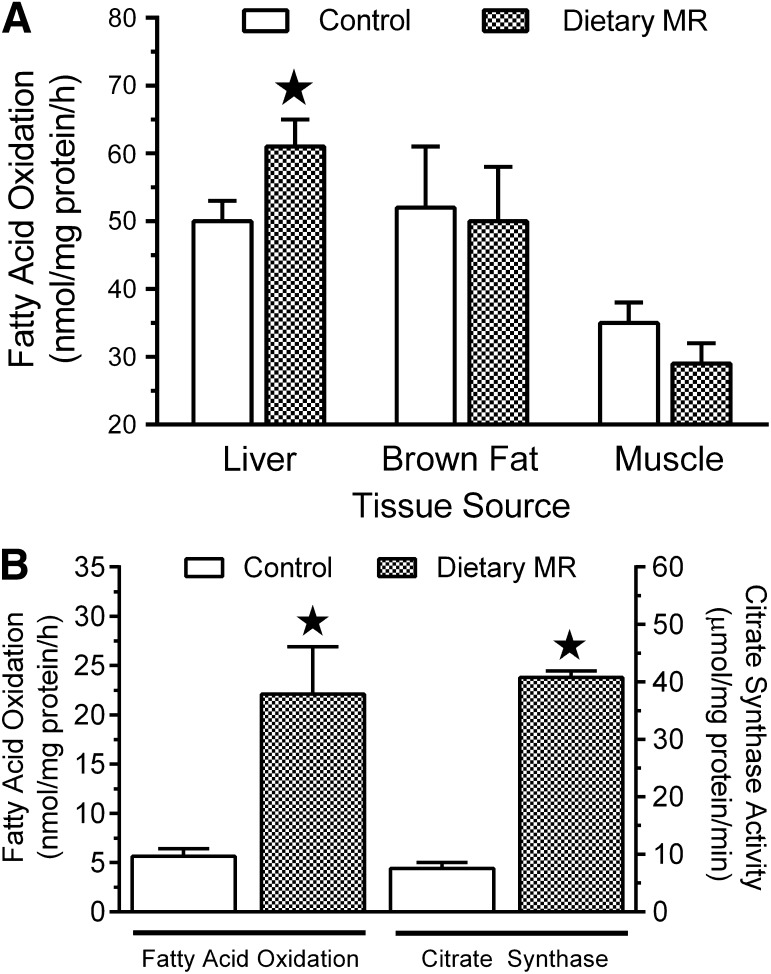
The transcriptional responses to MR in WAT included genes involved in lipid synthesis and oxidation (Fig. 1C). To evaluate the impact of the latter, the ex vivo capacity of freshly isolated tissues to oxidize fatty acids was measured using 14C-palmitate, coupled with measures of citrate synthase activity as a surrogate of TCA cycle flux. Hepatic palmitate oxidation increased by ∼40% after 9 months of MR but was unaltered in muscle and BAT (Fig. 5A). Although hepatic mtDNA was unchanged in the MR group (data not shown), the reduction in hepatic expression of ACC-1 (Fig. 2A) would limit formation of malonyl-CoA and increase the activity of CPT1B. The associated increase in acyl-CoA transport may be involved in the increased palmitate oxidation observed in the liver of the MR group (Fig. 5A).
FIG. 5.
Fatty acid oxidation in liver, BAT, and quadriceps muscle (A) and in IWAT (B) in tissues harvested at euthanasia after 9 months of MR in experiment 2. B: Citrate synthase activity was also measured in IWAT harvested from each rat. Means ± SEM were calculated from seven to eight rats per group. ★Means differ from controls at P < 0.05.
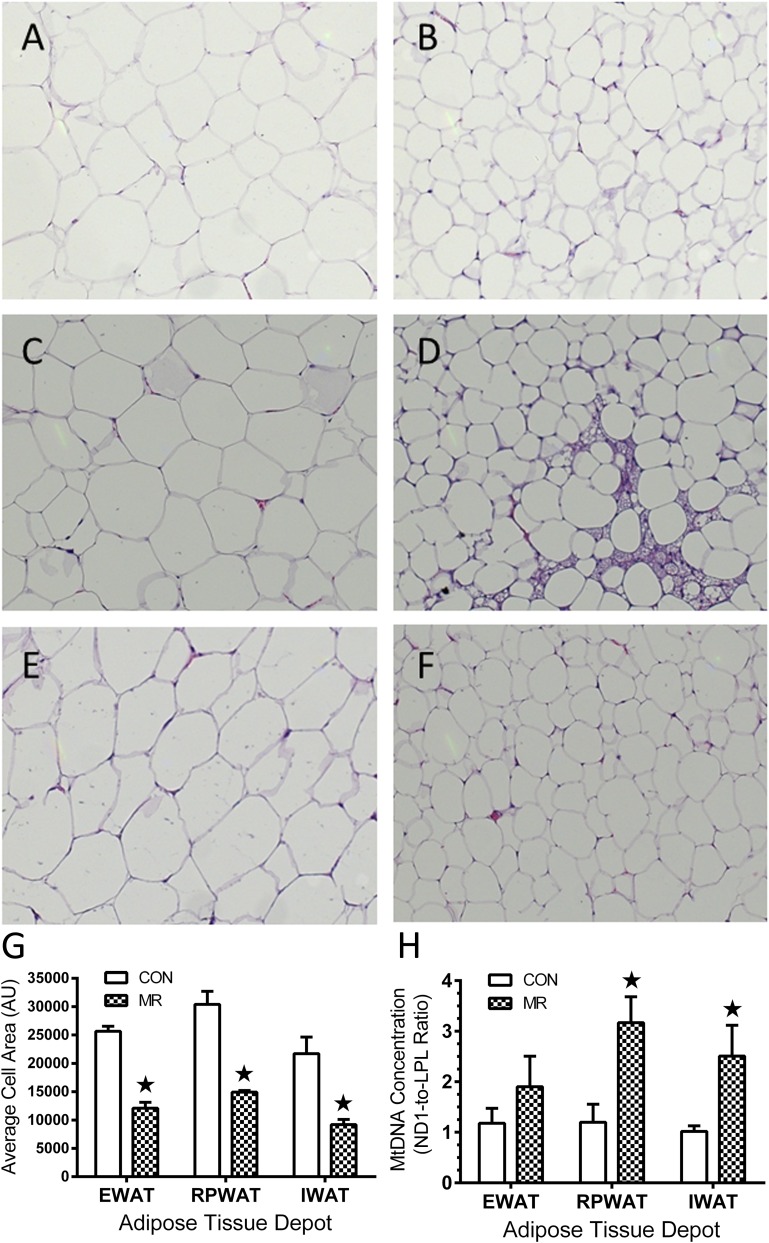
The magnitude of the effect on fatty acid oxidation was much greater in IWAT, where MR produced a fivefold increase in palmitate oxidation and citrate synthase activity (Fig. 5B). Considered with changes in lipogenic gene expression among the WAT depots, these findings support the view that transcriptional effects of MR on WAT increased both oxidative and lipogenic capacity of the tissue. To explore remodeling of WAT, cell morphology, cell area, and mtDNA were examined among depots. Hematoxylin and eosin stains of representative sections (Fig. 6A–F) show that MR reduced cell area by approximately twofold in all three depots (Fig. 6G). MR produced more extensive remodeling of cell morphology in RPWAT and IWAT than EWAT (Fig. 6A–F). MR also increased mitochondrial DNA by more than twofold in RPWAT and IWAT but not in EWAT. Collectively, these findings support the conclusion that increased oxidative capacity of IWAT is the result of a remodeling of cell morphology involving decreased cell size and increased mitochondrial density. A similar increase in oxidative capacity of RPWAT, but not EWAT, is predicted.
FIG. 6.
Effects of 9 months of dietary MR after weaning are shown on morphology, cell size, and mtDNA concentration in adipocytes among WAT depots. Cell size of adipocytes in hematoxylin-stained sections of epididymal (A and B), retroperitoneal (C and D), and inguinal depots (E and F) were measured in 10 fields from each section using Image J software. G: A summary of means ± SEM for each diet and depot is shown. H: The mtDNA concentration in genomic DNA isolated from each depot and diet is shown expressed as the ratio of mtDNA copy number to nuclear DNA copy number. ★Means differ from controls at P < 0.05.
DISCUSSION
Selective restriction of dietary methionine produces a highly integrated series of behavioral, physiological, and biochemical responses that improve biomarkers of metabolic health and increase longevity in rodents (10,12,13). The metabolic responses include reduced circulating and tissue lipids, increased metabolic flexibility, reduced adiposity, and changes in gene expression (17,19,21,31), but the transcriptional programs that are linked to specific physiological responses are poorly understood. The strategy taken here was to use transcriptional profiling and bioinformatics to explore the systems biology of tissue-specific responses to dietary MR, with special emphasis on developing an integrative view of the mechanism(s) for the diet’s beneficial effects on lipid levels.
Disordered lipid metabolism is a central component of the etiology of metabolic syndrome and is the most common cause of ectopic lipid accumulation outside of adipose tissue. Excess fat accumulation in the liver typically results from increased delivery, increased synthesis, decreased oxidation, or decreased export (32). Therefore, dysfunctional steps leading to increased liver fat provide a useful framework for evaluating the mechanisms through which dietary MR reduces plasma and hepatic triglycerides. In the current study, dietary MR increased hepatic palmitate oxidation (∼40%) and coordinately reduced expression of genes involved in lipid synthesis. Previous studies showed that MR also reduced plasma cholesterol (15) but had no effect on nonesterified free fatty acids (21,22). A review of the bioinformatic analysis of hepatic genes annotated within biological functions of lipid or fatty acid transport identified 82 genes that were differentially expressed in the MR group, 54 of which were downregulated. Viewed collectively, the reduction in hepatic lipid content by dietary MR is best explained by a combination of increased fatty acid oxidation and reduced de novo lipogenesis. Complementary findings were recently reported in the first clinical evaluation of MR in a human cohort meeting the criteria for metabolic syndrome (20). Dietary methionine was limited for 16 weeks using the semisynthetic medical food, Hominex-2 (Abbott Nutrition, Columbus, OH), and despite questions about compliance and achieving the desired degree of restriction, MR increased in vivo fat oxidation and reduced hepatic lipids (20). Solving the problems created by the low palatability of Hominex-2 will be important to evaluate the potential efficacy of MR as a dietary approach to metabolic disease.
Previous reports of transcriptional responses to MR (17,22,31) have not addressed their physiological significance or transcriptional mechanisms. The analytical strategy used here sought to identify transcription factors (TFs) and nuclear receptors mediating dietary responses based on expected causal effects of TFs/nuclear receptors on known target genes relative to observed changes of those genes within the dataset. By examining the direction of change in target gene expression, the algorithm predicts whether specific TFs/nuclear receptors are activated or inhibited. In the liver, the coordinated downregulation of over 30 genes involved in lipid metabolism led to the prediction that SREBF1, SFEBF2, and MLXIPL were inhibited by MR. Moreover, most of the repressed genes receive transcriptional input from two or more of these TFs, which further corroborates the interconnectedness of the regulatory network. The diet-induced decrease in expression of hepatic SREBP-1c is consistent with the repressive effect of MR on lipogenic gene expression. SREBP-1c and carbohydrate-responsive element-binding protein are also subject to regulation by cholesterol and glucose, and both are decreased by dietary MR (21). However, whether decreases in cholesterol and glucose are the cause or product of transcriptional responses to MR remains unclear. In either case, hepatic SREBP-1c appears to be a key target of the mechanism through which MR reduces hepatic de novo lipogenesis, triglyceride synthesis, and lipid content.
Although SREBF1 mRNA and protein expression in WAT were unchanged by MR, the coordinated upregulation of lipogenic genes in this tissue predicted the TF was being activated by the diet. However, in contrast to the liver, lipid oxidation genes that are known targets of PPARα and/or PPARγ were increased in a pattern consistent with activation of these nuclear receptors and SREBF1. The recruitment of these nuclear receptors to a network that includes SREBF1 is consistent with the paradoxical upregulation of genes involved in both lipid synthesis and oxidation, suggesting that MR enhanced both lipogenic and oxidative capacity of WAT. Several lines of evidence support this conclusion. MR remodeled the morphology of adipocytes in all three depots, increased mitochondrial density in two depots, increased TCA flux, and increased the capacity of IWAT to oxidize palmitate. In addition, the increase in fed-state respiratory quotients (RQs) to values greater than 1 by MR is indicative of the interconversion of glucose to lipid by de novo lipogenesis (17). A limitation of the previous work is that temporal changes in the RQ are summative with respect to substrate utilization and interconversion in all tissues and provide no information regarding tissue-specific changes in de novo lipogenesis. The transcriptional remodeling of tissue-specific lipogenic gene expression reported here predicted that WAT was contributing to increased de novo lipogenesis in the fed state. However, it will be important in future studies to measure in vivo rates of de novo lipogenesis to establish that dietary MR has remodeled tissue-specific lipogenesis in the manner predicted by our transcriptional analysis.
Evaluation of the responses to dietary MR when initiated after physical maturity was undertaken to develop a preclinical model for translational studies, where application of MR will initially focus on adult subjects. In the present work, the behavioral, metabolic, and transcriptional responses to MR, whether initiated after weaning or after attainment of physical maturity, were comparable, with the exception of hepatic triglycerides, where MR after maturity failed to produce a significant reduction. However, the observations that MR produced a comparable reduction in plasma triglycerides and downregulation of lipogenic genes in both experimental contexts (Supplementary Tables 1 and 2 and Fig. 4) suggest that lipogenesis and VLDL assembly and secretion were also comparably affected. Given that hepatic lipid levels are attributable to the relative rates of uptake, oxidation, and export, differences in uptake and/or oxidation seem the most likely explanation for the failure of MR to reduce hepatic lipids in the adult context. Additional studies will be required to systematically measure the in vivo rates of these components to identify the specific difference in the way juvenile and adult rats respond to MR. However, we note that in adult subjects with metabolic syndrome, dietary MR for 16 weeks increased overall fatty acid oxidation and reduced hepatic lipid levels (20).
An important unanswered question is how restriction of dietary methionine is detected and how sensing of restriction is translated into highly integrated transcriptional responses in liver and WAT. Restricting availability of EAAs effectively limits charging of tRNA with its cognate AA and activates the highly conserved and ubiquitously expressed protein kinase, general control nondepressible 2 (GCN2), which limits ribosomal translation of most mRNAs (33–35). Transcriptional effects of EAA deprivation on lipogenic genes were initially identified in human HepG2 cells, where media lacking single EAAs decreases transcriptional initiation and expression of FASN (36). These studies suggest the interesting possibility that MR functions through GCN2 to decrease expression of lipogenic genes in the liver. However, MR increased lipogenic gene expression in WAT and muscle, arguing against a role for GCN2 and suggesting involvement of additional sensing and signaling systems in these tissues.
The “browning” of WAT that occurs during cold exposure involves many of the same changes seen with MR, including reduction in cell size, formation of multilocular adipocytes, and increased UCP1 expression (17,19). It is well established that cold exposure, acting via norepinephrine, elicits a simultaneous increase in glucose uptake, lipogenesis, and β-oxidation in BAT (37,38). Moreover, the increased number of brown adipocytes in WAT after chronic cold exposure enhances glucose uptake and lipogenic function within these depots. Recent work has emphasized the importance of BAT to triglyceride clearance while documenting the regulatory role of SNS input in the process (39). Thus, the simultaneous increase in lipogenic and oxidative gene expression in WAT may be reflective of extensive remodeling of WAT depots produced by dietary MR through effects on SNS activity. This conclusion is supported by our previous work showing that dietary MR increased UCP1 mRNA 3- to 10-fold among WAT depots (17,19) and present observations that MR doubled mitochondrial density among WAT depots and increased oxidative capacity of IWAT by 5-fold (Figs. 5 and 6).
Our most significant finding is that the coordinated remodeling of lipogenic gene expression between liver and WAT produced by dietary MR resulted in a significant decrease in circulating and hepatic lipid levels. These responses to MR appear directly related to the pronounced expansion of the dynamic range of the RQ between fed and fasted states reported previously (17). In view of the diet-induced decrease in insulin levels, reduced lipogenic capacity of the liver, and increased oxidative and lipogenic capacity of adipose tissue, the present findings make a compelling case that dietary MR has effectively remodeled the integration of lipid metabolism between liver and adipose tissue in a manner that is beneficial to the overall metabolic profile of the animal.
ACKNOWLEDGMENTS
This work was supported by the American Diabetes Association 1-12-BS-58 (T.W.G.), National Institutes of Health (NIH) RO1 DK-096311 (T.W.G.), a subcontract to T.W.G. from the Mouse Metabolic Phenotyping Center Consortium NIH U24 DK-076169, and in part by NIH RO1 DK098439 (J.E.P.), NIH R21 DK-088319 (S.G.), and American Heart Association SDG-4230068 (S.G.). DW is supported by NIH Institutional Training Grant T32 DK-064584. This work made use of the Genomics and Cell Biology and Bioimaging core facilities supported by NIH P20-GM-103528 (T.W.G.) and NIH P30 DK-072476.
No potential conflicts of interest relevant to this article were reported.
B.E.H., K.P.S., D.W., and T.W.G. contributed to the writing and editing of the manuscript. B.E.H., A.L., and L.K.S. conducted the animal experiments. A.B. conducted the microarray analysis. S.G. and T.W.G. analyzed the microarrays. J.S., D.F., and J.E.P. conducted the Western blots. M.H. measured fatty acid oxidation. A.B., N.T.V., and A.L. conducted the RT-PCR assays. T.W.G. analyzed the data used to produce the illustrations. T.W.G. is the guarantor of this work and, as such, had full access to all the data in the study and takes responsibility for the integrity of the data and the accuracy of the data analysis.
The authors acknowledge the technical contributions of Susan Newman and Michael Salbaum, Genomics Core, for assistance with the conduct and analysis of the microarrays.
Footnotes
This article contains Supplementary Data online at http://diabetes.diabetesjournals.org/lookup/suppl/doi:10.2337/db13-0501/-/DC1.
S.G. is currently affiliated with the Cardiovascular and Metabolic Disease Program and Center for Computational Biology, Duke-NUS Graduate Medical School, Singapore.
REFERENCES
- 1.Gietzen DW. Neural mechanisms in the responses to amino acid deficiency. J Nutr 1993;123:610–625 [DOI] [PubMed] [Google Scholar]
- 2.Gietzen DW, Erecius LF, Rogers QR. Neurochemical changes after imbalanced diets suggest a brain circuit mediating anorectic responses to amino acid deficiency in rats. J Nutr 1998;128:771–781 [DOI] [PubMed] [Google Scholar]
- 3.Koehnle TJ, Russell MC, Gietzen DW. Rats rapidly reject diets deficient in essential amino acids. J Nutr 2003;133:2331–2335 [DOI] [PubMed] [Google Scholar]
- 4.Guo F, Cavener DR. The GCN2 eIF2alpha kinase regulates fatty-acid homeostasis in the liver during deprivation of an essential amino acid. Cell Metab 2007;5:103–114 [DOI] [PubMed] [Google Scholar]
- 5.Cheng Y, Meng Q, Wang C, et al. Leucine deprivation decreases fat mass by stimulation of lipolysis in white adipose tissue and upregulation of uncoupling protein 1 (UCP1) in brown adipose tissue. Diabetes 2010;59:17–25 [DOI] [PMC free article] [PubMed] [Google Scholar]
- 6.Cheng Y, Zhang Q, Meng Q, et al. Leucine deprivation stimulates fat loss via increasing CRH expression in the hypothalamus and activating the sympathetic nervous system. Mol Endocrinol 2011;25:1624–1635 [DOI] [PMC free article] [PubMed] [Google Scholar]
- 7.Xiao F, Huang Z, Li H, et al. Leucine deprivation increases hepatic insulin sensitivity via GCN2/mTOR/S6K1 and AMPK pathways. Diabetes 2011;60:746–756 [DOI] [PMC free article] [PubMed] [Google Scholar]
- 8.Anthony TG, McDaniel BJ, Byerley RL, et al. Preservation of liver protein synthesis during dietary leucine deprivation occurs at the expense of skeletal muscle mass in mice deleted for eIF2 kinase GCN2. J Biol Chem 2004;279:36553–36561 [DOI] [PubMed] [Google Scholar]
- 9.Sugimura T, Birnbaum SM, Winitz M, Greenstein JP. Quantitative nutritional studies with water-soluble, chemically defined diets. IX. Further studies on d-glucosaminecontaining diets. Arch Biochem Biophys 1959;83:521–527 [DOI] [PubMed] [Google Scholar]
- 10.Orentreich N, Matias JR, DeFelice A, Zimmerman JA. Low methionine ingestion by rats extends life span. J Nutr 1993;123:269–274 [DOI] [PubMed] [Google Scholar]
- 11.Richie JP, Jr, Leutzinger Y, Parthasarathy S, Malloy V, Orentreich N, Zimmerman JA. Methionine restriction increases blood glutathione and longevity in F344 rats. FASEB J 1994;8:1302–1307 [DOI] [PubMed] [Google Scholar]
- 12.Miller RA, Buehner G, Chang Y, Harper JM, Sigler R, Smith-Wheelock M. Methionine-deficient diet extends mouse lifespan, slows immune and lens aging, alters glucose, T4, IGF-I and insulin levels, and increases hepatocyte MIF levels and stress resistance. Aging Cell 2005;4:119–125 [DOI] [PMC free article] [PubMed] [Google Scholar]
- 13.Sun L, Sadighi Akha AA, Miller RA, Harper JM. Life-span extension in mice by preweaning food restriction and by methionine restriction in middle age. J Gerontol A Biol Sci Med Sci 2009;64:711–722 [DOI] [PMC free article] [PubMed] [Google Scholar]
- 14.Grandison RC, Piper MD, Partridge L. Amino-acid imbalance explains extension of lifespan by dietary restriction in Drosophila. Nature 2009;462:1061–1064 [DOI] [PMC free article] [PubMed] [Google Scholar]
- 15.Malloy VL, Krajcik RA, Bailey SJ, Hristopoulos G, Plummer JD, Orentreich N. Methionine restriction decreases visceral fat mass and preserves insulin action in aging male Fischer 344 rats independent of energy restriction. Aging Cell 2006;5:305–314 [DOI] [PubMed] [Google Scholar]
- 16.Zimmerman JA, Malloy V, Krajcik R, Orentreich N. Nutritional control of aging. Exp Gerontol 2003;38:47–52 [DOI] [PubMed] [Google Scholar]
- 17.Hasek BE, Stewart LK, Henagan TM, et al. Dietary methionine restriction enhances metabolic flexibility and increases uncoupled respiration in both fed and fasted states. Am J Physiol Regul Integr Comp Physiol 2010;299:R728–R739 [DOI] [PMC free article] [PubMed] [Google Scholar]
- 18.Anthony TG, Morrison CD, Gettys TW. Remodeling of lipid metabolism by dietary restriction of essential amino acids. Diabetes 2013;62:2635–2644 [DOI] [PMC free article] [PubMed] [Google Scholar]
- 19.Plaisance EP, Henagan TM, Echlin H, et al. Role of β-adrenergic receptors in the hyperphagic and hypermetabolic responses to dietary methionine restriction. Am J Physiol Regul Integr Comp Physiol 2010;299:R740–R750 [DOI] [PMC free article] [PubMed] [Google Scholar]
- 20.Plaisance EP, Greenway FL, Boudreau A, et al. Dietary methionine restriction increases fat oxidation in obese adults with metabolic syndrome. J Clin Endocrinol Metab 2011;96:E836–E840 [DOI] [PMC free article] [PubMed] [Google Scholar]
- 21.Perrone CE, Mattocks DA, Hristopoulos G, Plummer JD, Krajcik RA, Orentreich N. Methionine restriction effects on 11 -HSD1 activity and lipogenic/lipolytic balance in F344 rat adipose tissue. J Lipid Res 2008;49:12–23 [DOI] [PubMed] [Google Scholar]
- 22.Perrone CE, Mattocks DA, Jarvis-Morar M, Plummer JD, Orentreich N. Methionine restriction effects on mitochondrial biogenesis and aerobic capacity in white adipose tissue, liver, and skeletal muscle of F344 rats. Metabolism 2010;59:1000–1011 [DOI] [PubMed] [Google Scholar]
- 23.Prpic V, Watson PM, Frampton IC, Sabol MA, Jezek GE, Gettys TW. Differential mechanisms and development of leptin resistance in A/J versus C57BL/6J mice during diet-induced obesity. Endocrinology 2003;144:1155–1163 [DOI] [PubMed] [Google Scholar]
- 24.Zhang Y, Huypens P, Adamson AW, et al. Alternative mRNA splicing produces a novel biologically active short isoform of PGC-1α. J Biol Chem 2009;284:32813–32826 [DOI] [PMC free article] [PubMed] [Google Scholar]
- 25.Zhao X, Feng D, Wang Q, et al. Regulation of lipogenesis by cyclin-dependent kinase 8-mediated control of SREBP-1. J Clin Invest 2012;122:2417–2427 [DOI] [PMC free article] [PubMed] [Google Scholar]
- 26.Hulver MW, Berggren JR, Carper MJ, et al. Elevated stearoyl-CoA desaturase-1 expression in skeletal muscle contributes to abnormal fatty acid partitioning in obese humans. Cell Metab 2005;2:251–261 [DOI] [PMC free article] [PubMed] [Google Scholar]
- 27.Frisard MI, McMillan RP, Marchand J, et al. Toll-like receptor 4 modulates skeletal muscle substrate metabolism. Am J Physiol Endocrinol Metab 2010;298:E988–E998 [DOI] [PMC free article] [PubMed] [Google Scholar]
- 28.Heilbronn LK, Civitarese AE, Bogacka I, Smith SR, Hulver M, Ravussin E. Glucose tolerance and skeletal muscle gene expression in response to alternate day fasting. Obes Res 2005;13:574–581 [DOI] [PubMed] [Google Scholar]
- 29.Srere PA, Matsuoka Y. Inhibition of rat citrate synthase by acetoacetyl CoA and NADH. Biochem Med 1972;6:262–266 [DOI] [PubMed] [Google Scholar]
- 30.Kaaman M, Sparks LM, van Harmelen V, et al. Strong association between mitochondrial DNA copy number and lipogenesis in human white adipose tissue. Diabetologia 2007;50:2526–2533 [DOI] [PubMed] [Google Scholar]
- 31.Elshorbagy AK, Valdivia-Garcia M, Mattocks DA, et al. Cysteine supplementation reverses methionine restriction effects on rat adiposity: significance of stearoyl-coenzyme A desaturase. J Lipid Res 2011;52:104–112 [DOI] [PMC free article] [PubMed] [Google Scholar]
- 32.Postic C, Girard J. Contribution of de novo fatty acid synthesis to hepatic steatosis and insulin resistance: lessons from genetically engineered mice. J Clin Invest 2008;118:829–838 [DOI] [PMC free article] [PubMed] [Google Scholar]
- 33.Deval C, Chaveroux C, Maurin AC, et al. Amino acid limitation regulates the expression of genes involved in several specific biological processes through GCN2-dependent and GCN2-independent pathways. FEBS J 2009;276:707–718 [DOI] [PubMed] [Google Scholar]
- 34.Palii SS, Kays CE, Deval C, Bruhat A, Fafournoux P, Kilberg MS. Specificity of amino acid regulated gene expression: analysis of genes subjected to either complete or single amino acid deprivation. Amino Acids 2009;37:79–88 [DOI] [PMC free article] [PubMed] [Google Scholar]
- 35.Shan J, Ord D, Ord T, Kilberg MS. Elevated ATF4 expression, in the absence of other signals, is sufficient for transcriptional induction via CCAAT enhancer-binding protein-activating transcription factor response elements. J Biol Chem 2009;284:21241–21248 [DOI] [PMC free article] [PubMed] [Google Scholar]
- 36.Dudek SM, Semenkovich CF. Essential amino acids regulate fatty acid synthase expression through an uncharged transfer RNA-dependent mechanism. J Biol Chem 1995;270:29323–29329 [DOI] [PubMed] [Google Scholar]
- 37.Inokuma K, Ogura-Okamatsu Y, Toda C, Kimura K, Yamashita H, Saito M. Uncoupling protein 1 is necessary for norepinephrine-induced glucose utilization in brown adipose tissue. Diabetes 2005;54:1385–1391 [DOI] [PubMed] [Google Scholar]
- 38.Yu XX, Lewin DA, Forrest W, Adams SH. Cold elicits the simultaneous induction of fatty acid synthesis and beta-oxidation in murine brown adipose tissue: prediction from differential gene expression and confirmation in vivo. FASEB J 2002;16:155–168 [DOI] [PubMed] [Google Scholar]
- 39.Bartelt A, Bruns OT, Reimer R, et al. Brown adipose tissue activity controls triglyceride clearance. Nat Med 2011;17:200–205 [DOI] [PubMed] [Google Scholar]


