

Abstract
Intensive diabetes therapy reduces the prevalence of coronary calcification and progression of atherosclerosis and the risk of cardiovascular disease (CVD) events in the Diabetes Control and Complications Trial (DCCT)/Epidemiology of Diabetes Interventions and Complications (EDIC) study. The effects of intensive therapy on measures of cardiac function and structure and their association with glycemia have not been explored in type 1 diabetes (T1DM). We assess whether intensive treatment compared with conventional treatment during the DCCT led to differences in these parameters during EDIC. After 6.5 years of intensive versus conventional therapy in the DCCT, and 15 years of additional follow-up in EDIC, left ventricular (LV) indices were measured by cardiac magnetic resonance (CMR) imaging in 1,017 of the 1,371 members of the DCCT cohort. There were no differences between the DCCT intensive versus conventional treatment in end diastolic volume (EDV), end systolic volume, stroke volume (SV), cardiac output (CO), LV mass, ejection fraction, LV mass/EDV, or aortic distensibility (AD). Mean DCCT/EDIC HbA1c over time was associated with EDV, SV, CO, LV mass, LV mass/EDV, and AD. These associations persisted after adjustment for CVD risk factors. Cardiac function and remodeling in T1DM assessed by CMR in the EDIC cohort was associated with prior glycemic exposure, but there was no effect of intensive versus conventional treatment during the DCCT on cardiac parameters.
Cardiovascular disease (CVD) is a major complication of type 1 diabetes (T1DM) (1) and, relatively, even a greater risk than in type 2 diabetes (2,3). T1DM increases the risk of CVD, independent of other common risk factors (4), and these CVD complications have a large impact on mortality and morbidity (5–7); the risk of death from coronary artery disease (CAD) is increased 9–29 times in women and 4–9 times in men with T1DM compared with nondiabetic individuals (1). The prevalence of left ventricular (LV) hypertrophy on electrocardiogram (ECG) is increased threefold (8).
Hyperglycemia has been associated with CVD in some (9,10), but not all, studies (11,12). The Diabetes Control and Complications Trial (DCCT)/Epidemiology of Diabetes Interventions and Complications (EDIC) study observed association between glycemia and CVD events was partially mediated through its effect on nephropathy (10). DCCT/EDIC also found correlations of glycemic levels with measures of atherosclerosis, such as carotid intima-media thickness (IMT) (13) and coronary artery calcification (CAC) (14). More importantly, the DCCT/EDFIC study has reported that intensive compared with conventional treatment during the DCCT was associated with a 57% reduction (95% CI 12–79, P = 0.02) in a composite CVD outcome of nonfatal myocardial infarction (MI), stroke, or cardiovascular death from baseline DCCT through 11 years of EDIC (10) Nephropathy is the single greatest risk factor previously identified for CVD and CAD (15), increasing the incidence of CVD 8–10-fold and of mortality sevenfold over diabetic patients without nephropathy (16). Even without nephropathy, people with T1DM have an increased incidence of CVD (15,16), and poor glycemic control predicts coronary heart disease events (17).
Although congestive heart failure (CHF) frequently used to follow MI in T1DM (18) before current improvements in care of MI, the clinical significance of basal cardiac dysfunction in T1DM individuals has yet to be determined. As improved prevention and management of CAD continue to extend life expectancy, CHF may emerge as a more frequent and life-threatening complication of T1DM.
To determine whether intensive therapy in the DCCT also affected cardiac function and remodeling (the ratio of LV mass to end diastolic volume [EDV]), we have measured LV functional parameters and remodeling by cardiac magnetic resonance (CMR) imaging, which is accepted as the gold standard (19,20), in 1,017 DCCT/EDIC patients with T1DM.
RESEARCH DESIGN AND METHODS
Study population.
The DCCT and EDIC studies have been described previously in detail (21,22). Between 1983 and 1989, 1,441 patients (13–39 years of age) with T1DM were randomly assigned intensive insulin versus conventional therapy to compare the effects on the development and progression of microvascular complications. At baseline (1983–1989), all patients were free of a history of CVD, hypertension, and hypercholesterolemia. DCCT participants were recruited into a primary prevention cohort (1–5 years diabetes duration and no retinopathy or microalbuminuria at baseline) or into a secondary intervention cohort (1–15 years duration, minimal to moderate retinopathy, and ≤200 mg/24 h albuminuria at baseline). After 6.5 years of randomized intervention, retinopathy, nephropathy, and neuropathy were significantly reduced by ∼50% by intensive treatment.
EDIC began in 1994 as a prospective observational follow-up of the DCCT cohort. At the time of CMR (EDIC years 14–16), 1,301 participants (94% of 1,371 survivors) across 28 clinics were active (Fig. 1). Of these, 1,259 participants (97%) were eligible for the CMR study, and of these, 1,122 (89%) gave informed consent. An additional 94 participants were excluded: 53 (4%) due to claustrophobia, 9 (0.7%) had metallic foreign bodies, 5 (0.4%) had body weight that exceeded the capacity of the scanner, and 27 (3%) were not completed for other reasons. Eleven (0.9%) uninterpretable MR scans were further excluded, resulting in a diagnostic CMR for 1,017 participants (74% of those surviving and 81% of those screened).
FIG. 1.

CMR participants/nonparticipants.
Study procedures.
During DCCT, participants had an annual medical history and physical examination, electrocardiography, and laboratory testing for fasting lipid levels, serum creatinine, urinary albumin excretion (AER), and other risk factors for CVD (21). Glycated hemoglobin values (HbA1c) (23) were measured quarterly during DCCT (21). Hypertension was defined as blood pressure (BP) ≥140/90 mmHg or use of antihypertensive medications (21,22). Hypercholesterolemia was defined as LDL levels ≥130 mg/dL or use of lipid-lowering medication (21,22).
During EDIC, annual medical histories were obtained, physical exams were performed, and HbA1c levels and serum creatinine were measured. Lipid profiles and urinary AER were measured in alternate years (22). BP was measured with a standardized protocol by trained and certified study nurse coordinators using mercury manometers during the DCCT and aneroid manometers during EDIC in the right arm with the arm flexed slightly and with the forearm supported at heart level. The overall time-weighted mean BP measurements every 3 months during DCCT and every 12 months during EDIC were used in the analyses of risk factors. Weighted mean laboratory values over the study duration were computed with weights proportional to the time interval between values. ECGs were obtained at baseline, every 2 years during DCCT, at closeout of DCCT, and annually during EDIC. ECGs are centrally read and classified using the revised Minnesota code (24,25).
Assessment of CVD events and other diabetes complications.
Complications were assessed cumulatively from DCCT entry to the current study. CVD includes nonfatal MI (clinical MI), silent MI (ECG diagnosed), revascularization (angioplasty or bypass), confirmed angina, nonfatal cerebrovascular event, CHF (ascertainment starting in 2007, EDIC year 13), and cardiovascular death (10). CVD events were adjudicated based on medical records, ECG findings, and cardiac enzyme levels, masked to DCCT treatment group assignment, HbA1c, and glucose levels. CHF was defined as at least one symptom of the following two categories: category A, paradoxysmal nocturnal dyspnea, dyspnea at rest, or orthopnea; category B, marked limitation of physical activity caused by heart disease (patients are comfortable at rest, but less than ordinary physical activity caused fatigue, shortness of breath, palpitations, or anginal pain; New York Heart Association Functional Classification III). Proliferative diabetic retinopathy, sustained microalbuminuria or macroalbuminuria at any two consecutive visits, or end-stage renal disease (ESRD) were as previously defined (26). Neuropathy included cardiac autonomic neuropathy (CAN) as previously defined (26).
CMR imaging.
Participants underwent CMR with 1.5 or 3.0 Tesla magnets using the same standard protocol (27) at each site. In brief, a stack of short axis images covering the entire left ventricle was acquired to determine LV mass, volumes, and function (temporal resolution ≤50 ms). All CMR studies were evaluated at the Johns Hopkins core reading center by readers masked to risk factor information. The endocardial and epicardial myocardial borders were contoured using a semiautomated method (QMASS version 6; Medis, Leiden, the Netherlands). LV mass was calculated as the difference between epicardial and endocardial areas for all slices multiplied by slice thickness and slice gap and then multiplied by the specific gravity of the myocardium (1.04 g/mL). Papillary muscles included in the LV cavity were excluded from LV mass. Reread of 100 CMR scans revealed an intraclass correlation range from 0.917 to 0.978 and the relative technical errors of measurement of the mean were 4.5 and 3.2% for LV mass and volume, respectively (27).
ECG-gated phase-contrast cine images of ascending thoracic aorta were obtained in the axial plane at the level of the right pulmonary artery. Minimum and maximum cross-sectional areas were determined using QFLOW software (version 5.1; Medis). Ascending thoracic aortic distensibility (AD) was calculated using a validated formula (28,29): AD = (maximum area − minimum area)/[(minimum area) × ΔP], where ΔP is the pulse pressure obtained by subtracting diastolic BP (DBP) from systolic BP (SBP). The average of two supine BP measurements by a standardized protocol immediately before and after the CMR examination on the scanner gantry was used as the final BP measurement.
Statistical analysis.
Group differences were assessed using Wilcoxon rank sum tests for quantitative variables and χ2 tests or Fisher exact test for categorical variables. The difference between groups for event times was assessed using the log-rank test (30), for prevalences using logistic regression (30), and for least squares mean (LSM) of a quantitative outcome using a normal errors linear regression model (31). Eight cardiac outcomes were evaluated according to the intent to treat principle (EDV, end systolic volume [ESV], stroke volume [SV], cardiac output [CO], LV mass, ejection fraction [EF], LV mass/EDV, and AD). The natural log transformation was used for AD, and its geometric mean is presented. LSM values within groups were obtained from a multivariate linear regression model (31). Treatment group differences were assessed in models minimally adjusted for CMR machine type, age, sex, height, weight, and study cohort. Treatment group differences nested within the levels of other factors were obtained using interaction terms in the model.
Additional models included traditional cardiovascular risk factors: a history of smoking ever, the weighted mean SBP, LDL, and HDL. The weighted mean values allowed for differences in the frequency of measurements during DCCT and EDIC up to the EDIC year of the CMR study or immediately prior to CMR (30). Backward elimination of traditional risk factors was used to examine how each risk factor affected the relationship of cardiac outcomes with glycemic exposure.
Treatment groups were also compared in multivariate analyses of the set of cardiac outcomes simultaneously using the first principal component that explained 42% of the variation, an O'Brien weighted least squares summary statistic (32), and a multivariate mixed model assuming a compound symmetry covariance structure (33). A “worst rank analysis” (34) was conducted in which a subject with a missing CMR examination but with a prior CVD event was assigned a tied rank worse than that of any patient with a measured CMR. For this and the O’Brien analysis, lower values of SV, CO, EF, or AD, and higher values of the other variables were considered worse. A multivariate Wei-Lachin test of stochastic ordering was then applied (35). These analyses also used minimally adjusted values.
All analyses were performed using SAS software (version 9.2; SAS Institute, Cary, NC). P values <0.05 were considered as statistically significant.
RESULTS
Patient characteristics.
Participants and nonparticipants in CMR scanning had similar DCCT baseline characteristics except that the nonparticipants had more smokers (23.4 vs. 16.4%), higher HbA1c (9.2 vs. 8.8%), higher triglycerides (87 vs. 79 mg/dL), and greater prevalence of microalbuminuria (13.9 vs. 9.6%) (Table 1). No treatment group differences in baseline characteristics were observed among either the participants (Table 1) or the nonparticipants (data not shown).
TABLE 1.
DCCT baseline characteristics among CMR participants/nonparticipants

At the time of CMR, the participants had a mean age of 49 years and a mean diabetes duration of 28 years and were 48% female (Table 2). Sixty-seven CMR participants had previous CVD events. HbA1c levels at the visit prior to the CMR were similar in the original intensive and conventional treatment groups. However, the mean HbA1c over the entire DCCT/EDIC study period was significantly lower in the original intensive group compared with the conventional group (7.7 ± 0.9 vs. 8.3 ± 0.9%, P < 0.0001). DCCT conventionally treated participants had a greater prevalence of retinopathy, nephropathy, and neuropathy compared with intensively treated participants.
TABLE 2.
Clinical characteristics and complications by treatment group at the time of CMR imaging
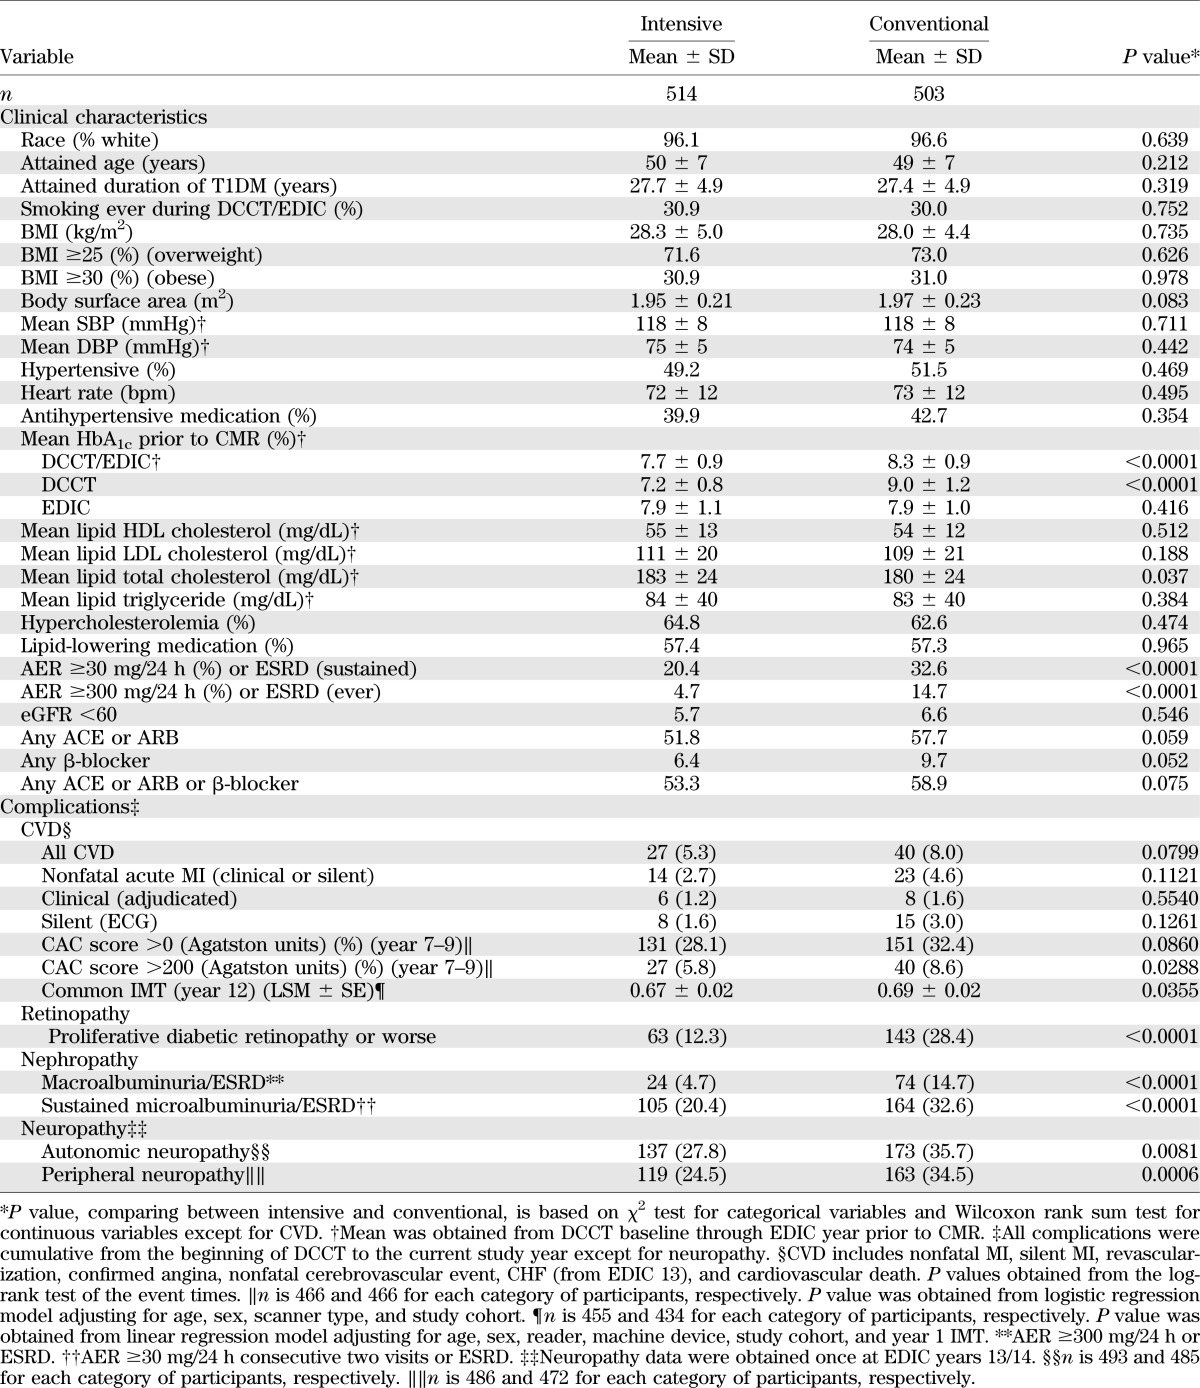
Conventional group participants had a greater common carotid IMT and CAC score and had a higher, though not statistically significant, incidence of CVD events than the intensive group participants. About half of both groups were taking ACE inhibitor/angiotensin receptor blocker (ARB) drugs, but their HbA1c levels were similar (Supplementary Table 1).
Cardiac function by DCCT original treatment group and prior CVD history.
Table 3 compares LSM from minimally adjusted intention-to-treat analyses of the cardiac eight parameters by treatment group and by presence/absence of prior CVD. Treatment group differences were not significant for any cardiac function parameters. Among the majority of participants (950) who had not experienced a CVD event, there likewise were no differences between the two treatment groups. However, those with prior CVD had significantly higher LV ESV (57.7 vs. 52.5 mL) and LV mass (145.5 vs.137.5 g), lower EF (59.8 vs. 61.8%), and a trend toward higher EDV.
TABLE 3.
LSM* of cardiac parameters by treatment group and prior CVD

Cardiac function in relation to glycemic exposure.
The complete period of prior glycemic exposure, as measured by the mean DCCT/EDIC HbA1c, had a stronger effect (highest estimate and smallest P value) on most cardiac function measures than the mean DCCT HbA1c or mean EDIC HbA1c (Table 4). EDV, SV, and AD were negatively associated with mean HbA1c, whereas CO, LV mass, and LV mass/EDV ratio were positively associated with mean HbA1c in all three HbA1c periods. For example, EDV decreased by 2.61 mL per 1% absolute increase of mean DCCT/EDIC HbA1c (P = 0.0003), whereas LV mass increased by 2.68 g per 1% increase of mean DCCT/EDIC HbA1c (P = 0.0002). These associations were unchanged after adjusting for a history of hypoglycemia manifested by coma or seizure (none, one to five, and more than five prior episodes). Addition of either BMI as a continuous variable or obesity (BMI ≥30) as a categorical variable in place of height and weight did not change the significance of the associations of DCCT/EDIC HbA1c with any of the cardiac parameters. Notably, there was no significant association between the important cardiac functional parameter, EF, or ESV and the mean HbA1c during DCCT, EDIC, or DCCT/EDIC.
TABLE 4.
Effect of glycemic exposure on cardiac parameters*

Additional models also assessed the effect of mean HbA1c during EDIC periods ranging from 1 to 12 years prior to the CMR. No trend was observed except for LV mass for which the HbA1c over the prior year had no significant association (estimate = 0.64 g per HbA1c %), but the estimate increased to 2.09 g per HbA1c % over 12 years (data not shown).
After further adjustment for traditional CVD risk factors (smoking ever, mean SBP, LDL, and HDL), the DCCT/EDIC HbA1c remains significantly associated with EDV, SV, LV mass/EDV ratio, and AD, whereas the association was diminished for CO and LV mass (Table 5). The traditional risk factors were also significantly associated with some parameters even after adjustment for HbA1c.
TABLE 5.
Full models*: effect of glycemic exposure on cardiac parameters after adjusting for traditional cardiovascular risk factors

Additional models also adjusted for either a history of microalbuminuria or macroalbuminuria. Of the four parameters significantly associated with HbA1c in Table 5, microalbuminuria and macroalbuminuria were significantly associated with LV mass/EDV, and macroalbuminuria was significantly associated with log(AD). In each case, the effect of the mean HbA1c remained significant after adjustment for albuminuria. The effect of the mean HbA1c on all cardiac functions remained the same as shown in Table 5 after further adjustment for use of antihypertensive and lipid-lowering medications.
Multivariate analyses of all cardiac functions in aggregate.
The DCCT treatment groups were also compared using all eight CMR characteristics jointly in multivariate analyses, and in worst rank analyses in which subjects without the CMR but with a history of CVD event(s) were assigned a worse rank than subjects with the CMR assessments (see research design and methods). No significant treatment group differences were observed.
DISCUSSION
This is the first report of cardiac function and remodeling parameters and their response to different previous glycemic strategies in a large cohort of patients with T1DM. The EDIC cohort provides detailed phenotypic, CVD, and biochemical data over a 22-year period, which included an initial 6.5-year period of randomly assigned intensive or conventional treatment of hyperglycemia. During DCCT, mean HbA1c levels were 7.4 and 9.1% respectively. During most of the EDIC observational follow-up (36), glycemic management was by community health caregivers and resulted in similar mean HbA1c levels of ∼8.0%.
Previous studies have demonstrated persistent effects of the original DCCT treatment assignment on microvascular outcomes (36,37), neuropathic outcomes (38–40), subclinical atherosclerosis (carotid IMT [13] and CAC scores [14]), and cardiovascular events (10). Based on these consistent observations, there was a reasonable expectation that we might also observe differences in cardiac parameters between the former DCCT intensive and conventional groups.
However, the current results do not support an effect of prior intensive versus conventional treatment on cardiac measured function/structure parameters. After 6.5 years of glycemic separation and 15 years of further observation, during which glycemic separation dissipated, no long-term effect of intensive treatment was detected on any of the cardiac parameters or AD. All measured volumes, CO, EF, LV mass, and LV mass/EDV ratio were similar between intensive and conventional groups.
In contrast, the mean DCCT, EDIC, and DCCT/EDIC HbA1c values were significantly related to myocardial structure and function. Both SBP and smoking were also nominally associated with CO, LV mass, and LV mass/EDV, but the DCCT/EDIC mean HbA1c remained significant only for LV mass/EDV after adjustment for these factors. In addition, mean HbA1c remained significantly associated with some CMR parameters after adjustment for either prior microalbuminuria or macroalbuminuria.
There are at least three possible reasons for the lack of consistently different effects between the DCCT intensive and conventional treatment on CMR functional and structural parameters. First, unlike every other complication of T1DM we have measured, intensive therapy during the DCCT may not have conferred benefit on cardiac function. Second, there may have been a benefit of prior intensive therapy on cardiac function during the DCCT that had dissipated by the time cardiac MRI was performed during EDIC year 15. Third, T1DM may not have an adverse effect on the heart, except via coronary atherosclerosis. This seems unlikely, given recent evidence that hospital admission for CHF in T1DM was increased ∼30-fold over a similar age-group of nondiabetic people around age 40 (41). Moreover, this incidence was increased 30% for each 1% increment in HbA1c, independent of ischemic heart disease or prior MI (41). Possible intrinsic microvascular disease has been suggested by a deficit in myocardial energy production shown by CMR and 31P spectroscopy in young T1DM individuals without apparent CAD and correlated with HbA1c (42).
In the absence of CMR measurements at the close of the DCCT and periodically during EDIC, it is impossible to distinguish between the first two alternatives. Other data suggest that any beneficial effects of intensive therapy during the DCCT on retinopathy (37) and progression of carotid IMT (43) may have waned over time. Moreover, the CMR studies reported here were performed 15 years after DCCT treatment was discontinued, whereas benefits of prior intensive therapy are last documented on microvascular outcomes at 10 years post-DCCT (37,38), carotid IMT at 12 years (43), CAC at 8 years (14), and CVD events at 11 years (10).
The mean values of the EDIC cardiac parameters after 27 years duration of T1DM are within the ranges reported in the Multi-Ethnic Study of Atherosclerosis (MESA) study of CMR in individuals without diabetes or CVD events at around a similar age of 50 as our EDIC subjects (44). They are also similar to these cardiac parameter ranges measured by echocardiography in normal individuals (45). Another recent echocardiographic study has shown no significant differences in cardiac parameters between a well-controlled T1DM group of 9 years duration and an age/sex-matched control group (46). Furthermore, the adverse directional changes for each absolute 1% increase in HbA1c are modest and of little clinical significance. Moreover, the important mean EF values in our study were solidly normal, and EF was not associated with HbA1c. These observations may bode well for 27-year-duration T1DM individuals with regard to future risk of CHF, so long as their glycemic control does not deteriorate. Whether the small number of participants with EF <50% are at greater future clinical risk of CHF can only be determined by further long-term follow-up. From EDIC year 13 on, only one individual had suffered CHF by the time of the CMR. There were five further cases reported since then.
Interestingly, however, our data demonstrate that glycemia is a significant factor impacting cardiac function. The mean HbA1c over DCCT and EDIC (22 years) was positively correlated with LV mass and LV mass/EDV and negatively correlated with EF and SV. These observations indicate that cardiac function and LV remodeling are influenced by prolonged elevated HbA1c levels. These correlations would signify impairment, although very slight and not clinically significant, of cardiac function secondary to long-term glycemic exposure. The paradoxical negative association between HbA1c and SV but positive association between HbA1c and CO may be partly explained by the positive association between HbA1c and heart rate (Spearman correlation coefficient 0.18 for current HbA1c and 0.23 for weighted mean DCCT/EDIC HbA1c, P < 0.005 for both). The impact of HbA1c on AD may reflect cross-linking of glycated collagen by advanced glycation end products (47) in arterial walls (48).
The results of CMR studies may differ from measures of subclinical atherosclerosis and/or CVD events if factors affecting cardiac muscle function are distinct from those that modulate atherosclerotic CVD (42). However, traditional CVD risk factors (age, sex, smoking status, lipids, and hypertension) for atherosclerosis also strongly influenced cardiac size and function in our cohort. Moreover, the presence of nephropathy (macroalbuminuria) was the strongest determinant of LV mass and was also associated with LV concentric remodeling.
It also seemed possible that any putative beneficial effects of intensive therapy on the heart were confounded by a deleterious effect, such as the threefold increase in hypoglycemia that accompanies intensive therapy (26). Hypoglycemia is known to have an adverse effect on the heart (49). However, adjustment for episodes of severe hypoglycemia did not change the relationship between glycemic exposure and cardiac function.
Only 74% of the survivors of the DCCT/EDIC cohort completed the cardiac MRI. Reasons for nonparticipation included inability to tolerate the CMR procedure and contraindications to CMR because of metallic implants, etc. Nonparticipants had somewhat higher mean HbA1c at DCCT baseline than those that did participate (9.2 vs. 8.8%) and a slightly worse CVD profile, suggesting that those who might have benefited the most from intensive therapy could have been excluded from the CMR analyses.
Finally, among subjects who underwent CMR, fewer intensive than conventional therapy subjects had a previous CVD event (5.25 vs. 7.95%). However, this small difference would be expected to lead to a beneficial difference in cardiac parameters in favor of the intensive group. Likewise, among those who did not complete the CMR, 60 had a history of a CVD event, again with fewer patients in the intensive than the conventional group (25 vs. 35). If these subjects had been measured with CMR, it is possible that the larger number in the conventional group could have led to group differences in some outcomes. Thus, further analyses were conducted including these 60 subjects with a prior CVD history and assigning them worse rank scores than those of subjects who completed the CMR. However, these analyses failed to demonstrate a benefit of intensive therapy on cardiac function.
Other clinical factors that could have influenced our findings are obesity, CAN, and the use of renin-angiotensin system modulators. Obesity did not differ between the two treatment groups at the time of CMR or contribute to the association of cardiac parameters with HbA1c. The addition of CAN to the HbA1c models had a significant association to CO, LV mass, and AD. However, the associations with HbA1c were largely unchanged (Supplementary Table 2). The use of ACE inhibitor/ARBs was not significantly associated with HbA1c.
The frequent presence of hypertension, dyslipidemia, and obesity could have influenced LV mass, EF, and LV mass/EDV. That these risk factors were not more frequently abnormal may be a testament to how adherent our participants have been to prescribed antihypertensive drugs and statins, as reflected in their mean SBP (118 mmHg), DBP (70 mmHg), LDL cholesterol (110 mg/dL), and HDL cholesterol (54 mg/dL).
Certain limitations to this study should be noted. The CMR participants were self-selected from the DCCT/EDIC cohort, which is a largely Caucasian research-minded group (50) above average in education (51), so our results may not be generalizable to the entire T1DM population. Participants with estimated glomerular filtration rate (eGFR) <60 mL/min were excluded from the gadolinium injection portion of the CMR procedure for safety reasons to prevent nephrofibrosis, but virtually all of these subjects underwent the rest of the CMR. Peripheral brachial BP was used to calculate AD, rather than central arterial BP, but this calculation has been used before in other studies (52–54). Diastolic dysfunction was not assessed, although this impairment has been found in T1DM individuals (55,56). We were also unable to recruit our own age- and sex-matched normal subjects but have compared our T1DM results to those of normal subjects in the literature.
Conclusions.
Fifteen years after the cessation of DCCT randomized glycemic treatment, there was no observable beneficial effect of intensive treatment of TIDM on cardiac function or remodeling assessed by CMR in the EDIC cohort. However, a significant association between some cardiac parameters and glycemic exposure was observed. Continued long-term follow-up of the DCCT/EDIC cohort will be necessary to discern whether these MRI measurements predict clinically relevant CHF.
ACKNOWLEDGMENTS
The DCCT/EDIC project is supported by contracts with the Division of Diabetes, Endocrinology, and Metabolic Diseases of the National Institute of Diabetes and Digestive and Kidney Diseases (NIDDK), the National Eye Institute, the National Institute of Neurological Disorders and Stroke, the General Clinical Research Centers Program and the Clinical and Translation Science Centers Program, the National Center for Research Resources, and Genentech through a Cooperative Research and Development Agreement with the NIDDK.
Industry contributors have had no role in the conduct of EDIC but have offered free or discounted supplies or equipment as a thank you to participants: Abbott, Animas, Aventis, Bayer, Becton Dickinson, CanAm, Eli Lilly and Company, LifeScan, Medtronic Diabetes, MiniMed, Omron, OmniPod, Roche, and Sanofi. No other potential conflicts of interest relevant to this article were reported.
The writing committee for the DCCT/EDIC study included S.M.G. (chair), J.-Y.C.B., M.B., D.A.B., P.A.C., J.C., J.M.L., J.A.C.L., C.M., and E.B.T. S.M.G. drafted and edited the manuscript and researched and interpreted the data. J.-Y.C.B. analyzed the data statistically and drafted the manuscript. M.B. reviewed and edited the manuscript. D.A.B. analyzed the CMR data and reviewed and edited the manuscript. P.A.C. collected and organized the data and reviewed the manuscript. J.C. and C.M. reviewed and discussed the manuscript. J.M.L. analyzed the data statistically and reviewed and edited the manuscript. J.A.C.L. and E.B.T. analyzed the CMR data and reviewed the manuscript. P.A.C. is the guarantor of this work and, as such, had full access to all the data in the study and takes responsibility for the integrity of the data and the accuracy of the data analysis.
The authors acknowledge the data processing and technical support of Wanyu Hsu and technical assistance of Mary Hawkins at The Biostatistics Center, The George Washington University.
Footnotes
Clinical trial reg. nos. NCT00360893 and NCT00360815, www.clinicaltrials.gov.
This article contains Supplementary Data online at http://diabetes.diabetesjournals.org/lookup/suppl/doi:10.2337/db12-0546/-/DC1.
*A complete list of the members of the DCCT/EDIC Research Group can be found in the Supplementary Appendix published in the New England Journal of Medicine, 2011;365:2366–2376. A list of the participating radiologists and technologists can be found in the Supplementary Material published in Circulation, 2011;124:1737–1746.
See accompanying commentary, p. 3329.
REFERENCES
- 1.Libby P, Nathan DM, Abraham K, et al. National Heart, Lung, and Blood Institute. National Institute of Diabetes and Digestive and Kidney Diseases Working Group on Cardiovascular Complications of Type 1 Diabetes Mellitus Report of the National Heart, Lung, and Blood Institute-National Institute of Diabetes and Digestive and Kidney Diseases Working Group on cardiovascular complications of type 1 diabetes mellitus. Circulation 2005;111:3489–3493 [DOI] [PubMed] [Google Scholar]
- 2.Stamler J, Vaccaro O, Neaton JD, Wentworth D. Diabetes, other risk factors, and 12-yr cardiovascular mortality for men screened in the Multiple Risk Factor Intervention Trial. Diabetes Care 1993;16:434–444 [DOI] [PubMed] [Google Scholar]
- 3.Haffner SM, Lehto S, Rönnemaa T, Pyörälä K, Laakso M. Mortality from coronary heart disease in subjects with type 2 diabetes and in nondiabetic subjects with and without prior myocardial infarction. N Engl J Med 1998;339:229–234 [DOI] [PubMed] [Google Scholar]
- 4.Eeg-Olofsson K, Cederholm J, Nilsson PM, et al. Glycemic control and cardiovascular disease in 7,454 patients with type 1 diabetes: an observational study from the Swedish National Diabetes Register (NDR). Diabetes Care 2010;33:1640–1646 [DOI] [PMC free article] [PubMed]
- 5.Laing SP, Swerdlow AJ, Slater SD, et al. The British Diabetic Association Cohort Study, I: all-cause mortality in patients with insulin-treated diabetes mellitus. Diabet Med 1999;16:459–465 [DOI] [PubMed] [Google Scholar]
- 6.Laing SP, Swerdlow AJ, Slater SD, et al. Mortality from heart disease in a cohort of 23,000 patients with insulin-treated diabetes. Diabetologia 2003;46:760–765 [DOI] [PubMed] [Google Scholar]
- 7.Livingstone SJ, Looker HC, Hothersall EJ, et al. Risk of cardiovascular disease and total mortality in adults with type 1 diabetes: Scottish registry linkage study. PLoS Med 2012;9:e1001321. [DOI] [PMC free article] [PubMed] [Google Scholar]
- 8.Giunti S, Bruno G, Veglio M, et al. Eurodiab IDDM Complications Study Electrocardiographic left ventricular hypertrophy in type 1 diabetes: prevalence and relation to coronary heart disease and cardiovascular risk factors: the Eurodiab IDDM Complications Study. Diabetes Care 2005;28:2255–2257 [DOI] [PubMed] [Google Scholar]
- 9.Larsen J, Brekke M, Sandvik L, Arnesen H, Hanssen KF, Dahl-Jorgensen K. Silent coronary atheromatosis in type 1 diabetic patients and its relation to long-term glycemic control. Diabetes 2002;51:2637–2641 [DOI] [PubMed] [Google Scholar]
- 10.Nathan DM, Cleary PA, Backlund JY, et al. Diabetes Control and Complications Trial/Epidemiology of Diabetes Interventions and Complications (DCCT/EDIC) Study Research Group Intensive diabetes treatment and cardiovascular disease in patients with type 1 diabetes. N Engl J Med 2005;353:2643–2653 [DOI] [PMC free article] [PubMed] [Google Scholar]
- 11.Koivisto VA, Stevens LK, Mattock M, et al. EURODIAB IDDM Complications Study Group Cardiovascular disease and its risk factors in IDDM in Europe. Diabetes Care 1996;19:689–697 [DOI] [PubMed] [Google Scholar]
- 12.Orchard TJ, Olson JC, Erbey JR, et al. Insulin resistance-related factors, but not glycemia, predict coronary artery disease in type 1 diabetes: 10-year follow-up data from the Pittsburgh Epidemiology of Diabetes Complications Study. Diabetes Care 2003;26:1374–1379 [DOI] [PubMed] [Google Scholar]
- 13.Nathan DM, Lachin J, Cleary P, et al. Diabetes Control and Complications Trial. Epidemiology of Diabetes Interventions and Complications Research Group Intensive diabetes therapy and carotid intima-media thickness in type 1 diabetes mellitus. N Engl J Med 2003;348:2294–2303 [DOI] [PMC free article] [PubMed] [Google Scholar]
- 14.Cleary PA, Orchard TJ, Genuth S, et al. DCCT/EDIC Research Group The effect of intensive glycemic treatment on coronary artery calcification in type 1 diabetic participants of the Diabetes Control and Complications Trial/Epidemiology of Diabetes Interventions and Complications (DCCT/EDIC) Study. Diabetes 2006;55:3556–3565 [DOI] [PMC free article] [PubMed] [Google Scholar]
- 15.Jensen T, Borch-Johnsen K, Kofoed-Enevoldsen A, Deckert T. Coronary heart disease in young type 1 (insulin-dependent) diabetic patients with and without diabetic nephropathy: incidence and risk factors. Diabetologia 1987;30:144–148 [DOI] [PubMed] [Google Scholar]
- 16.Tuomilehto J, Borch-Johnsen K, Molarius A, et al. Incidence of cardiovascular disease in type 1 (insulin-dependent) diabetic subjects with and without diabetic nephropathy in Finland. Diabetologia 1998;41:784–790 [DOI] [PubMed] [Google Scholar]
- 17.Lehto S, Rönnemaa T, Pyörälä K, Laakso M. Poor glycemic control predicts coronary heart disease events in patients with type 1 diabetes without nephropathy. Arterioscler Thromb Vasc Biol 1999;19:1014–1019 [DOI] [PubMed] [Google Scholar]
- 18.Savage MP, Krolewski AS, Kenien GG, Lebeis MP, Christlieb AR, Lewis SM. Acute myocardial infarction in diabetes mellitus and significance of congestive heart failure as a prognostic factor. Am J Cardiol 1988;62:665–669 [DOI] [PubMed] [Google Scholar]
- 19.Pennell DJ. Cardiovascular magnetic resonance: twenty-first century solutions in cardiology. Clin Med 2003;3:273–278 [DOI] [PMC free article] [PubMed] [Google Scholar]
- 20.Constantine G, Shan K, Flamm SD, Sivananthan MU. Role of MRI in clinical cardiology. Lancet 2004;363:2162–2171 [DOI] [PubMed] [Google Scholar]
- 21.The Diabetes Control and Complications Trial (DCCT). Design and methodologic considerations for the feasibility phase. The DCCT Research Group. Diabetes 1986;35:530–545 [PubMed] [Google Scholar]
- 22.Epidemiology of Diabetes Interventions and Complications (EDIC). Design, implementation, and preliminary results of a long-term follow-up of the Diabetes Control and Complications Trial cohort. Diabetes Care 1999;22:99–111 [DOI] [PMC free article] [PubMed] [Google Scholar]
- 23.The DCCT Research Group Feasibility of centralized measurements of glycated hemoglobin in the Diabetes Control and Complications Trial: a multicenter study. Clin Chem 1987;33:2267–2271 [PubMed] [Google Scholar]
- 24.Crow RS, Prineas RJ, Jacobs DR, Jr, Blackburn H. A new epidemiologic classification system for interim myocardial infarction from serial electrocardiographic changes. Am J Cardiol 1989;64:454–461 [DOI] [PubMed] [Google Scholar]
- 25.Prineas RJ, Blackburn HW, Crow RS. The Minnesota Code Manual of Electrocardiographic Findings: Standards and Procedures for Measurement and Classification. Boston, Wright-PSG, 1982 [Google Scholar]
- 26.The Diabetes Control and Complications Trial Research Group The effect of intensive treatment of diabetes on the development and progression of long-term complications in insulin-dependent diabetes mellitus. N Engl J Med 1993;329:977–986 [DOI] [PubMed] [Google Scholar]
- 27.Turkbey EB, Backlund JY, Genuth S, et al. DCCT/EDIC Research Group Myocardial structure, function, and scar in patients with type 1 diabetes mellitus. Circulation 2011;124:1737–1746 [DOI] [PMC free article] [PubMed] [Google Scholar]
- 28.Honda T, Yano K, Matsuoka H, Hamada M, Hiwada K. Evaluation of aortic distensibility in patients with essential hypertension by using cine magnetic resonance imaging. Angiology 1994;45:207–212 [DOI] [PubMed] [Google Scholar]
- 29.Cavalcante JL, Lima JA, Redheuil A, Al-Mallah MH. Aortic stiffness: current understanding and future directions. J Am Coll Cardiol 2011;57:1511–1522 [DOI] [PubMed] [Google Scholar]
- 30.Lachin JM. Biostatistical Methods: The Assessment of Relative Risks. 2nd ed. Hoboken, NJ, John Wiley and Sons, 2011 [Google Scholar]
- 31.Neter J, Kutner M, Nachtsheim C, Wasserman W. Applied Linear Statistical Methods. Chicago, Irwin, 1996 [Google Scholar]
- 32.O’Brien PC. Procedures for comparing samples with multiple endpoints. Biometrics 1984;40:1079–1087 [PubMed] [Google Scholar]
- 33.Demidenko E. Mixed Models: Theory and Applications. New York, Wiley, 2006 [Google Scholar]
- 34.Lachin JM. Worst-rank score analysis with informatively missing observations in clinical trials. Control Clin Trials 1999;20:408–422 [DOI] [PubMed] [Google Scholar]
- 35.Wei LJ, Lachin JM. Two-sample asymptotically distribution-free tests for incomplete multivariate observations. J Am Stat Assoc 1984;79:653–661 [Google Scholar]
- 36.Writing Team for the Diabetes Control and Complications Trial/Epidemiology of Diabetes Interventions and Complications Research Group Effect of intensive therapy on the microvascular complications of type 1 diabetes mellitus. JAMA 2002;287:2563–2569 [DOI] [PMC free article] [PubMed] [Google Scholar]
- 37.White NH, Sun W, Cleary PA, et al. Prolonged effect of intensive therapy on the risk of retinopathy complications in patients with type 1 diabetes mellitus: 10 years after the Diabetes Control and Complications Trial. Arch Ophthalmol 2008;126:1707–1715 [DOI] [PMC free article] [PubMed] [Google Scholar]
- 38.Albers JW, Herman WH, Pop-Busui R, et al. Diabetes Control and Complications Trial /Epidemiology of Diabetes Interventions and Complications Research Group Effect of prior intensive insulin treatment during the Diabetes Control and Complications Trial (DCCT) on peripheral neuropathy in type 1 diabetes during the Epidemiology of Diabetes Interventions and Complications (EDIC) Study. Diabetes Care 2010;33:1090–1096 [DOI] [PMC free article] [PubMed] [Google Scholar]
- 39.Pop-Busui R, Low PA, Waberski BH, et al. DCCT/EDIC Research Group Effects of prior intensive insulin therapy on cardiac autonomic nervous system function in type 1 diabetes mellitus: the Diabetes Control and Complications Trial/Epidemiology of Diabetes Interventions and Complications study (DCCT/EDIC). Circulation 2009;119:2886–2893 [DOI] [PMC free article] [PubMed] [Google Scholar]
- 40.Martin CL, Albers J, Herman WH, et al. DCCT/EDIC Research Group Neuropathy among the diabetes control and complications trial cohort 8 years after trial completion. Diabetes Care 2006;29:340–344 [DOI] [PMC free article] [PubMed] [Google Scholar]
- 41.Lind M, Bounias I, Olsson M, Gudbjörnsdottir S, Svensson AM, Rosengren A. Glycaemic control and incidence of heart failure in 20,985 patients with type 1 diabetes: an observational study. Lancet 2011;378:140–146 [DOI] [PubMed] [Google Scholar]
- 42.Metzler B, Schocke MF, Steinboeck P, et al. Decreased high-energy phosphate ratios in the myocardium of men with diabetes mellitus type I. J Cardiovasc Magn Reson 2002;4:493–502 [DOI] [PubMed] [Google Scholar]
- 43.Polak JF, Backlund JY, Cleary PA, et al. DCCT/EDIC Research Group Progression of carotid artery intima-media thickness during 12 years in the Diabetes Control and Complications Trial/Epidemiology of Diabetes Interventions and Complications (DCCT/EDIC) study. Diabetes 2011;60:607–613 [DOI] [PMC free article] [PubMed] [Google Scholar]
- 44.Natori S, Lai S, Finn JP, et al. Cardiovascular function in multi-ethnic study of atherosclerosis: normal values by age, sex, and ethnicity. AJR Am J Roentgenol 2006;186(Suppl. 2):S357–S365 [DOI] [PubMed] [Google Scholar]
- 45.Connolly H, Oh JK. Echocardiography. In Braunwald’s Heart Disease 9th ed. Philadelphia, Saunders (Elsevier), 2012, p. 200–270 [Google Scholar]
- 46.Di Cori A, Di Bello V, Miccoli R, et al. Left ventricular function in normotensive young adults with well-controlled type 1 diabetes mellitus. Am J Cardiol 2007;99:84–90 [DOI] [PubMed] [Google Scholar]
- 47.Genuth S, Sun W, Cleary P, et al. DCCT Skin Collagen Ancillary Study Group Glycation and carboxymethyllysine levels in skin collagen predict the risk of future 10-year progression of diabetic retinopathy and nephropathy in the diabetes control and complications trial and epidemiology of diabetes interventions and complications participants with type 1 diabetes. Diabetes 2005;54:3103–3111 [DOI] [PMC free article] [PubMed] [Google Scholar]
- 48.Aronson D. Cross-linking of glycated collagen in the pathogenesis of arterial and myocardial stiffening of aging and diabetes. J Hypertens 2003;21:3–12 [DOI] [PubMed] [Google Scholar]
- 49.Desouza CV, Bolli GB, Fonseca V. Hypoglycemia, diabetes, and cardiovascular events. Diabetes Care 2010;33:1389–1394 [DOI] [PMC free article] [PubMed] [Google Scholar]
- 50.Kramer JR, Bayless ML, Lorenzi GM, et al. Participant characteristics and study features associated with high retention rates in a longitudinal investigation of type 1 diabetes mellitus. Clin Trials 2012;9:798–805 [DOI] [PMC free article] [PubMed]
- 51.The Diabetes Control and Complications Trial Research Group Influence of intensive diabetes treatment on quality-of-life outcomes in the diabetes control and complications trial. Diabetes Care 1996;19:195–203 [DOI] [PubMed] [Google Scholar]
- 52.Fagard RH, Pardaens K, Staessen JA, Thijs L. The pulse pressure-to-stroke index ratio predicts cardiovascular events and death in uncomplicated hypertension. J Am Coll Cardiol 2001;38:227–231 [DOI] [PubMed] [Google Scholar]
- 53.Madhavan S, Ooi WL, Cohen H, Alderman MH. Relation of pulse pressure and blood pressure reduction to the incidence of myocardial infarction. Hypertension 1994;23:395–401 [DOI] [PubMed] [Google Scholar]
- 54.Benetos A, Safar M, Rudnichi A, et al. Pulse pressure: a predictor of long-term cardiovascular mortality in a French male population. Hypertension 1997;30:1410–1415 [DOI] [PubMed] [Google Scholar]
- 55.Shishehbor MH, Hoogwerf BJ, Schoenhagen P, et al. Relation of hemoglobin A1c to left ventricular relaxation in patients with type 1 diabetes mellitus and without overt heart disease. Am J Cardiol 2003;91:1514–1517, A9 [DOI] [PubMed] [Google Scholar]
- 56.Ruddy TD, Shumak SL, Liu PP, et al. The relationship of cardiac diastolic dysfunction to concurrent hormonal and metabolic status in type I diabetes mellitus. J Clin Endocrinol Metab 1988;66:113–118 [DOI] [PubMed] [Google Scholar]