

Abstract
OBJECTIVE
Recent studies have reported hemoglobin A1c (HbA1c) differences across ethnic groups that could limit its use in clinical practice. The authors of the A1C-Derived Average Glucose study have advocated to report HbA1c in estimated average glucose (AG) equivalents. The aim of this study was to assess the relationships between HbA1c and the mean of three 7-point self-monitored blood glucose (BG) profiles, and to assess whether estimated AG is an accurate measure of glycemia in different ethnic groups.
RESEARCH DESIGN AND METHODS
We evaluated 1,879 participants with type 2 diabetes in the DURABLE trial who were 30 to 80 years of age, from 11 countries, and, according to self-reported ethnic origin, were Caucasian, of African descent (black), Asian, or Hispanic. We performed logistic regression of the relationship between the mean self-monitored BG and HbA1c, and estimated AG, according to ethnic background.
RESULTS
Baseline mean (SD) HbA1c was 9.0% (1.3) (75 [SD, 14] mmol/mol), and mean self-monitored BG was 12.1 mmol/L (3.1) (217 [SD, 55] mg/dL). In the clinically relevant HbA1c range of 7.0–9.0% (53–75 mmol/mol), non-Caucasian ethnic groups had 0.2–0.5% (2–6 mmol/mol) higher HbA1c compared with Caucasians for a given BG level. At the mean self-monitored BG levels ≤11.6 mmol/L, estimated AG overestimated the actual average BG; at levels >11.6 mmol/L, estimated AG underestimated the actual BG levels.
CONCLUSIONS
For a given degree of glycemia, HbA1c levels vary among different ethnic groups. Ethnicity needs to be taken into account when using HbA1c to assess glycemic control or to set glycemic targets. Estimated AG is not a reliable marker for mean glycemia and therefore is of limited clinical value.
The results of hemoglobin A1c (HbA1c) measurements are used to evaluate quality of glycemic control in individuals with diabetes mellitus (1). However, several studies have reported that HbA1c levels may be significantly higher in non-Caucasian patients with diabetes for a given blood glucose (BG) range (2–4). It has become clear that HbA1c levels not only depend on the long-term BG concentration (5–7) but also may be influenced by genetic factors (8–10) as well as environmental factors such as smoking and obesity (11).
The authors of the A1C-Derived Average Glucose study proposed to translate HbA1c into estimated average glucose (AG) equivalents for monitoring glycemic control (12). They asserted that this could facilitate the patient’s comprehension of the value of a given HbA1c measurement and could be used instead of HbA1c. However, the potential racial and ethnic differences in hemoglobin glycation (3) and the impact of hemoglobin variants and erythrocyte survival on the HbA1c assay (13) suggest that estimated AG may be a biased estimate of mean self-monitored BG (SMBG), depending on the specific ethnic group.
The aims of the current study were to analyze in the participants of the DURABLE trial the relationships between HbA1c and mean SMBG across different ethnic groups with type 2 diabetes and to compare HbA1c-derived estimated AG with mean SMBG to determine whether estimated AG is an accurate measure of glycemia.
RESEARCH DESIGN AND METHODS
The DURABLE trial (assessing the durability of basal vs. Lispro Mix 75/25 insulin efficacy) was a global study with the primary objective of comparing the efficacy, safety, and durability of two starter insulin regimens in patients with type 2 diabetes (14). It enrolled a large, diverse cohort of patients from five continents. The DURABLE trial was conducted in accordance with the International Conference on Harmonization Guidelines for Good Clinical Practice and the Declaration of Helsinki. All sites received approval from Institutional Review Boards, and all patients provided written informed consent. Men and women 30 to 80 years of age with type 2 diabetes and HbA1c >7.0% (53 mmol/mol) with use of at least two oral BG–lowering agents (minimum dose 1,500 mg/day metformin, one-half maximum daily dose sulfonylurea, and/or either 30 mg/day pioglitazone or 4 mg/day rosiglitazone) for at least 90 days immediately before the study were eligible for the study (14). Patients were excluded if they had a history of long-term insulin therapy, BMI >45 kg/m2, recent history of severe hypoglycemic episodes, or history of significant renal, hepatic, hematologic (including hemoglobinopathy, hemolytic anemia, sickle cell anemia, and severe blood loss), oncologic, or cardiac disease. Serum creatinine screening was performed locally for all patients. Metformin-treated patients were excluded if serum creatinine was ≥124 µmol/L (1.4 mg/dL) for women and ≥133 µmol/L (1.5 mg/dL) for men. At study entry, patients self-reported ethnic origin based on the following categories: Caucasian (European, Mediterranean, Middle Eastern), African descent (black), East/Southeast Asian (Myanmarese, Chinese, Japanese, Korean, Mongolian, Vietnamese), Western Asian (Pakistani, Indian Subcontinent), Hispanic (Mexican-American, Mexico, Central and South America), and other (mixed racial parentage, American Indian, Inuit). Because of the heterogeneity of their backgrounds, the small group of 62 individuals reported as "other" is not included in this analysis.
Measurements
Clinical measurements taken at baseline included HbA1c (Bio-Rad Variant HbA1c assay; Bio-Rad Laboratories, Hercules, CA) and fasting BG. HbA1c was measured by Covance regional laboratories, which perform regular interregional quality control in accordance with National Glycohemoglobin Standardization Program Level I certification (Geneva, Switzerland [European samples], Sydney, Australia [Australian samples], Indianapolis, Indiana [North and South American samples], and Singapore [Indian samples]). In this assay, the reference range for HbA1c was 4.3–6.1% (23–43 mmol/mol). Subjects were trained regarding how to monitor their own glucose levels using the glucose meters and how to complete the patient diaries. In the 2 weeks before the baseline visit, patients were instructed to record three 7-point SMBG profiles consisting of three premeal (first measurement required to be fasting) measurements, three 2-h postprandial measurements, and a measurement at 3:00 a.m. with a Roche Active or Roche Aviva BG meter (Roche Diabetes Care, Mannheim, Germany).
Calculations and analysis
The mean SMBGs were calculated with an arithmetic mean based on the three 7-point BG profiles. The estimated AG was calculated by inserting observed HbA1c into the A1C-Derived Average Glucose study linear regression equation (estimated AG [mg/dL] = [28.7 × HbA1c (%)] − 46.7; r = 0.92) (12) and then by converting to mmol/L. A mean BG index that quantifies the difference between mean SMBG and estimated AG for an individual patient was calculated as follows: mean BG index [mmol/L] = estimated AG [mmol/L] − observed mean SMBG [mmol/L].
The baseline characteristics of the participants are presented as mean (SD). Means were compared between ethnic groups with ANOVA. East and West Asian groups were combined for racial/ethnic analyses. The Tukey honestly significant difference test was used to adjust for multiple comparisons. When variables were not normally distributed, medians were compared with nonparametric Kruskal-Wallis test. Fisher exact test was used to analyze categorical variables. Pearson correlation coefficient was used to determine the association between variables. A population linear regression equation was calculated for all ethnic subgroups using the individual mean SMBG values and HbA1c at baseline for each participant. PASW Statistics (version 20; IBM, Armonk, NY) was used to perform all statistical analyses.
RESULTS
A total of 1,879 patients with 7-point SMBG profiles available at baseline were included in the present analysis. The mean age was 57 years; among the entire patient group, 52.4% were men, 66.0% were Caucasian, 16.2% were Asian, 12.0% were Hispanic and 5.8% were of African (black) descent. A comparison of baseline characteristics between ethnic groups is shown in Table 1. At baseline, the median duration of diabetes was 8.0 years, mean (SD) BMI was 31.7 kg/m2 (6.0 kg/m2) and mean HbA1c was 9.0% (1.3) (75 [SD, 14] mmol/mol). Asian patients had significantly higher postprandial BG levels than Caucasians. Mean HbA1c levels were significantly higher in Hispanic and Asian participants compared with Caucasians.
Table 1.
Baseline characteristics of the study population by ethnicity
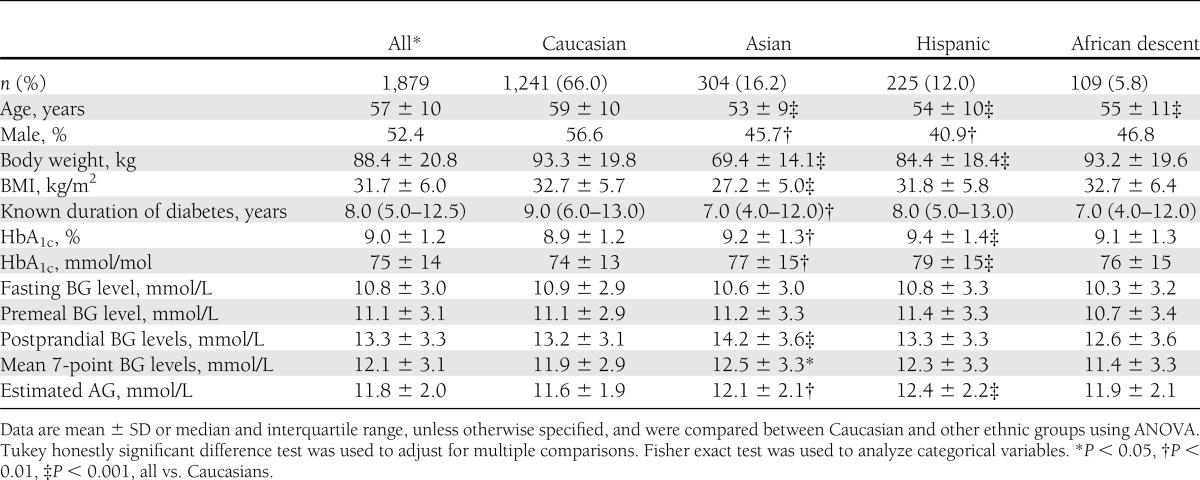
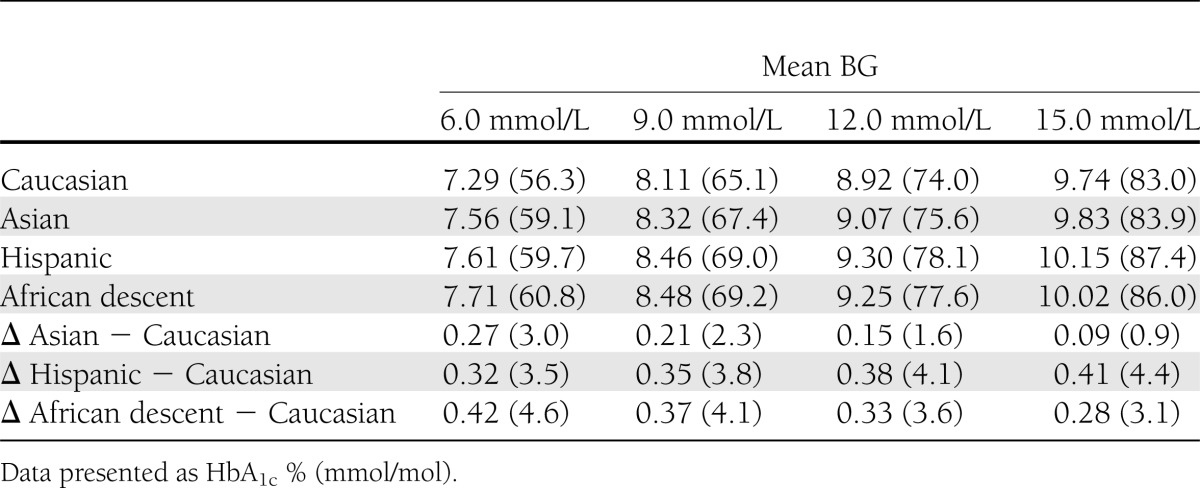
Figure 1 depicts the relationship between HbA1c and mean SMBG for all participants in the different ethnic groups and the corresponding regression equations and resulting regression lines for the ethnic groups. Differences between the ethnic groups are the largest in the clinically relevant HbA1c range of 7.0–9.0% (53–75 mmol/mol). In this range, as depicted in Table 2, the level of HbA1c is 0.2–0.5% (2–6 mmol/mol) higher in Asian, Hispanic, and African descent participants compared with Caucasian participants.
Figure 1.

A–D: The relationship between HbA1c and mean SMBG in the Caucasian, Asian, Hispanic, and African descent ethnic groups. The regression equations are as follows: (A) Caucasian HbA1c (%) = 0.27 × mean SMBG (mmol/L) + 5.66; (B) Asian HbA1c (%) = 0.25 × mean SMBG (mmol/L) + 6.05; (C) Hispanic HbA1c (%) = 0.28 × mean SMBG (mmol/L) + 5.92; and (D) African descent HbA1c (%) = 0.26 × mean SMBG (mmol/L) + 6.17, where mean SMBG is the mean of the SMBG profiles.
Table 2.
Comparison of HbA1c values at different mean BG levels between the different ethnic groups
The estimated AG levels, calculated from HbA1c levels, are given in Table 1. As expected from the HbA1c values, estimated AG is significantly higher in Hispanic and Asians than in Caucasians. Figure 2 depicts the relationship between the estimated AG and the mean SMBG. When estimated AG is an accurate reflection of mean SMBG, we expect a 1:1 linear relationship, which apparently is not the case. When we plotted the relationship between mean SMBG and mean BG index, i.e., the difference between estimated AG and mean SMBG, we observed a clearly deviant pattern. With mean BG levels <11.6 mmol/L (210 mg/dL), this difference is >0, whereas at higher BG levels this difference becomes negative. These findings indicate that at lower levels of mean BG, estimated AG overestimates true BG levels; at levels >11.6 mmol/L (210 mg/dL), estimated AG underestimates the true BG level. This pattern proved similar for all ethnic groups (data not shown).
Figure 2.

A: Relationship between the estimated AG and the mean SMBG values. The observed regression line (solid line) differs significantly from the expected regression line (dotted line). B: Relationship between the mean BG index (difference between estimated BG and measured BG) and the mean SMBG values. At mean SMBG levels of ≤11.6 mmol/L (210 mg/dL), estimated AG overestimates the actual average BG; at BG levels >11.6 mmol/L (210 mg/dL), estimated AG underestimates the true BG levels.
CONCLUSIONS
We report the association between glycemic measures in a large racially and ethnically diverse population of patients with type 2 diabetes. There is a clear difference in the relationship between HbA1c and mean SMBG in different ethnic groups, with the highest HbA1c—for a given BG level—in Hispanic participants and in participants of Asian and African descent and the lowest HbA1c in Caucasians. In the clinically relevant HbA1c range of 7.0–9.0% (53–75 mmol/mol), non-Caucasian ethnic groups had a 0.2–0.5% higher HbA1c compared with Caucasians. These results add to the growing literature describing higher HbA1c levels in non-Caucasian populations for a similar degree of hyperglycemia. Although biological and analytical variations may contribute to this difference, it is unlikely that these variations explain all of the difference. We have assessed diurnal variation in HbA1c when measured in five different samples obtained between 8:00 a.m. and 11:00 p.m. in patients with type 2 diabetes (15). The resulting HbA1c values were nearly identical (median intra-individual variation 1.3%), indicating very low biological and analytical variations within an individual. Even when laboratories use multiple analyzers, the total analytic imprecision is low (16). This suggests that the HbA1c difference of (absolute) 0.2% (2.2 mmol/mol) is clinically relevant.
Another important finding is the relationship between estimated AG, calculated on the basis of HbA1c measurement (12), and the actual values of mean BG as derived from self-monitoring. In the A1C-Derived Average Glucose study report, estimated AG was calculated in 507 patients (>80% Caucasians) by combining weighted results obtained during a 3-month period from at least 2 days of continuous glucose monitoring performed four times, with seven-point daily BG monitoring performed at least 3 days per week (12). Although there was a good correlation between HbA1c and estimated AG (R2 of 0.84 for the whole group), visual inspection of this relationship shows that an HbA1c of, for instance, 7% (53 mmol/mol) was associated with estimated AG varying between 7.0 mmol/L (127 mg/dL) and 11 mmol/L (200 mg/dL). In the current study, we observed a clear discrepancy between estimated AG and actually measured mean BG levels. With BG levels ≤11.6 mmol/L (210 mg/dL), estimated AG was higher than the actual average mean BG. When mean BG levels were >11.6 mmol/L (210 mg/dL), estimated AG was significantly lower than the measured BG levels. Thus, estimated AG overestimated BG at lower glucose levels and underestimated mean BG at higher glucose levels. From these results, we conclude that calculation of estimated AG from HbA1c with the current formula leads to inaccurate results.
HbA1c levels are determined by several factors, as has been described in several recent articles. In addition to BG levels, age, sex, BMI, mean corpuscular hemoglobin, mean corpuscular hemoglobin concentration, current smoking, and alcohol consumption are independent predictors of HbA1c level (11). The data presented in this report confirm previous articles in which it was described that persons of African descent have higher HbA1c levels than Caucasian persons across the full spectrum of BG levels (17,18). Another study reported a 0.5% (6 mmol/mol) higher HbA1c in Hispanics compared with Caucasians (2). The investigators concluded that these differences may be based on types of lifestyles, health care access and utilization, or socioeconomic factors, and also possibly on biological differences such as hemoglobin glycation or erythrocyte survival (2). However, there was insufficient data to compare HbA1c levels stratified for glycemic control based on BG monitoring. Our present analyses clearly show a 0.32–0.41% (3–5 mmol/mol) absolute difference in HbA1c between Hispanics and Caucasians for a given mean BG level ranging from 5.6 to 15.0 mmol/L (100–260 mg/dL; Table 2). This difference may be explained, in part, by genetic determinants. In the third National Health and Nutrition Examination Survey, it recently was shown that at many HbA1c genetic loci there is substantial race–ethnic heterogeneity in risk allele frequencies (19). For the clinical situation, these results imply that goals for HbA1c need to be different according to ethnic background, and also that cutoff values for establishing the presence of type 2 diabetes are different according to ethnic background. For example, it recently was demonstrated that retinopathy prevalence begins to increase at a lower HbA1c level in those of African descent than in Caucasians (18). Thus, in studies in which intensive diabetes treatment has been applied, such as the ACCORD study, using the same HbA1c as treatment target for people from different ethnic backgrounds may have created a higher risk of hypoglycemia for those of Asian, African, or Hispanic origin. In this respect, reassessment of the ACCORD study results (20) with special attention to the relationship between ethnic background and risk of hypoglycemia seems warranted. An interesting finding in this study was that compared with Caucasians, Asians had higher postprandial BG levels despite similar fasting and premeal BG levels. This finding may suggest that this postprandial increase is a specific feature of type 2 diabetes in Asians.
One limitation of our study is that the association of HbA1c and BG has been based on a single HbA1c determination and on mean BG levels assessed from only three 7-point SMBG profiles obtained within a period of 2 weeks. However, the DURABLE trial included patients with relatively stable glycemic control and also ensured that BG measurements could be compared among participants by using a single type of BG meter (Roche, Mannheim, Germany). It has been shown clearly that HbA1c levels reflect average glycemia of the most recent 5 weeks (21). We have no data regarding the quality of BG self-monitoring by the participants, because many of the participants may have been taught this technique during the run-in phase of the DURABLE trial. However, clinical experience suggests that patients find these BG meters easy to understand and use. Finally, there is a large amount of scatter in the data (as depicted in Fig. 1), possibly as a result of biological variation or experimental/analytical error. However, this scatter was rather similar to the results presented by McCarter et al. (22) in type 1 diabetic individuals. Greater numbers would have allowed for more detailed subanalyses.
We conclude that ethnicity has a strong influence on the relationship between HbA1c and mean BG levels obtained by self-monitoring. This background needs to be taken into consideration when assessing HbA1c levels as part of evaluation of (quality of) diabetes treatment and for setting glycemic targets. Moreover, at mean BG levels <11.6 mmol/L (210 mg/dL), estimated AG overestimates the actual average BG; at levels >11.6 mmol/L (210 mg/dL), estimated AG underestimates the true BG levels, which limits the use of estimated AG as an accurate marker of glycemia in clinical practice.
Acknowledgments
The DURABLE trial was funded by Eli Lilly and Company.
B.H.R.W. has received grant support for clinical studies and also has received consulting fees for serving on advisory boards and as a speaker for Eli Lilly and Company, GlaxoSmithKline, Novo Nordisk, and Pfizer. He also has received consulting fees from Eli Lilly and Company as a member of the DURABLE Trial Data Monitoring Committee. W.H.H. has received consulting fees from Eli Lilly and Company as a member of the DURABLE Trial Data Monitoring Committee and has received fees as a consultant. J.L.G. has received grant support for clinical studies from Boehringer Ingelheim, Bristol-Myers Squibb, Eli Lilly and Company, Janssen Pharmaceuticals, and Novo Nordisk, and also has received consulting fees for serving on advisory boards and as a speaker for Boehringer Ingelheim, Bristol-Myers Squibb, Eli Lilly and Company, Novo Nordisk. M.D. has received grant support for clinical studies from Eli Lilly and Company, Novo Nordisk, and Boehringer Ingelheim, and also has received consulting fees for serving on advisory boards and as a speaker for Eli Lilly and Company, Novo Nordisk, and Boehringer Ingelheim. H.H.J. and D.S.H. are employees and shareholders of Eli Lilly and Company.
This post hoc analysis of the relationship between BG and HbA1c was investigator-initiated (B.H.R.W.). For this, no financial support was requested nor provided. All authors had authority over manuscript preparation and the decision to submit the manuscript for publication. The funding source had no role in the design, conduct, or reporting of this analysis or in the decision to submit the manuscript for publication. No other potential conflicts of interest relevant to this article were reported.
B.H.R.W. designed the study, analyzed data, interpreted results, and wrote the manuscript. W.H.H. participated in study design, contributed to data analysis and discussion, and reviewed and edited the manuscript. J.L.G. and M.D. contributed to discussion and reviewed and edited the manuscript. H.H.J. prepared the dataset, contributed to data analysis and discussion, and reviewed and edited the manuscript. D.S.H. participated in study design, contributed to data analysis and discussion, and reviewed and edited the manuscript. B.H.R.W. is the guarantor of this work and, as such, had full access to all the data in the study and takes responsibility for the integrity of the data and the accuracy of the data analysis.
Parts of this study were presented in abstract form at the 48th Annual Meeting of the European Association for the Study of Diabetes, Berlin, Germany, 1–5 October, 2012.
The authors thank all of the investigators, study staff at all of the sites, and, most importantly, the patients who made this study possible.
Footnotes
Clinical trial reg. no. NCT00279201, clinicaltrials.gov.
References
- 1.Cerami A. The unexpected pathway to the creation of the HbA1c test and the discovery of AGE’s. J Intern Med 2012;271:219–226 [DOI] [PubMed] [Google Scholar]
- 2.Kirk JK, Passmore LV, Bell RA, et al. Disparities in A1C levels between Hispanic and non-Hispanic white adults with diabetes: a meta-analysis. Diabetes Care 2008;31:240–246 [DOI] [PubMed] [Google Scholar]
- 3.Herman WH, Ma Y, Uwaifo G, et al. Diabetes Prevention Program Research Group Differences in A1C by race and ethnicity among patients with impaired glucose tolerance in the Diabetes Prevention Program. Diabetes Care 2007;30:2453–2457 [DOI] [PMC free article] [PubMed] [Google Scholar]
- 4.Herman WH, Dungan KM, Wolffenbuttel BH, et al. Racial and ethnic differences in mean plasma glucose, hemoglobin A1c, and 1,5-anhydroglucitol in over 2000 patients with type 2 diabetes. J Clin Endocrinol Metab 2009;94:1689–1694 [DOI] [PubMed] [Google Scholar]
- 5.Chalew S, Hempe JM. Caveats regarding the use of HbA1c for prediction of mean blood glucose. Diabetologia 2008;51:903–904; author reply 905–906 [DOI] [PubMed] [Google Scholar]
- 6.Kilpatrick ES, Rigby AS, Atkin SL. Variability in the relationship between mean plasma glucose and HbA1c: implications for the assessment of glycemic control. Clin Chem 2007;53:897–901 [DOI] [PubMed] [Google Scholar]
- 7.Bloomgarden ZT, Inzucchi SE, Karnieli E, Le Roith D. The proposed terminology ‘A(1c)-derived average glucose’ is inherently imprecise and should not be adopted. Diabetologia 2008;51:1111–1114 [DOI] [PubMed] [Google Scholar]
- 8.Hempe JM, Gomez R, McCarter RJ, Jr, Chalew SA. High and low hemoglobin glycation phenotypes in type 1 diabetes: a challenge for interpretation of glycemic control. J Diabetes Complications 2002;16:313–320 [DOI] [PubMed] [Google Scholar]
- 9.Rohlfing C, Wiedmeyer HM, Little R, et al. Biological variation of glycohemoglobin. Clin Chem 2002;48:1116–1118 [PubMed] [Google Scholar]
- 10.Cohen RM, Snieder H, Lindsell CJ, et al. Evidence for independent heritability of the glycation gap (glycosylation gap) fraction of HbA1c in nondiabetic twins. Diabetes Care 2006;29:1739–1743 [DOI] [PubMed] [Google Scholar]
- 11.Jansen H, Stolk RP, Nolte IM, Kema IP, Wolffenbuttel BH, Snieder H. Determinants of HbA1c in nondiabetic Dutch adults: genetic loci and clinical and lifestyle parameters, and their interactions in the lifelines cohort study. J Intern Med 2013;273:283–293 [DOI] [PubMed] [Google Scholar]
- 12.Nathan DM, Kuenen J, Borg R, Zheng H, Schoenfeld D, Heine RJ, A1c-Derived Average Glucose Study Group Translating the A1C assay into estimated average glucose values. Diabetes Care 2008;31:1473–1478 [DOI] [PMC free article] [PubMed] [Google Scholar]
- 13.Bry L, Chen PC, Sacks DB. Effects of hemoglobin variants and chemically modified derivatives on assays for glycohemoglobin. Clin Chem 2001;47:153–163 [PubMed] [Google Scholar]
- 14.Fahrbach J, Jacober S, Jiang H, Martin S. The DURABLE trial study design: comparing the safety, efficacy, and durability of insulin glargine to insulin lispro mix 75/25 added to oral antihyperglycemic agents in patients with type 2 diabetes. J Diabetes Sci Tech 2008;2:831–838 [DOI] [PMC free article] [PubMed] [Google Scholar]
- 15.Wolffenbuttel BH, Sels JP, Menheere PP, Nieuwenhuijzen Kruseman AC. The value of fasting blood glucose and serum fructosamine in the evaluation of metabolic control in NIDDM patients. Diabetes Nutr Metab 1991;4:297–303 [Google Scholar]
- 16.Tran DV, Cembrowski GS, Higgins TN. Use of 2 years of patient data to estimate intra-laboratory total imprecision of HbA(1c) measured by multiple HPLC analyzers. Clin Biochem 2008;41:177–179 [DOI] [PubMed] [Google Scholar]
- 17.Ziemer DC, Kolm P, Weintraub WS, et al. Glucose-independent, black-white differences in hemoglobin A1c levels: a cross-sectional analysis of 2 studies. Ann Intern Med 2010;152:770–777 [DOI] [PubMed] [Google Scholar]
- 18.Tsugawa Y, Mukamal KJ, Davis RB, Taylor WC, Wee CC. Should the hemoglobin A(1c) diagnostic cutoff differ between blacks and whites? A cross-sectional study. Ann Intern Med 2012;157:153–159 [DOI] [PMC free article] [PubMed] [Google Scholar]
- 19.Grimsby JL, Porneala BC, Vassy JL, et al. MAGIC Investigators Race-ethnic differences in the association of genetic loci with HbA1c levels and mortality in U.S. adults: the third National Health and Nutrition Examination Survey (NHANES III). BMC Med Genet 2012;13:30. [DOI] [PMC free article] [PubMed] [Google Scholar]
- 20.Ismail-Beigi F, Craven T, Banerji MA, et al. ACCORD trial group Effect of intensive treatment of hyperglycaemia on microvascular outcomes in type 2 diabetes: an analysis of the ACCORD randomised trial. Lancet 2010;376:419–430 [DOI] [PMC free article] [PubMed] [Google Scholar]
- 21.Wolffenbuttel BHR, Giordano D, Founds HW, Bucala R. Long-term assessment of glucose control by haemoglobin-AGE measurement. Lancet 1996;347:513–515 [DOI] [PubMed] [Google Scholar]
- 22.McCarter RJ, Hempe JM, Gomez R, Chalew SA. Biological variation in HbA1c predicts risk of retinopathy and nephropathy in type 1 diabetes. Diabetes Care 2004;27:1259–1264 [DOI] [PubMed] [Google Scholar]