

Abstract
OBJECTIVE
To determine whether skin intrinsic fluorescence (SIF) is associated with long-term complications of type 1 diabetes (T1D) and, if so, whether it is independent of chronic glycemic exposure and previous intensive therapy.
RESEARCH DESIGN AND METHODS
We studied 1,185 (92%) of 1,289 active Diabetes Control and Complications Trial (DCCT)/Epidemiology of Diabetes Interventions and Complications (EDIC) participants from 2010 to 2011. SIF was determined using a fluorescence spectrometer and related cross-sectionally to recently determined measures of retinopathy (stereo fundus photography), cardiac autonomic neuropathy (CAN; R-R interval), confirmed clinical neuropathy, nephropathy (albumin excretion rate [AER]), and coronary artery calcification (CAC).
RESULTS
Overall, moderately strong associations were seen with all complications, before adjustment for mean HbA1c over time, which rendered these associations nonsignificant with the exception of sustained AER >30 mg/24 h and CAC, which were largely unaffected by adjustment. However, when examined within the former DCCT treatment group, associations were generally weaker in the intensive group and nonsignificant after adjustment, while in the conventional group, associations remained significant for CAN, sustained AER >30 mg/24 h, and CAC even after mean HbA1c adjustment.
CONCLUSIONS
SIF is associated with T1D complications in DCCT\EDIC. Much of this association appears to be related to historical glycemic exposure, particularly in the previously intensively treated participants, in whom adjustment for HbA1c eliminates statistical significance.
The micro- and macrovascular complications of type 1 diabetes (T1D) are thought to result, primarily, from exposure of tissues to high glucose concentrations and to be reduced by intensive glycemic control (1,2). Although the pathogenesis is poorly understood, one mechanism of hyperglycemia-associated tissue damage appears to operate through enhanced formation and accumulation of advanced glycation end products (AGEs) (3,4). AGEs are the stable final products of complex reactions, many involving free radical oxidation, between reducing sugars and free amino groups in proteins. AGE formation is considered a stoichiometric, nonenzymatic process that is enhanced in diabetes not only by elevated glucose concentrations, but also by increased oxidative stress (3,5). AGEs include glucose- or carbohydrate-derived adducts to proteins, and some include cross-links within and between protein molecules.
Numerous studies have focused on AGE modification of skin collagen (6–16) as an accessible, long-lived protein that may reflect cumulative AGE-mediated tissue damage elsewhere. Skin AGE content accumulates on long-lived proteins with advancing chronological age and is accelerated in diabetes (17). In a study of skin biopsy samples collected near the end of the Diabetes Control and Complications Trial (DCCT) (from 1992 to 1993), levels of AGEs in collagen were lower in the intensive treatment group compared with the conventional group (8). Furthermore, in a more recent analysis of the same tissue samples, the initial glycation product (assessed as furosine content) and the AGE carboxymethyllysine were shown to predict the progression of both retinopathy and nephropathy independently of HbA1c levels (13). As measures requiring skin biopsy are obviously not generally applicable in the clinical setting, a noninvasive, surrogate measure of AGE content reflecting skin collagen might be of great potential value.
Some AGE products fluoresce when excited with near-ultraviolet and blue light, and measures of fluorescence in tissue biopsies, including skin collagen, have been found to correlate with levels of specific AGE products (r = 0.55) (10,11). It is thus possible that skin fluorescence may act as a surrogate marker for AGE content and provide an opportunity for noninvasive measurement of these products (6,8,10,11). It should, however, be recognized that skin fluorescence has multiple determinants beyond AGE and thus may also provide additional information concerning risk for complications. The SCOUT DS instrument noninvasively measures AGE-related, and other, fluorescence in human skin, called skin intrinsic fluorescence (SIF), controlling for subject-specific light scattering and skin melanin and hemoglobin content (10,11).
Preliminary SIF data from the Pittsburgh Epidemiology of Diabetes Complication (EDC) study showed fairly strong associations with both neuropathy and coronary artery calcification (CAC) in a long-duration T1D cohort (18–20). While the cross-sectional association of SIF with the presence of these complications was superior to that based on historical HbA1c measures (up to seven values over 18 years of follow-up), the documentation of glycemic exposure was insufficient to assess whether any association of SIF with complications was fully independent of prior glycemia.
In the present article, we thus assess the association of SIF with long-term T1D complications and, using the detailed glycemic history and larger sample size of the DCCT/Epidemiology of Diabetes Interventions and Complications (EDIC) cohort, determine whether the relationship is independent of chronic glycemia and renal function. We also determine whether there are any differences in these associations by DCCT cohort (primary prevention vs. secondary intervention) and treatment group (intensive therapy vs. conventional therapy).
RESEARCH DESIGN AND METHODS
Study sample
The inclusion and exclusion criteria for the DCCT and the treatment protocol have been described in detail (21). Briefly, 1,441 subjects with T1D between 13 and 39 years of age were recruited into the DCCT between 1983 and 1989; 53% were male. The primary prevention cohort consisted of 726 subjects who, at study baseline, had no retinopathy, a urinary albumin excretion rate (AER) <40 mg/24 h, and diabetes duration of 1–5 years. The secondary intervention cohort consisted of 715 subjects who had very mild to moderate nonproliferative retinopathy, urinary AER ≤200 mg/24 h, and diabetes duration of 1–15 years. As part of the screening for the DCCT, individuals were excluded if they had hypertension, a history of symptomatic ischemic heart disease, the presence of major electrocardiogram abnormalities, or severe hypercholesterolemia. Subjects were randomly assigned to either intensive (n = 711) or conventional (n = 730) treatment arms and assessed for complications at frequent follow-up visits. Intensive therapy included either multiple (at least three) daily insulin injections or continuous subcutaneous insulin infusion with external insulin pumps, with the goal of achieving glycemic control as close to the nondiabetic range as safely possible, specifically, HbA1c <6.05% guided by frequent daily self–blood glucose monitoring. The intensive and conventional treatment groups maintained median HbA1c levels of ∼7.0 and 9.0%, respectively, during the 6.5-year mean DCCT follow-up.
In 1994, after completion of the DCCT, 1,375 subjects (96% of the surviving cohort), 688 from the conventional arm and 687 from the intensive arm, agreed to participate in the EDIC follow-up study, which included annual examinations measuring diabetes complications (22).
For the current SIF complications analyses, all living EDIC subjects who participated in the annual exam during years 16 or 17 of EDIC (2010 to 2011) were eligible for inclusion. Ninety-two percent (1,185) of the 1,289 active EDIC participants had SIF measured.
Clinical measures
Demographic data and health history were self-reported, and a standardized physical examination was performed annually. BMI was measured every 3 months during the DCCT and yearly during the EDIC Study. All laboratory measurements were performed at the DCCT/EDIC Central Biochemistry Laboratory at the University of Minnesota as previously described (21). HbA1c was measured every 3 months during the DCCT and yearly during the EDIC Study (21,22). AER was measured annually during the DCCT and on alternate years during the EDIC study using a timed 4-h urine collection and expressed per 24 h (21,22). Serum lipids were measured using conventional enzymatic methods from fasting samples obtained yearly during DCCT and on alternate years during EDIC. Serum creatinine was measured annually in DCCT/EDIC and estimated glomerular filtration rate (eGFR) was calculated using the Chronic Kidney Disease Epidemiology Collaboration equation (23,24).
Total glycemic exposure (mean HbA1c) was calculated as: (pre-DCCT: DCCT eligibility HbA1c × duration of diabetes at study baseline) + (DCCT mean HbA1c × years of follow-up in DCCT) + (EDIC mean HbA1c × years of follow-up in EDIC). Glycemic exposure was also examined using each of these time periods separately.
Clinic latitude was determined as a surrogate for potential differences in vitamin D levels due to sun exposure and was incorporated into the data analysis as a categorical variable with EDIC clinics below and above 37° latitude designated as southern (n = 9) and northern clinics (n = 19), respectively (25–28). Smoking status was determined by subject self-report and categorized as never smoked (<100 cigarettes in a subject's lifetime), previous smoker (quit >1 year ago), or current smoker.
SIF measurement
Repeat measurements of SIF were obtained from the skin on the underside of the left forearm near the elbow using the SCOUT DS skin fluorescence spectrometer. SIF was excited with a light-emitting diodes centered at 375, 405, 416, 435, and 456 nm and was detected over the emission range of 435–655 nm. For these analyses, the 375-nm excited fluorescence was used, with kx set to 0.6 and km set to 0.2. The resulting intrinsic fluorescence, fxm, was integrated over the 435–655-nm spectral region and multiplied by 1,000 to give the SIF sum. These values of kx and km were previously determined in the Pittsburgh EDC study to be relevant for the 375-nm excited fluorescence, which had the strongest association with diabetes-related complications in the Pittsburgh EDC cohort (19). The intrasubject, same-day variation in SIF was assessed using the method of the Hoorn Study (18). The intraday Hoorn coefficient of variation was 4.2%, and the between-measurement correlation was 0.963.
Definition of complications
The complications of diabetes reported in this article are retinopathy, nephropathy, neuropathy, and CAC. Each participant was categorized according to the presence or absence of each of these complications at his or her most recent clinical assessment.
Retinopathy.
Presence or absence of moderate nonproliferative diabetic retinopathy (NPDR) or worse indicated by microaneurysms plus immunoradiometric assay or moderate retinal hemorrhages (Early Therapy Diabetic Retinopathy Study [ETDRS] score of ≥6) between EDIC years 13–16. Subjects who received pan-retinal scatter photocoagulation (laser) therapy in either eye were counted as having the most severe level of retinopathy thereafter. Retinopathy was measured by standardized seven-field fundus photography biannually during DCCT. During EDIC, it was assessed with identical methods, but in approximately one-quarter of the cohort each year and in the entire cohort at EDIC years 4 and 10. All photographs were graded centrally using the final ETDRS grading scale (29,30) and DCCT methods with the graders masked to DCCT therapy assignment (21,30).
Nephropathy.
Presence or absence of sustained AER ≥30 mg/24 h (i.e., at two consecutive visits at EDIC years 13/14 and 15/16) (31,32).
Neuropathy.
Two measures of neuropathy were used. First, the presence or absence of cardiac autonomic neuropathy (CAN) was assessed by measuring sinus arrhythmia (33). Electrocardiographic R-R variation was computed as a dimensionless circular mean vector of R-R intervals (33). Abnormal R-R variation was defined as <15 in testing done in EDIC years 16/17 (33). Secondly, presence or absence of confirmed clinical neuropathy (CCN) was defined as in previous DCCT/EDIC publications (34,35). The data used for this assessment were obtained from nerve conduction tests done in EDIC years 13/14 (35).
CAC was detected with either multislice or electron beam computed tomography, as previously described (36). We defined categories of CAC (present/absent) using thresholds of CAC >0 and CAC >200 Agatston units from testing done in EDIC year 12.
Statistical analyses
Characteristics were compared using the Wilcoxon rank sum test to evaluate treatment group differences for ordinal and numeric variables. The contingency χ2 test was used for categorical variables.
SIF was log transformed, and the first SIF measurement per subject was used for all analyses. The association between log SIF and the most recent complication status was modeled using logistic regression adjusting for variables that have been previously shown to be related to SIF and were statistically significant (37). These comprised age, any eGFR <60 mL/min/1.73 m2 (categorical adjustment to control for retained AGE products as a consequence of renal function impairment), smoking status (never, ever, or current), skin tone, and clinic latitude. Hypertension and lipid concentrations were not related to SIF (37). Further adjustments were made for total glycemic exposure. Odds ratios (ORs) and 95% CIs are presented per 1 SD (0.21) change in log SIF. Interactions between treatment group and log SIF were also assessed.
RESULTS
At the time of SIF determination, the population had a mean age of 51.5 years and diabetes duration of 29.8 years (Table 1). As previously reported, the DCCT former intensive therapy group had a lower prevalence of most complications despite current and prior mean HbA1c being similar between the two groups starting 5 years from the end of the DCCT in 1993, although no difference is seen for end-stage renal disease and CAC. There was no difference in SIF by former treatment group. Compared with the few (N = 104) active DCCT/EDIC participants without an SIF measure, the examined population showed no major differences in baseline age (P = 0.97) and duration of diabetes (P = 0.64). Nonparticipants had a higher mean DCCT/EDIC/pre-DCCT HbA1c (8.4 ± 1.0 vs. 8.2 ± 0.9; P = 0.02).
Table 1.
Characteristics of the DCCT/EDIC SIF population at time of SIF assessment overall and by original DCCT treatment group
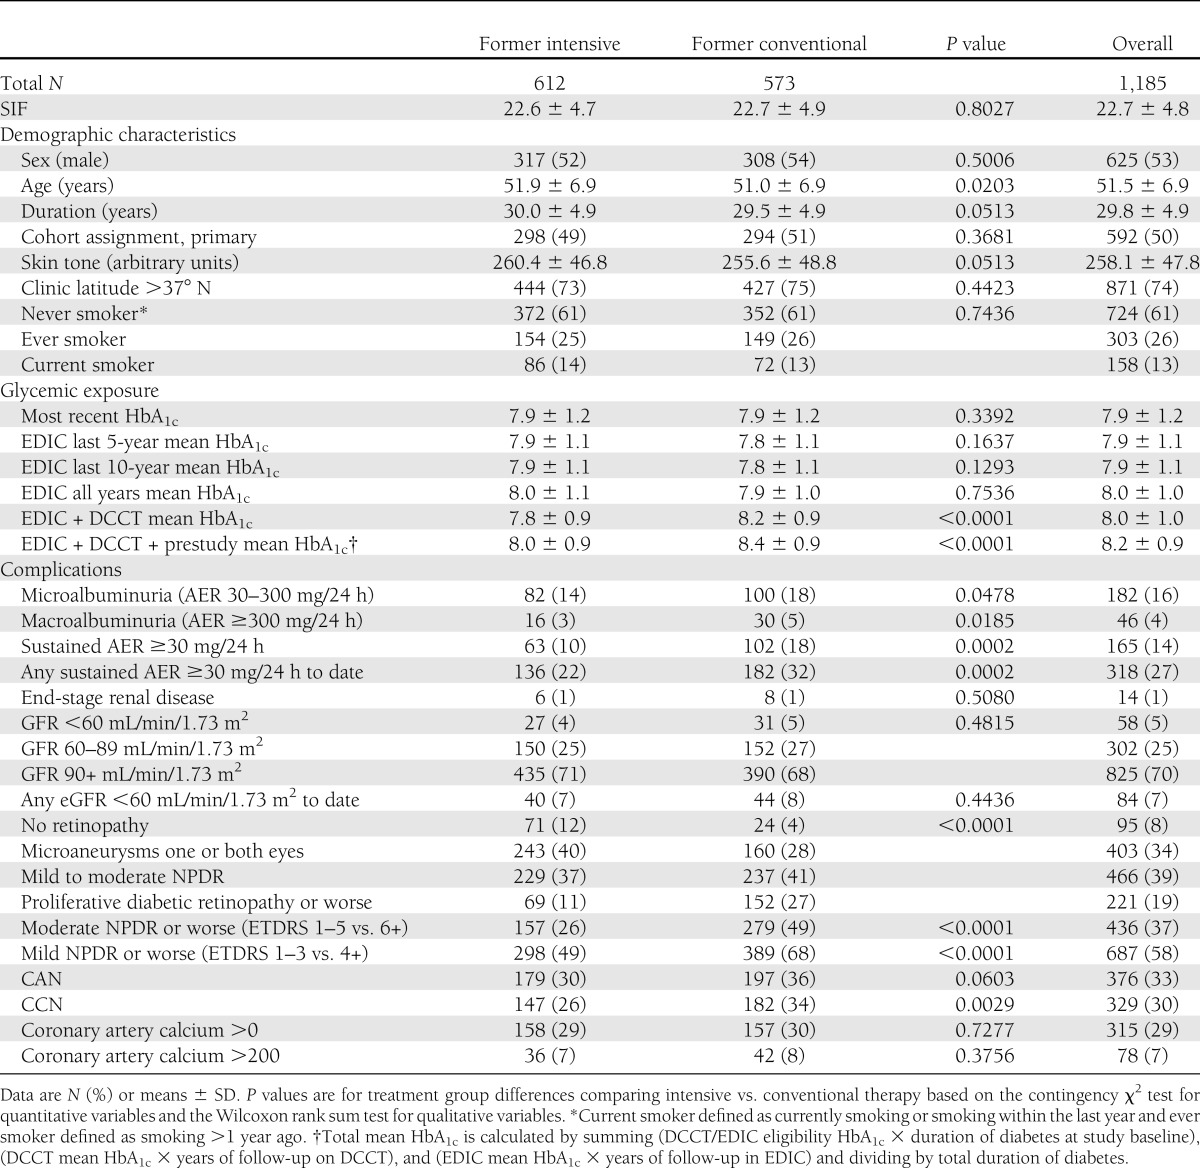
Table 2 presents the ORs for each complication per 1 SD change in log SIF after adjustment for age, any eGFR <60 mL/min/1.73 m2, smoking status, skin tone, and clinic latitude with and without adjustment for total glycemic exposure. Data are presented overall and stratified by DCCT treatment group. Overall, a moderately strong positive risk for each complication was seen in the analyses unadjusted for total glycemic exposure, although magnitude varies (ORs range from 1.15 [CAC >200] to 1.87 [sustained AER ≥30]). These associations were a little higher if eGFR was not included as a covariate (e.g., for sustained AER, the OR unadjusted for mean HbA1c was 2.19 [95% CI 1.79–2.67] compared with 1.87 [1.52–2.31]) (Table 2). All of the overall associations were significant except those for CAC >200, for which the prevalence was low (7%). After adjustment for total glycemic exposure, all ORs were markedly reduced, although those for sustained AER ≥30 and CAC >0 remained significant (P < 0.05). When analyzed as continuous outcomes, similar significant associations were seen; however, log (and square root) CAC were now significantly associated with SIF.
Table 2.
Log SIF association with most recent complication status overall and by original DCCT treatment group
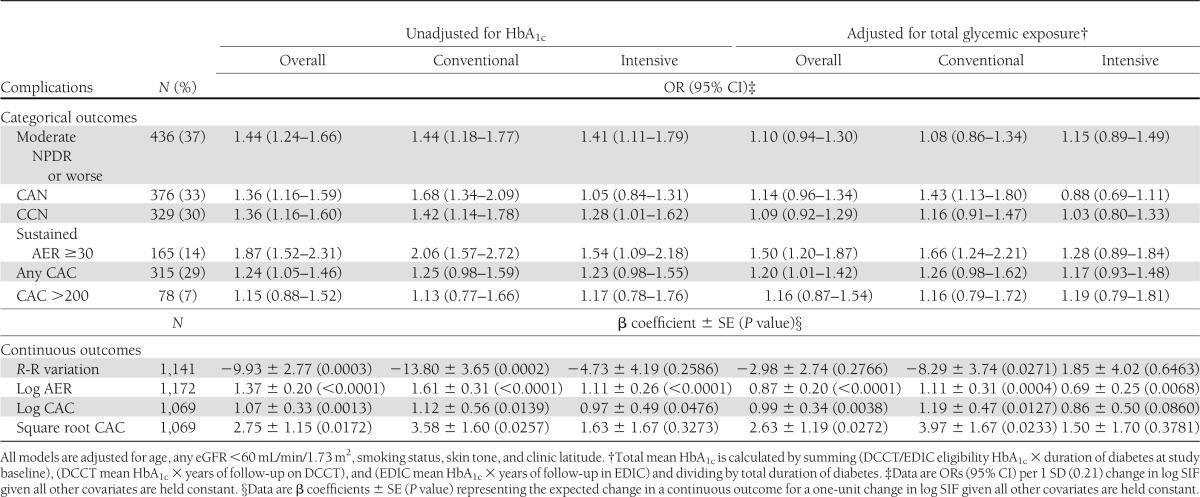
Subtle differences emerged on stratification by treatment group, although generally, treatment group by log SIF interactions were significant. In the former intensive therapy group, the strength of the glycemic unadjusted associations with CAN, CCN, and sustained AER ≥30 was somewhat lower than seen for the former conventional group. For CAN, the interaction term for treatment group was significant (P < 0.05). In contrast, the associations with retinopathy and CAC were similar. When analyzed continuously, all associations between SIF and CAN, sustained AER, and both CAC transformations were significant for both treatment groups, except for CAN and square root CAC in the former intensive group.
The overall effect of adjustment for total glycemic exposure showed a reduction in the ORs to borderline or no significance for the retinopathy, neuropathy, and nephropathy markers except for sustained AER ≥30 (overall and conventional group) and CAN (conventional group), where significance was retained. The interaction term for treatment group remained significant for CAN (P < 0.05). The magnitude of the adjustment effect was fairly consistent across treatment groups. However, the relationship between SIF and CAC appeared to be little affected by the HbA1c adjustment in either group. When examined continuously, similar patterns were seen by former treatment group, although in the intensive group, neither log or square root CAC was significantly associated with log SIF.
We also simultaneously examined the association between glycemia adjusted log SIF and complications by both DCCT primary prevention versus secondary intervention cohort and treatment group (Table 3). In the primary prevention cohort, log SIF associations with the microvascular complications were generally low (and nonsignificant) in the former intensive therapy group and stronger and significant for CAN and sustained AER ≥30 in the conventional group. The treatment group interaction term for CAN remained significant (P = 0.04). For CAC, little difference is seen between former treatment groups, and all associations were nonsignificant. In the secondary intervention cohort, for retinopathy, the relative direction of the associations was different (i.e., now stronger in the former intensive group) (OR 1.23 vs. 0.89), though none of these potential group interactions were significant. Furthermore, in the secondary cohort, no ORs were significant for any complication in either treatment group.
Table 3.
Log SIF association with most recent complication status by original DCCT cohort assignment and treatment group
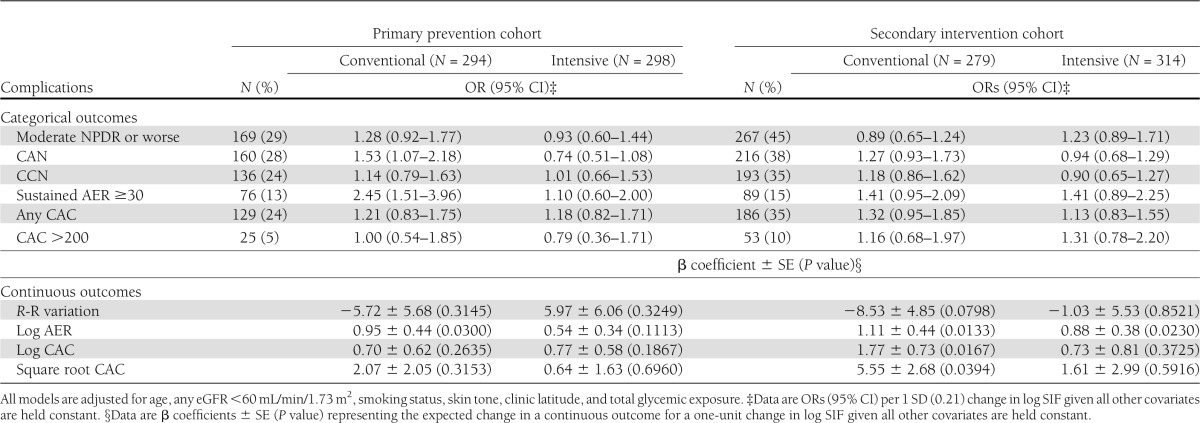
When analyzed continuously, in the primary prevention cohort, log AER was significantly associated with log SIF in the conventional group. In the secondary intervention cohort, significant associations were seen for log AER in both groups and for CAC in the conventional group.
CONCLUSIONS
These results demonstrate an association of SIF with complications of T1D in the well-characterized DCCT/EDIC cohort. Generally, fairly strong univariate correlations were seen for all microvascular complications included with weaker associations for CAC. However, on adjustment for total glycemic exposure, the microvascular complication associations were totally eliminated in the former intensive therapy group and remained significant only for CAN and sustained AER in the former conventional group. The weaker CAC associations were not further affected by controlling for glycemic exposure. These differences by DCCT treatment group appear complex, but fairly small and significant interactions were found only for CAN. Finally, it should be noted that there is no current difference between the former DCCT intensive and conventional groups in SIF, which was measured 16 to 17 years after the large separation in HbA1c between the groups ended.
SIF is not simply a function of glycemic exposure and AGE formation, but may reflect many other factors, some of which we are able to control, such as skin fluorescence/pigment and hemoglobin levels. Given these multiple determinants, SIF may potentially reflect more than glycemic exposure and AGE formation. However, the current data suggest that any added information is largely linked to renal disease as marked by sustained AER >30 mg/24 h and possibly CAN, marked by reduced R-R variation. The former association might be postulated to reflect reduced renal function, for AGEs that are not bound to long-living proteins, like collagen, may be retained and thus promote greater tissue damage, including greater binding to long-living proteins, and thus contributing to SIF. However, it should be noted that the analyses in Tables 2 and 3 did control for an estimate of GFR (which did indeed reduce the associations), and thus, it is likely log SIF is truly associated with renal damage and autonomic neuropathy beyond renal function per se and glycemic exposure.
The observation that intensive and conventional do not currently differ in terms of SIF is not surprising given the long recent period during which these two groups have had similar HbA1c levels. This similarity in SIF between conventional and intensive groups agrees with similar levels of specific AGE products and fluorescence between the two groups in a much smaller set of skin biopsies from DCCT/EDIC obtained from 1997 to 1998 (5). However, biopsies done by Monnier et al. (8) near DCCT closeout in 1991 to 1992 did show significantly higher AGE product levels in skin collagen from the conventional versus the intensive group. The observations that SIF have moderately strong associations with complications have clinical implications, despite their being largely, but not totally, eliminated by controlling for lifetime glycemic control. Firstly, it suggests that an SIF measure may be helpful in quantifying prior glycemic exposure—for example, when a patient is being assessed without a lifetime of available HbA1c measures. We have previously reported that SIF shows significant correlations with mean HbA1c over prior periods up to 15 years (37). Secondly, because SIF still retains some additional, albeit borderline, associations after glycemic exposure adjustment, further investigation may permit potential new pathways to complications to be identified and quantified. It is also likely that the associations are being underestimated, as there are imperfections in the current SIF measures, including the superimposition of epidermal fluorescence from NADH and flavin adenine dinucleotide (9,38,39) on dermal AGE fluorescence and interday, within-subject, measurement variance. We have previously tested to see if instrument bias was a significant factor in explaining SIF variance using two different methods. Neither test showed instrument bias to be a significant contributor to the overall variance in SIF (37). As NADH and flavin adenine dinucleotide are not as stable as AGEs and fluctuate in response to changes in epidermal cell metabolism and oxidative stress (9,38), their superimposition on the dermal AGE signal could reduce the quantitative relationship of glycemic exposure to SIF because the SIF algorithm only takes into account the overall intensity of the fluorescence and not the spectral shape.
AGE formation also reflects oxidative stress, and thus, there is further potential for SIF to contribute to our understanding of the pathogenesis of diabetes complications if it also reflects this important component. In previous studies (5,7), we have shown with advanced chronological age, the rate of accumulation of specific AGE products in skin collagen varies markedly even in the absence of diabetes. Since there is little variation in average glycemia among nondiabetic people, this variation has been attributed to variations in oxidative stress or antioxidant defenses (5). SIF thus has the potential to provide an integrated measure of stresses imposed by aging, glycemic exposure, and free-radical oxidation, all of which are interrelated.
There are few studies to which these results can be compared. However, the Pittsburgh EDC study of T1D has, using the first generation of the SCOUT device, examined the association of SIF with both coronary calcification and neuropathy (19,20). In the former reports, SIF was calculated from a subset of fluorescence wavelengths to avoid a spectral artifact that was present in the first-generation device but subsequently corrected in the second-generation device used in this study. A subsequent comparison of SIF measured by the first- and second-generation SCOUT algorithms found them to be highly correlated, with an R2 of 0.97 (J.M., personal communication).
In the EDC study, strong SIF associations with CAC were noted cross-sectionally, and meaningful improvements in the receiver operating characteristic analyses were obtained. However, it was noted that the associations became stronger as CAC advanced, and generally, this population had a somewhat longer duration, though similar age, reflecting their childhood onset. Strikingly, their CAC scores were much higher, with >70% having some measurable CAC as opposed to only 30% in DCCT/EDIC. It thus is possible that the SIF–CAC association may be stronger in those with more advanced duration and CAC, as seen in EDC.
In terms of neuropathy, EDC also studied both CAN and distal symmetric polyneuropathy and again found strong associations with both measures independent of 18-year mean HbA1c. Indeed, for CAN, the receiver operating characteristic for SIF was 0.8, while for mean HbA1c, it was only 0.57. Similar disparity was seen for distal symmetric polyneuropathy (0.78 vs. 0.59). Our CAN results are thus consistent with these EDC findings and with prior data showing AGE accumulation in neural tissue (39). Though analytic measures are different, it does seem SIF associations are weaker in DCCT/EDIC than in EDC when assessed in terms of incremental association after accounting for historic glycemic control. A major factor beyond the differing duration is the far greater detailed assessment of historic control (HbA1c), both in terms of number of measures and the proportion of diabetes duration covered by HbA1c values. There are a number of strengths and weaknesses in the current analyses. While the large sample size of DCCT/EDIC and the detailed glycemic assessments are great strengths, the relatively mild complication status of the population at present means that there is low representation of advanced stages of complications in which stronger associations may be seen. Another major limitation is the cross-sectional nature of the analysis, particularly as some complications were assessed up to 3 or 4 years earlier than SIF (e.g., CAC), and thus, their status may have changed. Prospective follow-up of this valuable cohort should partially address these concerns.
In conclusion, these analyses have shown moderately strong associations between SIF and a number of markers of diabetes complications in the DCCT/EDIC cohort despite the SIF measures not being determined, in some instances, at the same time as complication assessment. The associations appear weaker in the former intensive therapy group. Though history of glycemic exposure largely eliminates these associations in the former intensive therapy group, they remain significant for CAN and sustained AER in the former conventional group. Prospective studies are, however, needed to fully evaluate the predictive value of SIF for complications. Further investigations to understand the pathophysiologic basis for these associations and the suggestive treatment group differences are also warranted.
Acknowledgments
Abbott, Animas, Aventis, Becton Dickinson, Bayer, Can Am, Eli Lilly, LifeScan, Medtronic MiniMed, Omron, and Roche contributed free or discounted supplies and/or equipment. The DCCT/EDIC project is supported by contracts with the Division of Diabetes, Endocrinology and Metabolic Diseases of the National Institute of Diabetes and Digestive and Kidney Diseases, National Eye Institute, National Institute of Neurological Disorders and Stroke, the General Clinical Research Centers Program and the Clinical and Translational Science Awards Program, National Center for Research Resources, VeraLight, and Genentech through a Cooperative Research and Development Agreement with the National Institute of Diabetes and Digestive and Kidney Diseases. T.J.O. and T.J.L. have received grant support from VeraLight, Inc. J.M. is an employee and stock option holder of VeraLight, Inc. J.W. is an employee and stock option holder of VeraLight, Inc. A.B. is an independent insulin pump trainer who receives payment from Medtronic, Animas, Spirit, and OmniPod pumps. No other potential conflicts of interest relevant to this article were reported.
T.J.O. researched the data, wrote significant portions of the manuscript, reviewed and edited the manuscript, and contributed to the discussion. T.J.L. researched the data, wrote a portion of the manuscript, reviewed and edited the manuscript, and contributed to the discussion. P.A.C., B.H.B., and J.M. researched the data, reviewed and edited the manuscript, and contributed to the discussion. C.C. and R.A.G.-K. reviewed and edited the manuscript and contributed to the discussion. J.W. and K.A. researched the data. A.B. contributed to the discussion. S.V. reviewed and edited the manuscript. P.A.C. is the guarantor of this work and, as such, had full access to all the data in the study and takes responsibility for the integrity of the data and the accuracy of the data analysis.
Parts of this study were presented in abstract form at the 71st Scientific Sessions of the American Diabetes Association, San Diego, California, 24–28 June 2011.
Footnotes
Clinical trial reg. no. NCT00360893, www.clinicaltrials.gov.
*A complete list of participants in the DCCT/EDIC Research Group can be found at http://www.nejm.org/doi/full/10.1056/NEJMoa1111732#t=articleResults (N Engl J Med 2011;365:2366–2376).
References
- 1.The Diabetes Control and Complications Trial Research Group The effect of intensive treatment of diabetes on the development and progression of long-term complications in insulin-dependent diabetes mellitus. N Engl J Med 1993;329:977–986 [DOI] [PubMed] [Google Scholar]
- 2.Nathan DM, Cleary PA, Backlund JY, et al. Diabetes Control and Complications Trial/Epidemiology of Diabetes Interventions and Complications (DCCT/EDIC) Study Research Group Intensive diabetes treatment and cardiovascular disease in patients with type 1 diabetes. N Engl J Med 2005;353:2643–2653 [DOI] [PMC free article] [PubMed] [Google Scholar]
- 3.Thorpe S, Lyons T, Baynes J. Glycation and glycoxidation in diabetic vascular disease. In Oxidative Stress and Vascular Disease. Keaney J, Ed. Norwell, MA, Kluwer, 2000, p. 259–283 [Google Scholar]
- 4.Brownlee M. The pathobiology of diabetic complications: a unifying mechanism. Diabetes 2005;54:1615–1625 [DOI] [PubMed] [Google Scholar]
- 5.Yu Y, Thorpe SR, Jenkins AJ, et al. DCCT/EDIC Research Group Advanced glycation end-products and methionine sulphoxide in skin collagen of patients with type 1 diabetes. Diabetologia 2006;49:2488–2498 [DOI] [PubMed] [Google Scholar]
- 6.Monnier VM, Vishwanath V, Frank KE, Elmets CA, Dauchot P, Kohn RR. Relation between complications of type I diabetes mellitus and collagen-linked fluorescence. N Engl J Med 1986;314:403–408 [DOI] [PubMed] [Google Scholar]
- 7.Lyons TJ, Bailie KE, Dyer DG, Dunn JA, Baynes JW. Decrease in skin collagen glycation with improved glycemic control in patients with insulin-dependent diabetes mellitus. J Clin Invest 1991;87:1910–1915 [DOI] [PMC free article] [PubMed] [Google Scholar]
- 8.Monnier VM, Bautista O, Kenny D, et al. The DCCT Skin Collagen Ancillary Study Group Skin collagen glycation, glycoxidation, and crosslinking are lower in subjects with long-term intensive versus conventional therapy of type 1 diabetes: relevance of glycated collagen products versus HbA1c as markers of diabetic complications. Diabetes 1999;48:870–880 [DOI] [PMC free article] [PubMed] [Google Scholar]
- 9.Na R, Stender IM, Henriksen M, Wulf HC. Autofluorescence of human skin is age-related after correction for skin pigmentation and redness. J Invest Dermatol 2001;116:536–540 [DOI] [PubMed] [Google Scholar]
- 10.Hull E, Ediger M, Unione A, Deemer E, Stroman M, Baynes J. Noninvasive, optical detection of diabetes: model studies with porcine skin. Opt Express 2004;12:4496–4510 [DOI] [PubMed] [Google Scholar]
- 11.Meerwaldt R, Graaff R, Oomen PH, et al. Simple non-invasive assessment of advanced glycation endproduct accumulation. Diabetologia 2004;47:1324–1330 [DOI] [PubMed] [Google Scholar]
- 12.Ahmed N. Advanced glycation endproducts—role in pathology of diabetic complications. Diabetes Res Clin Pract 2005;67:3–21 [DOI] [PubMed] [Google Scholar]
- 13.Genuth S, Sun W, Cleary P, et al. DCCT Skin Collagen Ancillary Study Group Glycation and carboxymethyllysine levels in skin collagen predict the risk of future 10-year progression of diabetic retinopathy and nephropathy in the diabetes control and complications trial and epidemiology of diabetes interventions and complications participants with type 1 diabetes. Diabetes 2005;54:3103–3111 [DOI] [PMC free article] [PubMed] [Google Scholar]
- 14.Meerwaldt R, Hartog JW, Graaff R, et al. Skin autofluorescence, a measure of cumulative metabolic stress and advanced glycation end products, predicts mortality in hemodialysis patients. J Am Soc Nephrol 2005;16:3687–3693 [DOI] [PubMed] [Google Scholar]
- 15.Gerrits EG, Lutgers HL, Kleefstra N, et al. Skin autofluorescence: a tool to identify type 2 diabetic patients at risk for developing microvascular complications. Diabetes Care 2008;31:517–521 [DOI] [PubMed] [Google Scholar]
- 16.Beisswenger PJ, Howell S, Mackenzie T, Corstjens H, Muizzuddin N, Matsui MS. Two fluorescent wavelengths, 440(ex)/520(em) nm and 370(ex)/440(em) nm, reflect advanced glycation and oxidation end products in human skin without diabetes. Diabetes Technol Ther 2012;14:285–292 [DOI] [PubMed] [Google Scholar]
- 17.Dyer DG, Dunn JA, Thorpe SR, et al. Accumulation of Maillard reaction products in skin collagen in diabetes and aging. J Clin Invest 1993;91:2463–2469 [DOI] [PMC free article] [PubMed] [Google Scholar]
- 18.Mooy JM, Grootenhuis PA, de Vries H, et al. Intra-individual variation of glucose, specific insulin and proinsulin concentrations measured by two oral glucose tolerance tests in a general Caucasian population: the Hoorn Study. Diabetologia 1996;39:298–305 [DOI] [PubMed] [Google Scholar]
- 19.Conway B, Edmundowicz D, Matter N, Maynard J, Orchard T. Skin fluorescence correlates strongly with coronary artery calcification severity in type 1 diabetes. Diabetes Technol Ther 2010;12:339–345 [DOI] [PMC free article] [PubMed] [Google Scholar]
- 20.Conway BN, Aroda VR, Maynard JD, et al. Skin intrinsic fluorescence correlates with autonomic and distal symmetrical polyneuropathy in individuals with type 1 diabetes. Diabetes Care 2011;34:1000–1005 [DOI] [PMC free article] [PubMed] [Google Scholar]
- 21.The DCCT Research Group The Diabetes Control and Complications Trial (DCCT). Design and methodologic considerations for the feasibility phase. Diabetes 1986;35:530–545 [PubMed] [Google Scholar]
- 22.Epidemiology of Diabetes Interventions and Complications Research Group Epidemiology of Diabetes Interventions and Complications (EDIC): design, implementation, and preliminary results of a long-term follow-up of the Diabetes Control and Complications Trial cohort. Diabetes Care 1999;22:99–111 [DOI] [PMC free article] [PubMed] [Google Scholar]
- 23.Levey AS, Stevens LA, Schmid CH, et al. CKD-EPI (Chronic Kidney Disease Epidemiology Collaboration) A new equation to estimate glomerular filtration rate. Ann Intern Med 2009;150:604–612 [DOI] [PMC free article] [PubMed] [Google Scholar]
- 24.de Boer IH, Sun W, Cleary PA, et al. DCCT/EDIC Research Group Intensive diabetes therapy and glomerular filtration rate in type 1 diabetes. N Engl J Med 2011;365:2366–2376 [DOI] [PMC free article] [PubMed] [Google Scholar]
- 25.Danescu LG, Levy S, Levy J. Vitamin D and diabetes mellitus. Endocrine 2009;35:11–17 [DOI] [PubMed] [Google Scholar]
- 26.Tarcin O, Yavuz DG, Ozben B, et al. Effect of vitamin D deficiency and replacement on endothelial function in asymptomatic subjects. J Clin Endocrinol Metab 2009;94:4023–4030 [DOI] [PubMed] [Google Scholar]
- 27.Jablonski KL, Chonchol M, Pierce GL, et al. 25-Hydroxyvitamin D deficiency is associated with inflammation-linked vascular endothelial dysfunction in middle-aged and older adults. Hypertension 2011;57:63–69 [DOI] [PMC free article] [PubMed] [Google Scholar]
- 28.Yiu YF, Chan YH, Yiu KH, et al. Vitamin D deficiency is associated with depletion of circulating endothelial progenitor cells and endothelial dysfunction in patients with type 2 diabetes. J Clin Endocrinol Metab 2011;96:E830–E835 [DOI] [PubMed] [Google Scholar]
- 29.The Diabetes Control and Complications Trial/Epidemiology of Diabetes Interventions and Complications Research Group Retinopathy and nephropathy in patients with type 1 diabetes four years after a trial of intensive therapy. N Engl J Med 2000;342:381–389 [DOI] [PMC free article] [PubMed] [Google Scholar]
- 30.White NH, Sun W, Cleary PA, et al. The Diabetes Control and Complications Trial/Epidemiology of Diabetes Interventions and Complications Research Group Prolonged effect of intensive therapy on the risk of retinopathy complications in patients with type 1 diabetes mellitus: 10 years after the Diabetes Control and Complications Trial. Arch Ophthalmol 2008;126:1707–1715 [DOI] [PMC free article] [PubMed] [Google Scholar]
- 31.Writing team for the Diabetes Control and Complications Trial/Epidemiology of Diabetes Interventions and Complications Research Group Sustained effect of intensive diabetes treatment of type 1 diabetes mellitus on the development and progression of diabetic nephropathy in Epidemiology of Diabetes Interventions and Complications (EDIC) study. JAMA 2003;290:2159–2167 [DOI] [PMC free article] [PubMed] [Google Scholar]
- 32.de Boer IH, Rue TC, Cleary PA, et al. Diabetes Control and Complications Trial/Epidemiology of Diabetes Interventions and Complications Study Research Group Long-term renal outcomes of patients with type 1 diabetes mellitus and microalbuminuria: an analysis of the Diabetes Control and Complications Trial/Epidemiology of Diabetes Interventions and Complications cohort. Arch Intern Med 2011;171:412–420 [DOI] [PMC free article] [PubMed] [Google Scholar]
- 33.Pop-Busui R, Low PA, Waberski BH, et al. DCCT/EDIC Research Group Effects of prior intensive insulin therapy on cardiac autonomic nervous system function in type 1 diabetes mellitus: the Diabetes Control and Complications Trial/Epidemiology of Diabetes Interventions and Complications study (DCCT/EDIC). Circulation 2009;119:2886–2893 [DOI] [PMC free article] [PubMed] [Google Scholar]
- 34.Martin CL, Albers J, Herman WH, et al. DCCT/EDIC Research Group Neuropathy among the diabetes control and complications trial cohort 8 years after trial completion. Diabetes Care 2006;29:340–344 [DOI] [PMC free article] [PubMed] [Google Scholar]
- 35.Albers JW, Herman WH, Pop-Busui R, et al. Diabetes Control and Complications Trial /Epidemiology of Diabetes Interventions and Complications Research Group Effect of prior intensive insulin treatment during the Diabetes Control and Complications Trial (DCCT) on peripheral neuropathy in type 1 diabetes during the Epidemiology of Diabetes Interventions and Complications (EDIC) Study. Diabetes Care 2010;33:1090–1096 [DOI] [PMC free article] [PubMed] [Google Scholar]
- 36.Cleary PA, Orchard TJ, Genuth S, et al. DCCT/EDIC Research Group The effect of intensive glycemic treatment on coronary artery calcification in type 1 diabetic participants of the Diabetes Control and Complications Trial/Epidemiology of Diabetes Interventions and Complications (DCCT/EDIC) Study. Diabetes 2006;55:3556–3565 [DOI] [PMC free article] [PubMed] [Google Scholar]
- 37.Cleary PA, Braffett BH, Orchard T, et al. Clinical factors associated with skin intrinsic fluorescence in subjects with type 1 diabetes from the Diabetes Control and Complications Trial/Epidemiology of Diabetes Interventions and Complications Study. Diabetes Technol Ther 2013;15:466–474 [DOI] [PMC free article] [PubMed] [Google Scholar]
- 38.Heikal AA. Intracellular coenzymes as natural biomarkers for metabolic activities and mitochondrial anomalies. Biomarkers Med 2010;4:241–263 [DOI] [PMC free article] [PubMed] [Google Scholar]
- 39.Misur I, Zarkovic K, Barad A, et al. Advanced glycation endproducts in peripheral nerve in type 2 diabetes with neuropathy. Acta Diabetol 2004;41:158–166 [DOI] [PubMed] [Google Scholar]