The association between glycated hemoglobin (HbA1c) and long-term diabetes complications is well established (1). Although HbA1c is a key process and outcome measure in clinical and research settings, reporting varies from single annual measurements to an average of interval measurements per year. Seasonal HbA1c variability within an individual may impact on audit and intervention studies in clinical trials (2). Previous seasonal variability studies have used small datasets and short time intervals. Six equidistant samples are required to describe a cycle of seasonal variation, which means that a minimum dataset of 3 years is required.
We examined seasonal variation using HbA1c measurements collected quarterly from children aged 2–21 years (mean 12.9 years) attending a single clinic between 1999 and 2012. HbA1c was measured using the Diabetes Control and Complications Trial–aligned DCA1000 (Siemens Healthcare Diagnostics Inc., Deerfield, IL). Bias was determined over the HbA1c range 5.0–10.9% (31–96 mmol/mol) using the U.K. External Quality Assessment. The scheme over the time period was −0.08%.
A total of 5,140 measurements (average 3.6 measurements/patient/year) were collected and coded for the months January–March, April–June, July–September, and October–December. The data were then subjected to time series analysis. The clinic size increased from 22 to 356 between 1999 and 2012, with a decline in the median HbA1c from 10.2 to 7.7% (88–61 mmol/mol). The percentage of the clinic with HbA1c < 7.5% (58 mmol/mol) increased from 9.7 to 40.8%. Insulin pump therapy increased from 0 to 77% of the clinic and was associated with a lower median HbA1c level (7.5%; 58 mmol/mol) than that with the multiple daily injection regimen (8.8%; 73 mmol/mol) (P < 0.001), and a lower SD (1.2%; 13.1 mmol/mol) than the multiple daily injection regimen (2.0%; 21.9 mmol/mol).
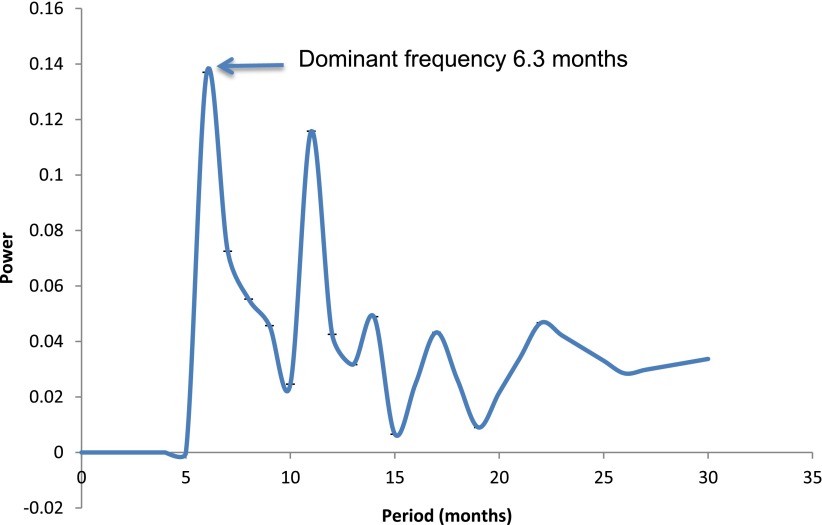
The data were stationarized (i.e., the difference plus the mean) prior to analysis to remove the trend of continuous decline in HbA1c, which interferes with the precise identification of oscillations. Fourier transformation was then used to determine oscillations within the time series (Fig. 1) (3). The decimal precision was confirmed using autocorrelation analysis.
Figure 1.
Fourier analysis of HbA1c values from 1999 to 2012. The x-axis depicts the periodicity (reciprocal of frequency) and the y-axis the strength of the oscillatory signal at different periodicities. The dominant periodicity is the first peak encountered, and the subsequent peaks are subharmonics.
Figure 1 shows a dominant (highest power) periodicity (the frequency is the reciprocal) at 6.3 months, indicating a greater than random tendency for the cycle in the time series to recur at this periodicity. The power spectrum translates into a seasonal variation in HbA1c of 0.3% (3.3 mmol/mol), with values lower in the summer (July–September) than in the winter (January–March) quartiles. This cyclicity with higher values in summer compared with winter could be attributed to differences in exercise, carbohydrate intake, and number of illness events between summer and winter months. The seasonal effect appears to be ameliorated by insulin pump therapy (4), with a lower SD found in this group.
The dataset is large, is from a single center, and extends over 13 years, which ensures that the periodicity of the HbA1c oscillations is robust and provides the best evidence to date of this phenomenon. The use of stationarization to eliminate trends in the data adds to the strength of this study. The submission of data to quality-improvement schemes should be based on the average for the individual over the whole year. The clinical trial design should include estimates of HbA1c seasonal variation to avoid types I and II statistical errors.
Acknowledgments
No potential conflicts of interest relevant to this article were reported.
C.J.P., R.J.T., and P.C.H. generated the hypothesis to be tested and collected the dataset. N.R.H. and D.R.M. undertook the time series analysis. All authors contributed to the interpretation of the data and the writing of the manuscript. P.C.H. is the guarantor of this work and, as such, had full access to all the data in the study and takes responsibility for the integrity of the data and the accuracy of the data analysis.
References
- 1.Nathan DM, Zinman B, Cleary PA, et al. Diabetes Control and Complications Trial/Epidemiology of Diabetes Interventions and Complications (DCCT/EDIC) Research Group Modern-day clinical course of type 1 diabetes mellitus after 30 years’ duration: the diabetes control and complications trial/epidemiology of diabetes interventions and complications and Pittsburgh epidemiology of diabetes complications experience (1983-2005). Arch Intern Med 2009;169:1307–1316 [DOI] [PMC free article] [PubMed] [Google Scholar]
- 2.Koga M, Murai J, Morita S, Saito H, Kasayama S. Comparison of annual variability in HbA1c and glycated albumin in patients with type 1 vs. type 2 diabetes mellitus. J Diabetes Complications 2013;27:211–213 [DOI] [PubMed] [Google Scholar]
- 3.Chatfield C. The Analysis of Time Series 3rd ed. London, Chapman and Hall, 1984 [Google Scholar]
- 4.Hathout EH, McClintock T, Sharkey J, et al. Glycemic, auxologic, and seasonal aspects of continuous subcutaneous insulin infusion therapy in children and young adults with type 1 diabetes. Diabetes Technol Ther 2003;5:175–181 [DOI] [PubMed] [Google Scholar]


