

Abstract
OBJECTIVE
We reported previously that low-saturated-fat dietary counseling started in infancy improves insulin sensitivity in healthy children 9 years of age. The aim of this study was to evaluate the effect of lifelong dietary counseling on insulin sensitivity in healthy adolescents between 15 and 20 years of age. In addition, we examined dietary fiber intake and the polyunsaturated fatty acid (PUFA) + monounsaturated (MUFA)-to-saturated fatty acid (SFA) ratio in the intervention and control adolescents and the association of these dietary factors with homeostasis model of insulin resistance (HOMA-IR).
RESEARCH DESIGN AND METHODS
The study comprised adolescents participating in the randomized, controlled Special Turku Coronary Risk Factor Intervention Project (STRIP) study, which aims to guide the study participants toward a diet beneficial for cardiovascular health. HOMA-IR was assessed annually between 15 and 20 years of age (n = 518; intervention, n = 245; control, n = 273), along with diet, BMI, pubertal status, serum cotinine concentrations, and physical activity. Dietary counseling was given biannually during the follow-up.
RESULTS
HOMA-IR was lower (7.5% on average) in the intervention group than in the control group between 15 and 20 years of age (P = 0.0051). The intervention effect was similar in girls and boys. The PUFA+MUFA-to-SFA ratio was higher (P < 0.0001) and the dietary fiber (g/MJ) intake was higher (P = 0.0058) in the intervention group compared with the control group. There was no association between the PUFA+MUFA-to-/SFA ratio and HOMA-IR, whereas dietary fiber intake (g/MJ) was associated with HOMA-IR in girls (P < 0.0001).
CONCLUSIONS
Dietary counseling initiated in infancy and maintained until 20 years of age was associated with improved insulin sensitivity in adolescents.
Insulin sensitivity is related to the life-long pathogenesis of atherosclerosis (1–3). Abnormally low insulin sensitivity (i.e., insulin resistance) is essential in the pathogenesis of the metabolic syndrome and related chronic diseases such as type 2 diabetes mellitus (4–7). The homeostasis model assessment of insulin resistance (HOMA-IR), the combined outcome of serum insulin and glucose levels, is a proxy measure of insulin sensitivity commonly used in epidemiological studies (8–10). High-fiber and high-polyunsaturated fatty acid (PUFA), high-monounsaturated fatty acid (MUFA), and low-saturated fatty acid (SFA) fat diets are hypothesized to improve insulin sensitivity (5,11–16). Dietary fat intervention studies in adults have shown the beneficial effect of higher unsaturated and lower SFA intake on insulin sensitivity (17,18).
This study analyzed data from the Special Turku Coronary Risk Factor Intervention Project for Children (STRIP). STRIP is a prospective, randomized trial that was started in infancy and aims to guide the study children toward a diet beneficial for cardiovascular health (19). Children in the intervention group have had a lower SFA intake from 7 months to 19 years of age (20) and a higher dietary fiber intake studied until 9 years of age (21). A favorable intervention effect has been found on serum LDL-cholesterol concentrations through infancy to adulthood (20). In addition, we have previously reported that the dietary counseling improved insulin sensitivity at 9 years of age (14). Similarly, in the Dietary Intervention Study for Children (DISC) examining hypercholesterolemic children, benefits of the low-fat and high-fiber dietary intervention given in childhood/adolescence on glycemic control were evident later in adulthood (15). Studies on the effect of dietary intervention on insulin sensitivity and the association of dietary fiber intake and quality of dietary fat with HOMA-IR among repeatedly studied healthy adolescents are, however, nonexisting. We therefore hypothesized that the dietary counseling given in STRIP would be associated with improved insulin sensitivity and that this effect would be explained by differences in fiber intake and/or quality of dietary fat.
RESEARCH DESIGN AND METHODS
STRIP is a prospective, randomized intervention trial (19). In brief, families of infants 5 months of age were recruited at the well-baby clinics in Turku, Finland, between February 1990 and June 1992. At 7 months of age, 1,062 infants (56.5% of the eligible age cohort) were allocated to an intervention group (n = 540) or to a control group (n = 522). The intervention and control families both met with a dietitian and a pediatrician/nurse during their study visits. The intervention group received individualized dietary counseling by the counseling team at 1- to 3-month intervals until the child was 2 years of age and twice yearly thereafter until 20 years of age. The child-oriented primary prevention of smoking was introduced at 8 years of age. The detrimental effects of exposure to environmental tobacco smoke were also discussed. A physically active lifestyle was encouraged, but no physical activity programs were offered to the intervention group. The children in the control group received only a basic health education as routinely given at Finnish well-baby clinics and school health care. The control group was met biannually until 7 years of age and annually thereafter until 20 years of age.
This study used data from participants between 15 and 20 years of age. Serum insulin and glucose were measured in 245 intervention adolescents (114 girls and 135 boys) and in 273 control adolescents (131 girls and 138 boys) at 15 years of age. At 20 years of age, there were 183 individuals (90 girls and 93 boys) in the intervention group and 225 (116 girls and 109 boys) in the control group. The numbers of participants at other age points are reported in Table 1. The study was approved by the Joint Commission on Ethics of the Turku University and the Turku University Central Hospital. Informed consent was obtained from all parents at the beginning of the trial and from the children at 15 years of age.
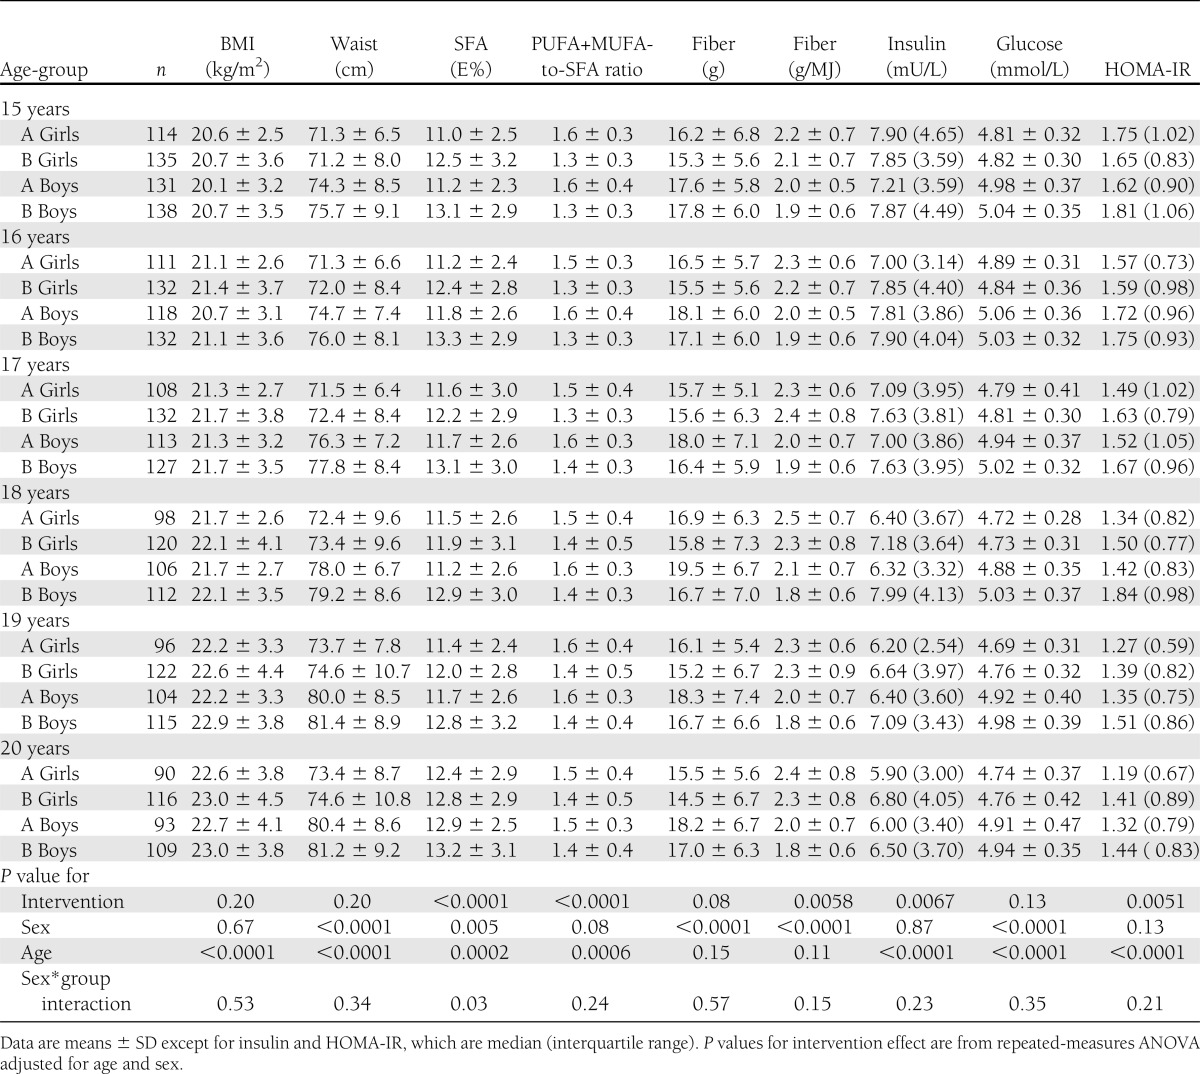
Table 1.
Characteristics of the intervention (A) and the control (B) girls and boys during the follow-up
Dietary counseling
Dietary counseling was individualized and designed to meet the Nordic Dietary Recommendations (22,23). Dietary changes were suggested based on the child’s food records, and topics that were specific to the family were discussed. A fixed diet was never ordered. The main goal was to reduce the intake of SFA and to replace it with unsaturated fat. The child’s fat intake was aimed at 30–35% of daily energy (E%), with a SFA-to-MUFA+PUFA ratio of 1:2.
The counseling was based on the age and cognitive ability of the child. From 7 years of age, more dietary information was given directly to the child, who was met alone by the counseling team. A major theme of the dietary counseling also during adolescence was the quality of fat. Use of fruits, vegetables, and whole-grain products (sources of fiber) was encouraged as well. Counseling on how to decrease salt intake began at 8 years of age. The parents were informed of the contents of the adolescent’s counseling session and were encouraged to discuss the same diet-related topics at home.
Food records
Food consumption was recorded using a 4-day food record (consecutive days, at least 1 weekend day included). A dietitian checked the food records for accuracy, and nutrient intakes were analyzed with Micro Nutrica software (24) based on the Food and Nutrient Database of the Social Insurance Institution, Finland. The program calculates 66 nutrients in commonly used foods and dishes in Finland. The data bank was continuously updated with new foods and personal recipes. Supplemental vitamins and minerals were not included.
Laboratory methods
Blood samples were taken annually after an overnight fast for the determination of serum insulin and glucose concentrations. For insulin analyses, the blood samples were centrifuged immediately and 15 µL enzyme inhibitor Antagosan or 30 µL Trasylol (beginning of year 2008) was added to the 0.5-mL serum sample. The samples were stored frozen until analyzed.
Serum insulin was measured with a microparticle enzyme immunoassay (Insulin IMX system reagent, Abbott, [Chicago, IL], interassay coefficient of variation [CV] 6.5%) or with a chemiluminescent microparticle immunoassay (ARCHITECT insulin assay, Abbott, USA, interassay CV 1.8%). To correct for differences in analytical level between the methods, a correlation equation obtained by standardized principal component analysis of results of samples analyzed with both methods was used. Serum glucose was measured by a hexokinase method (Glucose Olympus System Reagent, Olympus, Ireland, interassay CV 1.8%). To estimate insulin sensitivity, HOMA-IR (fasting insulin mU/mL × [fasting glucose (mmol/L)/22.5]) was calculated (25).
Serum samples of cotinine were stored at −70°C until analyzed. Cotinine, as a marker of tobacco smoke exposure, was analyzed as previously described (26). Briefly, cotinine was extracted into dichloroethane and analyzed on an Agilent 7890 gas chromatograph (Agilent J & W GC Column, Stat Phase HP-FFAP) equipped with a NPD Blos Bead detector. The analytical sensitivity of the method was 0.16 ng/mL. The intra- and interassay CVs at a cotinine concentration of 22 ng/mL were 4.4 and 11.7%, respectively. The interassay CV at a cotinine concentration of 1 ng/mL was 23.3% (27).
Weight, height, pubertal status, and physical activity
Weight was measured using an S10 electronic scale (Soehnle, Murrhardt, Germany) to the nearest 0.1 kg and height to the nearest 0.1 cm using a Harpender stadiometer (Holtain, Crymych, U.K.). BMI was calculated in kilograms/square of height in meters. Waist circumference (midway between iliac crest and the lowest rib at the midaxillary line) was measured with the flexible measuring tape to the nearest 0.5 cm. Pubertal status was recorded beginning at 9 years of age using Tanner stages (28). Mean duration, frequency, and intensity of habitual leisure-time physical activity (LTPA) was assessed using a self-administered questionnaire at 15, 17, and 19 years of age. LTPA was expressed as a multiple of the resting MET by multiplying the mean frequency, duration, and intensity of weekly LTPA (29).
Statistical analyses
The results are presented as mean ± SD or median (interquartile range). Serum HOMA-IR and fasting insulin values were log10-transformed for the analysis. Dietary fiber intake, the PUFA+MUFA-to-SFA ratio, and BMI were treated as continuous variables. However, to describe the data and to further study the associations, the participants were also divided into three categories according to their energy-adjusted fiber intake, PUFA+MUFA-to-SFA ratio and BMI: low (the lowest 25th percentile), average (50% of adolescents between 25th and 75th percentiles), and high (the highest 25th percentile). To get further insight of the intervention effect on glucose level without confounding puberty-related effects, the association was also examined in the subgroup between 17 and 20 years of age. Puberty was ongoing (Tanner stage 5 not reached) in 7.9% of the participants at 17 years of age.
Linear longitudinal data were analyzed with repeated-measures ANCOVA. All models included age and sex as covariates, and their interactions with the predictors were included in all single-predictor models. In the case of significant sex interactions, a sex-stratified analysis was conducted. The effect of the STRIP study group was tested on the main response HOMA-IR, fasting insulin (mU/L), and glucose (mmol/L), and the predictor variables of dietary fiber intake (g and g/MJ), PUFA+MUFA-to-SFA ratio, SFA (E%), BMI (kg/m2), and waist (cm) with single-predictor models. The effects of the aforementioned predictor values and covariates SFA (E%), PUFA (E%), MUFA (E%), PUFA+MUFA-to-SFA ratio, waist (cm), weight (kg), cotinine (ng/mL), LTPA (MET h/week), and pubertal status (1–5) on HOMA-IR were tested in single- and multipredictor repeated-measures ANCOVA models. All single- and multipredictor analyses were done with and without BMI as a confounder.
The distribution of puberty stages between the STRIP study groups was analyzed with χ2 test stratified by age and sex. P values <0.05 were considered statistically significant. All statistical analyses were performed using SAS 9.3 software (SAS Institute, Cary, NC).
RESULTS
The adolescents in the intervention group had a higher energy-adjusted fiber intake (g/MJ), lower SFA intake, and higher PUFA+MUFA-to-SFA ratio than the control adolescents between 15 and 20 years of age (Table 1). Mean BMI, waist circumference, and fiber intake in grams did not differ between the study groups. LTPA and pubertal development were similar in the intervention and control adolescents (data not shown). There was a study group-by-sex interaction when SFA was the outcome variable (P = 0.03). Intervention was associated with lower SFA intakes in both sexes, but the boys had a slightly more pronounced intervention effect (P < 0.0001) than the girls (P = 0.018). Other study group-by-sex interactions were nonsignificant, suggesting that the intervention effect was similar in girls and boys, and is therefore presented with sexes combined.
Effect of dietary intervention on insulin sensitivity
HOMA-IR was on average 0.12 (7.5%) and insulin 0.52 mU/L (7.1%) lower in the intervention group than in the control group between 15 and 20 years of age (Fig. 1). Intervention adolescents had lower HOMA-IR and insulin regardless of age. No difference was found in the glucose level between the study groups. In the subgroup analysis between 17 and 20 years of age, mean serum glucose was slightly lower, on average 0.054 mmol/L (1.1%), in the intervention group than in the control group (P = 0.025).
Figure 1.

Median (interquartile range) HOMA-IR (A) and insulin (B), and mean (SD) glucose levels (C) in the intervention and control groups during the follow-up. P values are for the intervention effect and study group*age interactions from repeated-measures ANOVA adjusted for age and sex.
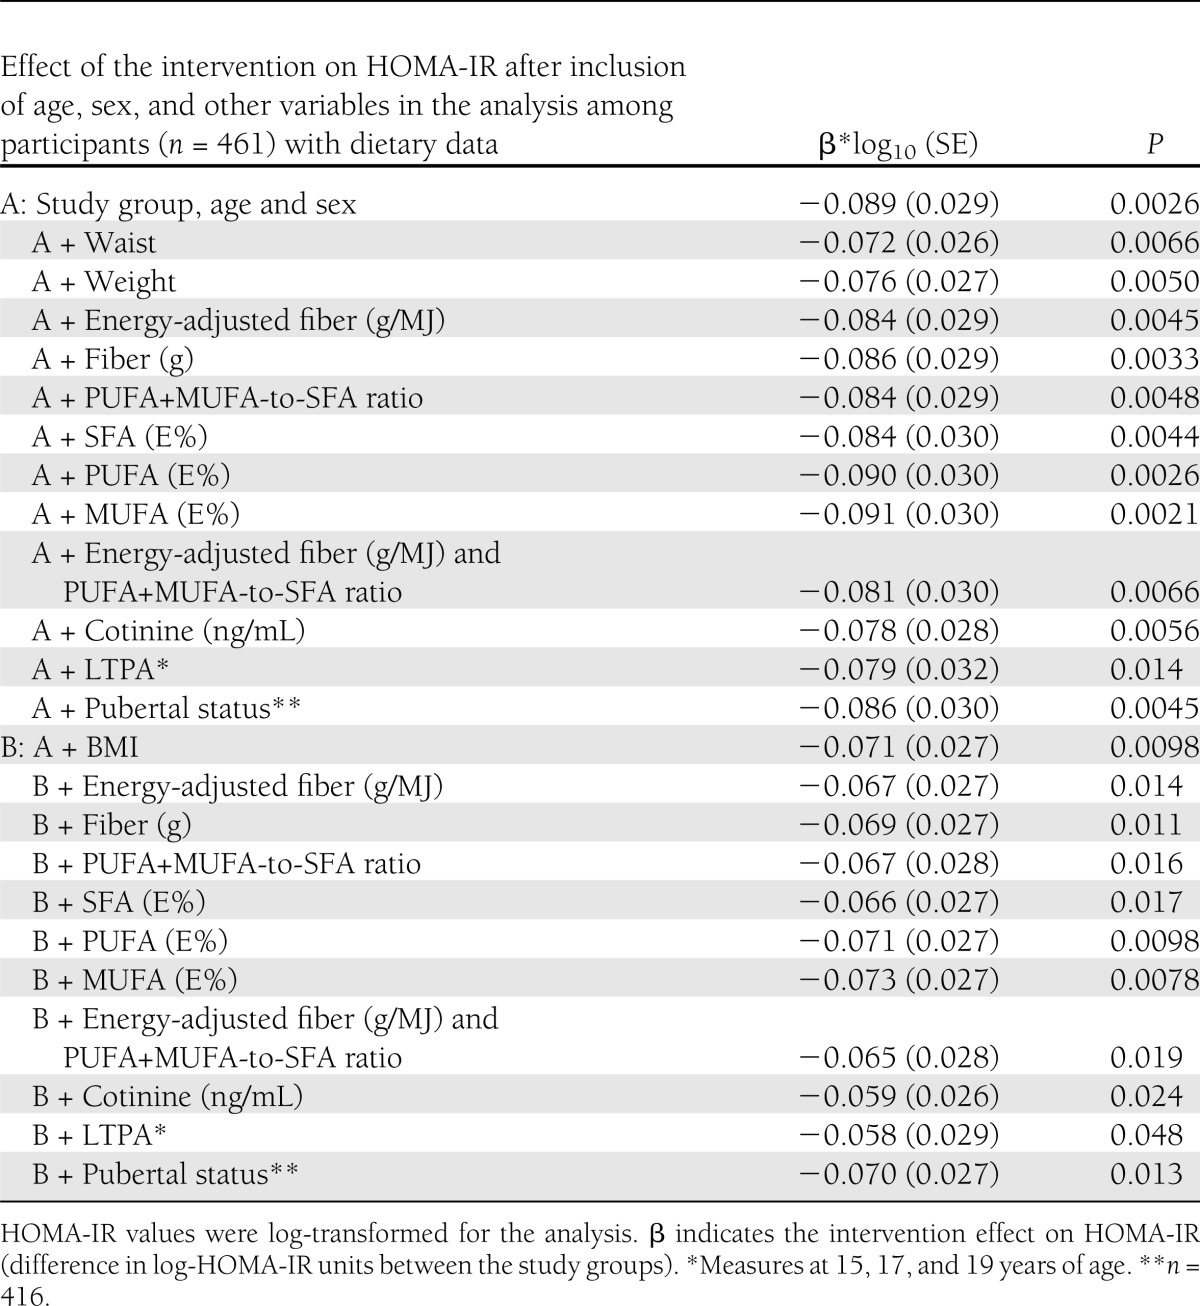
To gain insight on mechanisms possibly explaining the intervention effect on HOMA-IR, stepwise analyses were performed (Table 2). The difference in HOMA-IR between the intervention and control adolescents remained significant when waist, weight, or BMI was included in the analysis. The intervention effect on HOMA-IR was diluted by 19% when waist was included in the analysis and by 20% when BMI was included. Similarly, the intervention effect on HOMA-IR remained significant after including fiber intake (g and g/MJ), the PUFA+MUFA-to-SFA ratio, and SFA (E%), PUFA (E%), and MUFA (E%) intakes in the analysis. Fiber intake (g/MJ) and the PUFA+MUFA-to-SFA ratio together diluted the intervention effect by 9%, and when BMI was also included in the analysis, the intervention effect on HOMA-IR was diluted by 27%. Adjustment for cotinine, LTPA, or pubertal status did not change the result of the intervention effect in the age-, sex-, and BMI-adjusted models. The intervention effect on HOMA-IR was diluted by 35% after including BMI and LTPA in the analysis and by 34% when BMI and cotinine were included in the model.
Table 2.
Repeated-measures multivariate model of the intervention effect on HOMA-IR in healthy adolescents 15–20 years of age
Association of dietary fiber, fat, and BMI with HOMA-IR
The interaction of sex and energy-adjusted fiber intake (g/MJ) was significant (P = 0.037) when HOMA-IR was the outcome variable. Therefore, a sex-stratified analysis was performed. In girls, the association of fiber (g/MJ) with log HOMA-IR was highly significant (β −0.073 [SE 0.017], P < 0.0001), whereas no association was found in boys (β −0.0076 [0.026], P = 0.77; Fig. 2). The association in girls for fiber with HOMA-IR persisted after adjustment for BMI (P = 0.0025). Absolute fiber intake (g/day) also was associated with HOMA-IR (β −0.0038 [0.0016], P = 0.019), but the effect became nonsignificant after adjusting for BMI (P = 0.11). The PUFA+MUFA-to-SFA ratio (P = 0.13), and PUFA (P = 0.91), MUFA (P = 0.32), or SFA intake (P = 0.12) were not associated with HOMA-IR. Similarly, no difference in HOMA-IR was found between the adolescents with a low or high PUFA+MUFA-to-SFA ratio during the follow-up (P = 0.29).
Figure 2.

Median (interquartile range) HOMA-IR in the low (<25%) and high (>75%) dietary fiber intake (g/MJ) groups in girls (A) and in the low and high BMI groups with the sexes combined (B). P values are for the dietary fiber intake, BMI, and study group*age interaction from repeated-measures ANOVA adjusted for age and sex. Dietary fiber intake and BMI were used as continuous variables in the analyses.
BMI (β 0.052 [SE 0.0033], P < 0.0001) (Fig. 2) and waist (β 0.022 [0.0012], P < 0.0001) were associated with HOMA-IR, regardless of age, during the follow-up. Adolescents with a BMI below the 25th percentile had an average 0.52 (27.8%) lower HOMA-IR than those with a BMI above the 25th percentile (P < 0.0001).
CONCLUSIONS
This study demonstrated that the intervention given in the STRIP study had a beneficial effect on insulin sensitivity among healthy adolescents between 15 and 20 years of age. In the intervention group, the PUFA+MUFA-to-SFA ratio and dietary fiber (g/MJ) intake were higher, but the intervention effect on insulin sensitivity was only partially explained by these dietary components or other mediators such as BMI, pubertal status, physical activity, or cotinine.
There is a lack of dietary intervention studies on insulin sensitivity among healthy adolescents. In the DISC study that examined children with elevated LDL-cholesterol, benefits on glucose level were found in young women 9 years after the low-fat and high-fiber dietary intervention was ended (15). Interestingly, no intervention effect on glucose level was found at the end of the intervention in adolescence at 14–19 years of age. Our study showed that the benefits of the STRIP intervention on insulin sensitivity continued from childhood (14) to adolescence.
The intervention effect persisted when dietary fat quality, dietary fiber intake, BMI, waist circumference, physical activity, cotinine (an indicator of smoking and passive smoking exposure), and pubertal status were included in the analyses, indicating that other factors may also be mediating the effect. The dietary effects of intervention on insulin sensitivity may be complex and therefore not entirely captured by the measured fiber intake and quality of dietary fat. The dietary counseling may also include components that are not measurable by the methods used. The glucose levels were similar in the intervention and control adolescents between 15 and 20 years of age. However, in a subgroup analysis at 17–20 years of age, the intervention adolescents had a lower glucose level than the control group adolescents. This suggests that although most of the effect on HOMA-IR is due to changes in insulin levels, small reductions within the normoglycemic range in serum glucose may also play a role.
Previously, a lower SFA intake was suggested to be the explanation for a part of the HOMA-IR–lowering effect of the STRIP intervention at 9 years of age, but the effect of fiber was not studied (14). Among U.S. adolescents and young adults, low fiber consumption has been reported to predict the metabolic syndrome (13) and insulin levels (12) more strongly than SFA consumption. In the current study, the quality the dietary fat or SFA intake did not significantly associate with HOMA-IR. The energy-adjusted fiber intake was associated with HOMA-IR, but only in girls. One may argue that among the intervention subjects, some individuals exhibited higher insulin sensitivity due to high fiber intake and others due to low SFA intake, making it difficult to analyze statistically the contribution of the two factors in the whole population. Nevertheless, our result may suggest that the intake of dietary fiber could be a stronger determinant of insulin sensitivity than the quality of fat in adolescence. In addition to diet, overweight and obesity are associated with insulin sensitivity, the metabolic syndrome, and type 2 diabetes (1,11,30). In line, our results indicated a marked effect of BMI and waist circumference on HOMA-IR during the follow-up in adolescence. However, these links did not explain the intervention effect, because there were no significant differences in adiposity between intervention and control groups.
We have reported that the STRIP intervention decreases SFA intake through childhood to adolescence (20). In this study, the higher PUFA+MUFA-to-SFA ratio in the intervention adolescents further indicated the success to replace SFA with unsaturated fat. However, not even the intervention group is at a recommended level (23,31). The intervention adolescents also had higher fiber content in the diet. Although modifying the quality of dietary fat was the main goal of the intervention, suggestions to increase fiber intake were additionally given (1,19). The dietary fat–oriented intervention may also have increased the intake of dietary fiber concomitantly, because modification of dietary fat may affect the intake of fiber-rich foods (21). A high dietary fiber intake may reduce the risk of the metabolic syndrome and development of type 2 diabetes (5,11,13,16). The beneficial intervention effect on dietary fiber, in addition to fat quality, may thus have implications for future cardiovascular health.
A potential limitation of the STRIP study is the possible selection bias in the initial recruitment of the subjects: the participating families might have been more interested in health-related issues than the nonparticipants. However, this would make differences between the study groups even more difficult to find. Although no intervention was given, the dietary habits of the control group may also have been influenced by the regular, annual study visits (e.g., information on cholesterol levels, filling in the food records) and the publicity of the study. Of note is that the intervention group has been met more frequently since 7 years of age than the control group.
During an extensive study period as in the STRIP, it is inevitable that loss to follow-up occurs. The characteristics of the remaining and discontinuing participants have been repeatedly compared, and no systematic differences have been found (19). The main reasons for loss to follow-up were moving away from the community, recurrent infections, and reluctance to undergo blood sampling. As a consequence, it is unlikely that a systematic bias has influenced the results, and therefore, it is reasonable to assume that the results would be applicable to the general pediatric population.
Because the STRIP intervention also included other counseling in addition to low-saturated-fat dietary counseling, it is difficult to dissect the distinct beneficial components of the intervention on insulin sensitivity. Another limitation is that the data did not allow us to study the separate effects of cereal and fruit/vegetable fiber on HOMA-IR (32). The use of a subjective method to study diet may have hampered the detection of significant associations between diet and insulin sensitivity. Further, HOMA-IR instead of more complex methods, such as the euglycemic clamp technique, was used to indicate insulin sensitivity, and LTPA was not assessed annually. However, fasting insulin level and HOMA-IR correlate in nondiabetic subjects relatively well with insulin sensitivity determined by the clamp technique (33).
Major strengths of the study are the long follow-up period in adolescence, the sample size, and the use of well-established methods (21). Beneficial intervention effects on insulin sensitivity were found in healthy adolescents during a challenging period of puberty when own food choices are made increasingly more often.
In conclusion, the favorable effect of the STRIP intervention on insulin sensitivity extends from childhood to pubertal age and further into early adulthood. The results of the study further justify the recent Nordic Nutrition Recommendations (23) and recommendations of American Academy of Pediatrics (31) for healthy children in incremental type 2 diabetes prevention (34,35). The results show that dietary and cardiometabolic risk factor changes can be introduced in adolescence through intervention. Future studies will determine the long-term effects of STRIP intervention on insulin sensitivity in later adulthood.
Acknowledgments
This work was financially supported by Academy of Finland (grants 206374 and 251360), Finnish Ministry of Education and Culture, Finnish Cardiac Research Foundation, Finnish Cultural Foundation, Foundation for Pediatric Research, the Mannerheim League for Child Welfare, Yrjö Jahnsson Foundation, Sigrid Juselius Foundation, Emil Aaltonen Foundation, Aarne Koskelo Foundation, Juho Vainio Foundation, Special Governmental Grants for Health Sciences Research, Turku University Hospital, and Turku University Foundation.
No potential conflicts of interest relevant to this article were reported.
O.O. substantially contributed to the conception and the design of the study, analyzed and interpreted data, and drafted and wrote the manuscript. K.P. and O.T.R. substantially contributed to the conception and the design of the study design; acquired, analyzed, and interpreted data; and revised the manuscript for important intellectual content. S.R., H.N., H.L., J.S.A.V., A.J., B.-M.L., O.S., and T.R. substantially contributed to the conception and the study design, acquired data, contributed to discussion, and reviewed the manuscript critically for important intellectual content. All authors read and approved the final version of the manuscript. O.O. is the guarantor of this work and, as such, had full access to all the data in the study and takes responsibility for the integrity of the data and the accuracy of the data analysis.
The authors thank Maiju Saarinen (University of Turku, Turku, Finland) for her statistical assistance in this study.
Footnotes
Clinical trial reg. no. NCT00223600 (STRIP19902010), clinicaltrials.gov.
A slide set summarizing this article is available online.
References
- 1.Magnussen CG, Niinikoski H, Juonala M, et al. When and how to start prevention of atherosclerosis? Lessons from the Cardiovascular Risk in the Young Finns Study and the Special Turku Coronary Risk Factor Intervention Project. Pediatr Nephrol 2012;27:1441–1452 [DOI] [PubMed] [Google Scholar]
- 2.Sesé MA, Jiménez-Pavón D, Gilbert CC, et al. HELENA Study Group Eating behaviour, insulin resistance and cluster of metabolic risk factors in European adolescents. The HELENA study. Appetite 2012;59:140–147 [DOI] [PubMed] [Google Scholar]
- 3.Daniels SR. Diet and primordial prevention of cardiovascular disease in children and adolescents. Circulation 2007;116:973–974 [DOI] [PubMed] [Google Scholar]
- 4.Schofield CJ, Sutherland C. Disordered insulin secretion in the development of insulin resistance and type 2 diabetes. Diabet Med 2012;29:972–979 [DOI] [PubMed] [Google Scholar]
- 5.Anderson JW, Baird P, Davis RH, Jr, et al. Health benefits of dietary fiber. Nutr Rev 2009;67:188–205 [DOI] [PubMed] [Google Scholar]
- 6.Garg A. Insulin resistance in the pathogenesis of dyslipidemia. Diabetes Care 1996;19:387–389 [DOI] [PubMed] [Google Scholar]
- 7.Williams CL. Importance of dietary fiber in childhood. J Am Diet Assoc 1995;95:1140–1146, 1149; quiz 1147–1148 [DOI] [PubMed] [Google Scholar]
- 8.Xu P, Cuthbertson D, Greenbaum C, Palmer JP, Krischer JP, Diabetes Prevention Trial-Type 1 Study Group Role of insulin resistance in predicting progression to type 1 diabetes. Diabetes Care 2007;30:2314–2320 [DOI] [PubMed] [Google Scholar]
- 9.Jeffery AN, Metcalf BS, Hosking J, Streeter AJ, Voss LD, Wilkin TJ. Age before stage: insulin resistance rises before the onset of puberty: a 9-year longitudinal study (EarlyBird 26). Diabetes Care 2012;35:536–541 [DOI] [PMC free article] [PubMed] [Google Scholar]
- 10.Haffner SM, Mykkänen L, Festa A, Burke JP, Stern MP. Insulin-resistant prediabetic subjects have more atherogenic risk factors than insulin-sensitive prediabetic subjects: implications for preventing coronary heart disease during the prediabetic state. Circulation 2000;101:975–980 [DOI] [PubMed] [Google Scholar]
- 11.de Mello VDF, Lindström J, Eriksson J, et al. Insulin secretion and its determinants in the progression of impaired glucose tolerance to type 2 diabetes in impaired glucose-tolerant individuals: the Finnish Diabetes Prevention Study. Diabetes Care 2012;35:211–217 [DOI] [PMC free article] [PubMed] [Google Scholar]
- 12.Ludwig DS, Pereira MA, Kroenke CH, et al. Dietary fiber, weight gain, and cardiovascular disease risk factors in young adults. JAMA 1999;282:1539–1546 [DOI] [PubMed] [Google Scholar]
- 13.Carlson JJ, Eisenmann JC, Norman GJ, Ortiz KA, Young PC. Dietary fiber and nutrient density are inversely associated with the metabolic syndrome in US adolescents. J Am Diet Assoc 2011;111:1688–1695 [DOI] [PubMed] [Google Scholar]
- 14.Kaitosaari T, Rönnemaa T, Viikari J, et al. Low-saturated fat dietary counseling starting in infancy improves insulin sensitivity in 9-year-old healthy children: the Special Turku Coronary Risk Factor Intervention Project for Children (STRIP) study. Diabetes Care 2006;29:781–785 [DOI] [PubMed] [Google Scholar]
- 15.Dorgan JF, Liu L, Barton BA. Adolescent diet and metabolic syndrome in young women: results of the dietary intervention study in children (DISC) follow-up study. J Clin Endocrinol Metab 2011;96:e1999–e2008 [DOI] [PMC free article] [PubMed]
- 16.Misra A, Khurana L, Isharwal S, Bhardwaj S. South Asian diets and insulin resistance. Br J Nutr 2009;101:465–473 [DOI] [PubMed] [Google Scholar]
- 17.Jula A, Marniemi J, Huupponen R, Virtanen A, Rastas M, Rönnemaa T. Effects of diet and simvastatin on serum lipids, insulin, and antioxidants in hypercholesterolemic men: a randomized controlled trial. JAMA 2002;287:598–605 [DOI] [PubMed] [Google Scholar]
- 18.Vessby B, Uusitupa M, Hermansen K, et al. KANWU Study Substituting dietary saturated for monounsaturated fat impairs insulin sensitivity in healthy men and women: the KANWU Study. Diabetologia 2001;44:312–319 [DOI] [PubMed] [Google Scholar]
- 19.Simell O, Niinikoski H, Rönnemaa T, et al. STRIP Study Group Cohort profile: The STRIP study (Special Turku Coronary Risk Factor Intervention Project), an infancy-onset dietary and life-style intervention trial. Int J Epidemiol 2009;38:650–655 [DOI] [PubMed] [Google Scholar]
- 20.Niinikoski H, Pahkala K, Ala-Korpela M, et al. Effect of repeated dietary counseling on serum lipoproteins from infancy to adulthood. Pediatrics 2012;129:e704–e713 [DOI] [PubMed] [Google Scholar]
- 21.Ruottinen S, Lagström HK, Niinikoski H, et al. Dietary fiber does not displace energy but is associated with decreased serum cholesterol concentrations in healthy children. Am J Clin Nutr 2010;91:651–661 [DOI] [PubMed] [Google Scholar]
- 22.NNR Nordic nutrition recommendations 1996. Nordic Working Group on Diet and Nutrition. Scand J Nutr 1996;40:161–165 [Google Scholar]
- 23.Nordic Council of Ministers Nordic Nutrition Recommendations 2004, Integrating Nutrition and Physical Activity. Copenhagen, Nord, 2004, p. 13 [Google Scholar]
- 24.Hakala P, Marniemi J, Knuts L-R, Kumpulainen J, Tahvonen R, Plaami S. Calculated vs. analyzed nutrient composition of weight reduction diets. Food Chem 1996;57:71–75 [Google Scholar]
- 25.Matthews DR, Hosker JP, Rudenski AS, Naylor BA, Treacher DF, Turner RC. Homeostasis model assessment: insulin resistance and beta-cell function from fasting plasma glucose and insulin concentrations in man. Diabetologia 1985;28:412–419 [DOI] [PubMed] [Google Scholar]
- 26.Feyerabend C, Russell MA. A rapid gas-liquid chromatographic method for the determination of cotinine and nicotine in biological fluids. J Pharm Pharmacol 1990;42:450–452 [DOI] [PubMed] [Google Scholar]
- 27.Kallio K, Jokinen E, Hämäläinen M, et al. Impact of repeated lifestyle counselling in an atherosclerosis prevention trial on parental smoking and children’s exposure to tobacco smoke. Acta Paediatr 2006;95:283–290 [DOI] [PubMed] [Google Scholar]
- 28.Tanner JM. Growth at Adolescence. 2nd ed. Oxford, U.K., Blackwell, 1962 [Google Scholar]
- 29.Pahkala K, Heinonen OJ, Simell O, et al. Association of physical activity with vascular endothelial function and intima-media thickness. Circulation 2011;124:1956–1963 [DOI] [PubMed] [Google Scholar]
- 30.Marcus MD, Foster GD, El Ghormli L, et al. Shifts in BMI category and associated cardiometabolic risk: prospective results from HEALTHY study. Pediatrics 2012;129:e983–e991 [DOI] [PMC free article] [PubMed] [Google Scholar]
- 31.American Academy of Pediatrics. Committee on Nutrition Cholesterol in childhood. Pediatrics 1998;101:141–147 [PubMed] [Google Scholar]
- 32.Steffen LM, Jacobs DR, Jr, Murtaugh MA, et al. Whole grain intake is associated with lower body mass and greater insulin sensitivity among adolescents. Am J Epidemiol 2003;158:243–250 [DOI] [PubMed] [Google Scholar]
- 33.Laakso M. How good a marker is insulin level for insulin resistance? Am J Epidemiol 1993;137:959–965 [DOI] [PubMed] [Google Scholar]
- 34.American Diabetes Association Type 2 diabetes in children and adolescents. Diabetes Care 2000;23:381–389 [DOI] [PubMed] [Google Scholar]
- 35.Wabitsch M, Hauner H, Hertrampf M, et al. Type II diabetes mellitus and impaired glucose regulation in Caucasian children and adolescents with obesity living in Germany. Int J Obes Relat Metab Disord 2004;28:307–313 [DOI] [PubMed] [Google Scholar]