

Abstract
OBJECTIVE
Regular physical activity (PA) reduces the risk of developing type 2 diabetes, and different subtypes of dysglycemia have shown different associations with PA. To better understand the associations of PA and glucose homeostasis, we examined the association of objectively measured PA energy expenditure (PAEE) with detailed measures of glucose homeostasis.
RESEARCH DESIGN AND METHODS
In 1,531 men and women, with low to high risk of developing type 2 diabetes, we measured 7 days of PAEE using a combined accelerometry and heart rate monitor (ActiHeart). Measures and indices of glucose homeostasis were derived from a 3-point oral glucose tolerance test in addition to measures of long-term glycemia (glycated hemoglobin A1c and advanced glycation end products). Associations of PAEE with glucose homeostasis markers were examined using linear regression models.
RESULTS
Median age (IQR) was 66.6 years (62.1–71.6) (54% men) with a median ActiHeart wear time of 6.9 days (6.0–7.1) and PAEE level of 33.0 kJ/kg/day (23.5–46.1). In fully adjusted models, we found higher levels of PAEE to be positively associated with insulin sensitivity and negatively with insulin 2 h after glucose load (P < 0.05).
CONCLUSIONS
Even in an elderly population with low levels of PA, we found higher objectively measured PAEE levels to be associated with a more beneficial glucose metabolic profile. Although our findings are cross-sectional, they indicate that even without high-intensity exercise, increasing the overall level of PAEE slightly in an entire population at risk for developing type 2 diabetes may be a realistic and worthwhile goal to reach in order to achieve beneficial effect in terms of glucose metabolism.
Regular physical activity (PA) reduces the risk of developing type 2 diabetes by 15–60%. In cross-sectional and prospective studies, PA of light intensity as well as moderate to vigorous intensity have been related to a better glucose homeostasis (1–3), whereas other studies have found overall PA to be the main determinant of insulin sensitivity (1,4). Although some of the current evidence linking PA with glucose homeostasis has been established in large studies with prospective designs (2,5), epidemiological studies have traditionally used PA measures obtained by self-report methods, which are subject to bias. Even though heart rate monitors and accelerometers have increased in popularity as PA measurement methods (6), both have disadvantages in the assessment of PA (7). In contrast, PA monitors combining heart rate monitoring and accelerometry have shown to give more precise estimates of PA than the subjective methods and the separately measured accelerometry and heart rate (8). Even though the use of the combined PA monitors is increasing, no studies have yet studied the association between habitual PA as measured with these monitors and detailed glucose homeostasis measures in larger population-based studies. Previous epidemiological studies have investigated the association of PA measures with glucose homeostasis based on fasting and 2-h samples of glucose and insulin (1,2,4,9). The use of more detailed indices of insulin resistance and β-cell function, based on a 3-point rather than a 2-point oral glucose tolerance test (OGTT), may lead to deeper insight into the pathophysiological derangements that precede and lead to diabetes (10). Since subtypes of dysglycemia may show different associations with PA (5), including specific indices of peripheral insulin sensitivity, hepatic insulin resistance, β-cell function, and the absolute insulin response to a glucose load may provide a more detailed picture of the association of PA and glucose homeostasis. Furthermore, glycated hemoglobin A1c (HbA1c), which reflects the average glucose level over a longer period of time, has been suggested to be modifiable by exercise of moderate to vigorous intensity (11). Another measure of the even longer-term load of protein glycation is the skin accumulation of advanced glycation end products (AGEskin), which is in part affected by hyperglycemia (12). AGEskin has, in type 2 diabetes patients, been postulated to be associated with HbA1c in cross-sectional studies and with cardiovascular disease and cardiovascular mortality in prospective studies (13,14). It is not known whether PA affects levels of AGEskin, or whether associations of PA with HbA1c and AGEskin point in the same direction.
The current study tests the hypothesis that higher PA levels, as measured by a combined accelerometer and heart rate monitor, are associated with a better glucose metabolic profile. In order to better understand the pathophysiological pathways linking PA and glucose homeostasis, we described the PA levels in a population at high risk of developing diabetes and examined the association of accelerometer- and heart rate–assessed PA energy expenditure (PAEE) during everyday life with various glucose homeostasis markers and long-term glycemia in a cross-sectional design. Furthermore, we studied the course of glucose and insulin during a 3-point OGTT by different levels of PAEE.
RESEARCH DESIGN AND METHODS
Study design
We performed a cross-sectional analysis based on PAEE and glucose homeostasis measurements at the 6-year follow-up health examination of a population at low to high risk of developing diabetes, recruited based on a stepwise screening procedure in 2001–2006 (15). People with different elevated diabetes risk profiles at the time of screening, but without diabetes, were invited to participate in the follow-up health examination (the ADDITION-PRO study) (16). Health examinations took place from 2009 to 2011 at four centers in Denmark. The study was approved by the ethical committee of the Central Denmark Region (journal no. 20080229) and was conducted in accordance with the 1996 Helsinki Declaration. All participants provided written informed consent.
Study population
In total, 4,188 people were invited to the ADDITION-PRO study. Of these, 2,082 people (50% of invited) participated and underwent a health examination. A full description of the invitation procedure and the baseline diabetes risk groups (combined impaired fasting glycemia and impaired glucose tolerance, isolated impaired glucose tolerance, isolated impaired fasting glycemia, high diabetes risk but normal glucose tolerance, and elevated, moderate, and low diabetes risk) have been defined elsewhere (16). For the present analysis, participants with incident diabetes since screening (n = 329) and participants fasting <8 h prior to the health examination (n = 11) were excluded. Of the 1,742 remaining participants, only participants with valid data in the outcome variables (markers of glucose homeostasis and long-term glycemia) were included in the present analysis (n = 1,531) (Supplementary Fig. 1).
Measurement methods
Information on age (years) and sex was derived from the unique Danish civil registration number. Employment status (yes/no), alcohol consumption (units per week, 1 unit = 12 g of pure alcohol), and smoking status (current smoker/never smoker/ex-smoker) were obtained from a self-report questionnaire completed at the ADDITION-PRO examination day. Height in meters was measured without shoes to the nearest millimeter using a stadiometer (Seca, Hamburg, Germany), and weight in kilograms was measured and rounded to the nearest 0.1 kg, using a Tanita scale with the participants wearing light indoor clothes but without shoes (Tanita Corporation Inc., Tokyo, Japan). Clothes were estimated to weigh 0.5 kg, and thus this weight was subtracted from the total weight. Waist circumference, in centimeters, was measured to the nearest millimeter, at the midpoint between the lower rib margin and the iliac crest using an unstretchable tape measure without any pressure on the skin.
PA.
PA was measured using a combined accelerometer and heart rate monitor (ActiHeart; CamNTech Ltd., Cambridge, U.K.) (17). To ensure individual calibration of the heart rate to PA intensity, a submaximal step test was performed on the day of the health examination. The 8-min step test was administered from the ActiHeart software to indicate the cycles of stepping up and down a 20.5-cm step bench (Rucanor Europe B.V., Nieuwerkerk, the Netherlands). The stepping frequency ranged from 15 to 33 step cycles per minute over the duration of the test, followed by a 2-min recovery period (sitting). After participants had completed the step test, the monitor was set up to record long-term PA, registering movement and heart rate every 60 s. The monitor was placed horizontally on the participant’s chest with two standard electrocardiogram electrodes (Maxensor, Alton, U.K.), one at the lower part of the sternum and the other one to the left on the same horizontal level, as laterally as possible. Participants were asked to wear the monitor for 7 days and nights and to maintain their usual PA pattern during the period. Participants additionally completed a PA questionnaire, a modified (Danish) version of the recent PA questionnaire (18), asking about type, frequency, intensity, and context of PA performed in the last 4 weeks prior to the health examination. Additionally, as part of the general questionnaire, participants categorized their typical leisure time PA (modified from Saltin and Grimby [19]) as 1) mainly sedentary (e.g., reading or watching television or movies); 2) low PA level, engaging in light physical activities for >4 h per week (e.g., leisurely walking, leisurely cycling, light do-it-yourself tasks, light house chores, table tennis, and bowling); 3) moderate PA level, engaging in sports or exercises minimum three times per week or vigorous leisure time activities (e.g., heavy gardening); or 4) high PA level, engaging in competitive sports or long distance running several times per week.
Glucose homeostasis markers.
At the health examination, venous blood samples were drawn after a verified overnight fast (≥8.0 h). After this, participants drank a glucose drink (75 g glucose dissolved in 250 mL water) as part of a standardized OGTT, with blood samples drawn 30 and 120 min after the glucose intake. Plasma glucose (0, 30, 120 min) was determined using the Hitachi 912 system (Roche Diagnostics, Mannheim, Germany) from 2009 to April 2010. From April 2010, glucose was assessed using the Vitros 5600 system (Ortho Clinical Diagnostics, Illkirch Cedex, France). Since the agreement between the methods was modest, all Vitros values were converted to the Hitachi values, using the regression equation from a method comparison (adjusted glucose value = original glucose value + 0.2637/0.983). Serum insulin (0, 30, 120 min) was determined by an immunoassay method (AutoDELFIA; PerkinElmer, Waltham, MA). HbA1c was determined by high-performance liquid chromatography (TOSOH G7, Tokyo, Japan). AGEskin was assessed using skin autofluorescence (AGE Reader SU; Diagnoptics Technologies B.V., Groningen, the Netherlands). Glycemic indices were derived from glucose and insulin measures from the OGTT. Measures of insulin resistance were derived from homeostasis model assessment of insulin resistance: HOMA-IR (mmol/L ⋅ mU/L) = fasting plasma glucose (mmol/L) × [fasting plasma insulin (pmol/L)/6.945]/22.5 (20). The insulin sensitivity index (ISI0,120) was calculated according to Gutt et al. (21) to give an estimate of insulin sensitivity in the peripheral tissues. β-Cell function was determined by calculating the disposition index (DI) (22). To do this, first-phase insulin release was calculated as described by Stumvoll et al. (23). DI was then calculated using the following formula: DI = first phase insulin releaseStumvoll × ISI0,120. Absolute insulin response to the glucose load was determined by calculating the insulinogenic indext30min (24).
Data processing
PA measures.
Heart rate and accelerometry measures from the ActiHeart monitor were downloaded to the manufacturer’s software (www.camntech.com). Noisy heart rate measures were reduced and periods of nonwear were inferred from the combination of nonphysiological heart rate and prolonged periods of inactivity (to minimize diurnal information bias when summarizing the intensity time series into PAEE measures), using the procedure published by Stegle et al. (25). PA measures were derived by combining minute-to-minute heart rate and accelerometry measures using a “branched equation model” (17). The relation between heart rate and PAEE was calibrated using data from the individually performed submaximal step test. Based on 1,046 ADDITION-PRO participants with a valid step test, a “group calibration” was derived based on regression coefficients from the heart rate–to-PAEE relationship. This group calibration was then used to calibrate the relation between heart rate and PAEE for participants who did not perform the submaximal step test, including information on sex, age, and sleeping heart rate of the individual (26). Accelerometry data were converted to energy expenditure using equations corresponding to walking or running (26). The 2005 Oxford Model (27) was used to estimate basal metabolic rate. ActiHeart provided minute-by-minute measurements of PAEE in kJ/kg. From these, the fraction of time (per hour) spent in PA intensity groups, expressed as multiples of predicted resting metabolic rate (METs), was derived. All measures were summarized to daily measures. Only measures from participants with a minimum of 24 h of ActiHeart wear time were considered valid for the present analysis. From the recent PA questionnaire, time (hours per week) spent in different activities was computed.
Statistical analyses
For all explanatory variables, we performed multivariate imputation by chained equations procedure (28), using 50 imputations. We examined the association of daily PAEE (kJ/kg/day) with the different glucose homeostasis markers and long-term glycemia using multiple linear regression analyses. We adjusted for baseline diabetes risk group based on the results of the ADDITION-Denmark stepwise screening procedure performed in 2001–2006 (15) to control for different invitation procedure and as an indicator of participant clinical history. Further adjustments included age, sex, employment status, smoking, and alcohol consumption. Furthermore, due to the potential confounding role of obesity on the link between PA and glucose homeostasis, adjustments for waist circumference were included in the full model. Waist circumference (a measure of central adiposity) was chosen, since central adiposity has been suggested to be a better predictor of diabetes than general obesity (as measured by BMI) (29). Repeated measures of glucose and insulin (at 0, 30, and 120 min during the OGTT) were analyzed by a random-effects mixed model with a random slope of time since glucose intake. The plasma glucose and serum insulin trajectories for different levels of PAEE were plotted over time since glucose load, accounting for age, sex, and diabetes risk group. All statistical analyses were performed in R statistical software, program version 2.15.0.
RESULTS
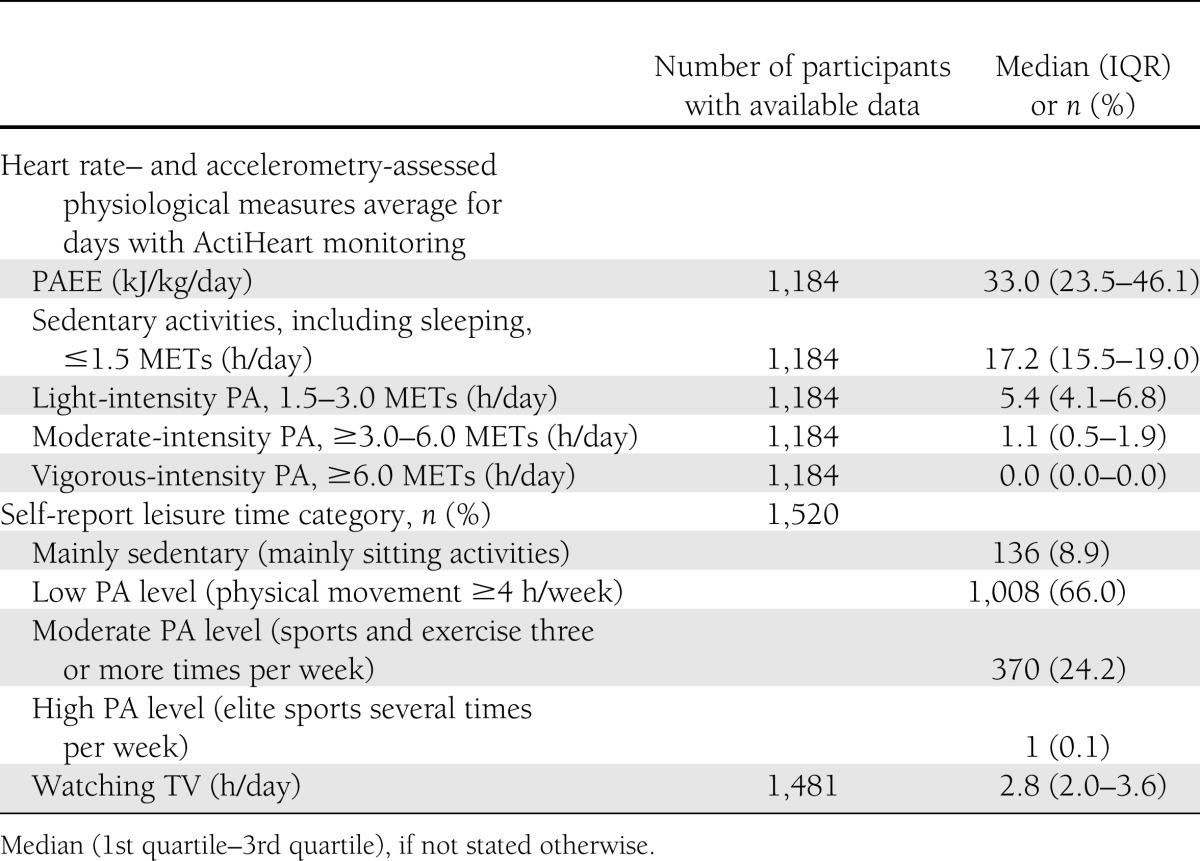
Demographical, clinical, and behavioral characteristics for the study sample are presented in Table 1. The median (25th–75th percentile) ActiHeart wear time was 6.9 days (6.0–7.1). Median PAEE was 33 kJ/kg/day (23.5–46.1), amounting to 2,591 kJ/day for a person weighing 78.5 kg (median weight of the study population). Over 24 h, 72% of the time was spent ≤1.5 METs (including sleeping), 23% of the time was spent with light intensity activities (>1.5 to 3.0 METs), and 5% was spent with PA of moderate to vigorous intensity (≥3 METs) (Table 2). The majority of the population (66%) reported a leisure time characterized by low PA level, e.g., walking, cycling, and light home activities (Table 2), whereas one-quarter of the population reported having a moderate PA level during leisure time, participating in sports or exercising more than three times per week. Only 9% of the population reported to have leisure time characterized as mainly sedentary. Median values of glucose homeostasis markers revealed a population with incipient deterioration in glucose metabolism (Table 1).
Table 1.
Demographical, behavioral, and clinical characteristics of the ADDITION-PRO population (n = 1,531)
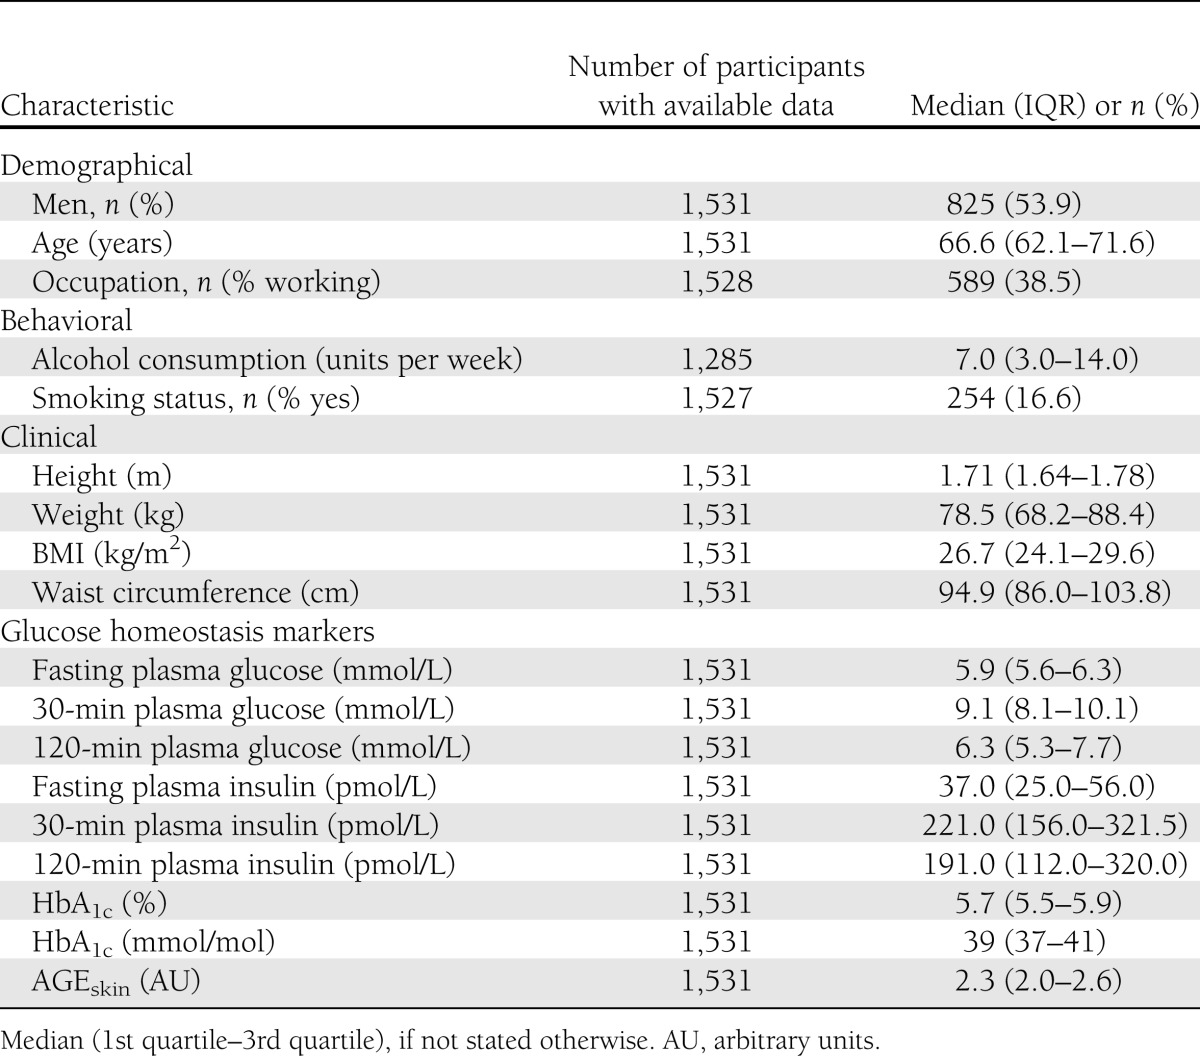
Table 2.
ActiHeart-assessed and self-reported PA characteristics of the ADDITION-PRO population (n = 1,531)
In models adjusting for age, sex, diabetes risk group (at baseline screening), occupation, alcohol intake, and smoking status, PAEE was positively associated with ISI0,120 and negatively associated with 2-h plasma glucose, plasma serum insulin (0, 30, 120 min), and HOMA-IR (Table 3, model 2). After additionally adjusting for waist circumference, these associations remained significant for 120-min plasma insulin and ISI0,120 only (Table 3, model 3).
Table 3.
Associations of daily PAEE with glucose homeostasis markers (n = 1,531)
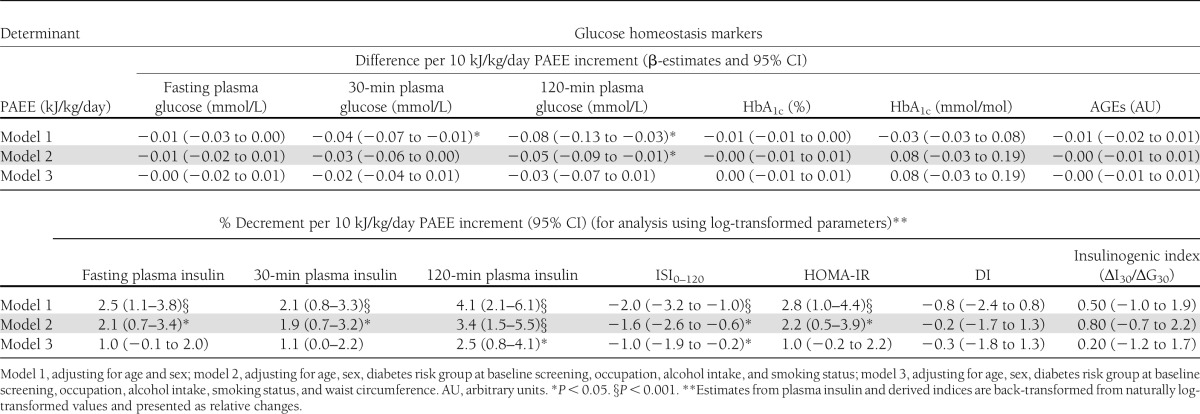
Figure 1 illustrates the effects shown in the previous models for an example of a 66-year-old man in the baseline diabetes risk group “high diabetes risk but normal glucose tolerance.” The modeled values indicate a more rapid glucose uptake with higher PAEE level (Fig. 1A), whereas the insulin response to the glucose load is lower the higher PAEE levels (Fig. 1B).
Figure 1.

Glucose concentration (mmol/L) (A) and insulin concentration (B) per time since glucose load for a man 66 years of age with baseline high diabetes risk but normal glucose tolerance by different PA levels (10–70 kJ/kg/day) (black = 10 kJ/kg/day; light gray = 70 kJ/kg/day).
CONCLUSIONS
We found that in a population at low to high diabetes risk, objectively assessed PA levels were generally of light intensity but nonetheless positively associated with insulin sensitivity and negatively associated with insulin concentration 2 h after glucose load.
PA patterns
We found the median PAEE level to be 33 kJ/kg/day, equaling 2,590 kJ/day for a person weighing 78.5 kg. In comparison, Vaughan et al. (30) found slightly lower mean PAEE (∼2,190 kJ/day) in a slightly older (mean age, 71 years) American population, as measured by a respiratory chamber method. In different European populations, PAEE levels seem to differ markedly according to the assessment method. Adult populations where PAEE has been assessed by heart rate monitors alone (9) show higher PAEE levels than adult populations where PAEE has been assessed by accelerometry alone (31). This is consistent with the known disadvantages of the heart rate and accelerometer monitors, where heart rate monitors tend to overestimate PAEE and accelerometers tend to underestimate PAEE as compared with gold standard methods. In a healthy Danish sample (mean age, 58 years), the median ActiHeart-assessed PAEE level was found to be 40 kJ/kg/day (32). In the U.K., the PAEE levels were somewhat lower (35 kJ/kg/day) in a slightly older population (32). Thus, when taking the population-specific characteristics into account (age and anthropometric measures), our results are comparable with those of other studies using combined heart rate and accelerometry to estimate PAEE level.
In accordance with other findings in aging populations (33), the most prevalent leisure time PAs included walking, gardening, and cycling. Time spent in different PA intensity categories was consistent with reports from other western populations (3,4). We saw a tendency toward more time spent in lower PA intensities, possibly due to the slightly older population and the fact that the majority of the population consisted of individuals with a higher diabetes risk score (performed at screening), which included physical inactivity. The majority of the population was reported to have low PA levels in leisure time, consisting of mainly household activities and some physical movement (≥4 h per week). This reveals a population where PAEE is mainly composed of “daily activities” rather than by regular exercise sessions.
PAEE and glucose homeostasis
Heart rate– and accelerometer-measured PAEE in daily life was positively associated with peripheral insulin sensitivity (ISI0,120) and negatively associated with 2-h insulin response after a glucose load. Our findings are consistent with those of other studies using accelerometer- (4) and questionnaire-based (34) estimates of PAEE. Others have found higher PA levels (as measured by questionnaire as well as by heart rate monitors and accelerometry) to be associated with lower HOMA-IR (35), fasting serum insulin (1), and 2-h plasma glucose levels (32) even when adjusting for body composition measures. In our study, when additionally adjusting analyses for waist circumference, the associations with fasting and 30-min plasma insulin levels, HOMA-IR, and 2-h plasma glucose levels were attenuated and lost statistical significance, probably due to the small effect size in this elderly population performing mainly sedentary activities and light-intensity PA. Recent findings suggest that moderate to intensive exercise is not sufficient to improve insulin sensitivity if performed less than two times per week, but is associated with an increased skeletal muscular flux through ATP synthase, possibly due to genetic predisposition (36). Our findings are based on models including the total PA volume (PAEE, including intensity, duration, and frequency), and as such, the positive association between insulin sensitivity and PAEE could be due to a combination of higher PA intensity, duration, or frequency, in addition to genetic predisposition to respond to exercise. The reported 10 kJ/kg/day increment in PAEE level (which would approximate 1 h of walking with a pace of 3.2 km/h for a person weighing 73 kg) would result in a 1% increment in peripheral insulin sensitivity, a small, but clinically relevant, increment if seen in conjunction with other metabolic improvements and nonmetabolic benefits of being physically active. We did not find any association of PAEE with indices of the β-cell function (DI and insulinogenic index) or with measures of long-term glycemia (HbA1c and AGEskin), indicating that peripheral glucose uptake is the most important with regards to explaining the association of PAEE with glucose homeostasis in people performing mainly light-intensity PA. A recent study found that people with high self-reported PA levels have higher DI, indicating an improved ability of the β-cells to compensate for insulin resistance (37), possibly due to stimulation of β-cell proliferation and prevention of apoptosis, resulting in an expanded β-cell mass. However, the conflicting results with our findings might be due to differences in population-specific characteristics and to the fact that the aforementioned population had significantly higher PA levels (although self-reported). The failure to show any association of PAEE with HbA1c might be due to the fact that HbA1c is a more stable measure of glucose homeostasis in contrast to glucose or insulin, since it is a measure of long-term glycemia. Likewise, AGEskin is a measure of the even longer-term load of protein glycation. This could indicate that PA must be performed on a regular basis, in a longer period, or with a higher intensity to be able to show any associations with HbA1c or AGEskin. This is in line with other studies that show that high-volume but not low-volume exercise is associated with a decrease in HbA1c (11). We are not aware of any studies investigating the association of PA with AGEsskin. However, AGEs have been suggested to be related to hyperglycemia-induced micro- and macrovascular disease in diabetes (14), and as such, might be associated with higher PA intensity and higher cardiorespiratory fitness.
Glucose uptake and insulin response during the OGTT
Our models, although cross-sectional, indicate that an increment in PAEE level would result in a more rapid decline in glucose concentrations from 30 to 120 min after the OGTT (Fig. 1A) rather than in differences in fasting or 30-min glucose levels. This finding is in line with laboratory studies showing that people with high PA have better glucose uptake than people with a lower PA level (38), due to the increased glucose transport activity in skeletal muscles as a response to muscle contraction. Furthermore, the effects of PA on peripheral insulin sensitivity have, in laboratory studies and exercise interventions, been suggested to be mainly due to an increased oxidative capacity and mitochondrial function in muscles (39). As such, despite starting at almost the same fasting plasma glucose levels and ending with slightly different 2-h plasma glucose levels by different PAEE levels, our results suggest that people with a higher PAEE level spend less time at the highest level of concentrations of circulating glucose. The initial insulin response to glucose load was almost the same (equally steep slope) for all PAEE levels (Fig. 1B). However, 2-h insulin seemed to be lower for higher PAEE levels and with a slightly steeper slope from 30 to 120 min, probably due to a higher insulin action in people with a high PAEE level since they are more likely to have higher peripheral insulin sensitivity (Table 3).
We found that only ISI0,120 and 2-h insulin levels were associated with PAEE, after examining several detailed measures of glucose homeostasis, including derived indices. Although the associations found were modest in magnitude, it is encouraging that these differences are observable even within a population with only modest PA levels. This indicates that even without high-intensity exercise, aiming to increase the overall level of PAEE by small but reasonable amounts in an entire population at risk for developing type 2 diabetes may be a realistic and worthwhile goal to aim for from a public health perspective.
Strengths and limitations
A major strength of this study is the large number of participants with objectively measured PA during daily living. Although the population approach hindered the use of gold standard methods of glucose regulation (e.g., the use of a euglycemic clamp test to determine insulin sensitivity), we did obtain the most precise measures of glucose homeostasis achievable in an epidemiological setting. However, measures derived from the OGTT can be confounded by physiological factors separate from insulin itself. For example, prolonged gut glucose absorption, during an OGTT, results in higher plasma glucose values at the end of the OGTT. Thus, although the derived indices from the OGTT are modeled using validated formulas taking into account several physiological factors, they should be interpreted carefully as they are estimated, rather than actually measured, values. We examined the association of objectively measured PAEE with glucose homeostasis markers in a population with different risk profiles for developing type 2 diabetes. Since participants were invited and included in the study according to their diabetes risk, their PA level could potentially be affected by their risk status, as participants with different risk status could have been approached differently by their general practitioners regarding prevention strategies for type 2 diabetes (e.g., advice on enhancing PA level). To account for this, we adjusted for baseline diabetes risk group as a surrogate measure of the participant’s clinical history. Even though this could potentially have resulted in over-adjustments of the analysis, our results are more likely to be generalizable to other populations when including the adjustments. Although based on objective measurements, the obtained PAEE levels are the results of estimations by modeling heart rate and accelerometry data. Hence, PAEE is not measured directly. Lastly, because of the cross-sectional design of the current study, we cannot be sure about the directions of causality of the associations found.
In spite of the above-listed limitations, our study adds to previous investigations of the relationship of PA with glucose homeostasis: detailed measures of glucose homeostasis and long-term glycemia and robust measures of objectively measured PAEE in an epidemiological setting. Even in an elderly population with relatively low levels of PA, performed mainly during daily activities, we found a positive association of heart rate and accelerometer-assessed PAEE with insulin sensitivity and a negative association with insulin concentration 2 h after a glucose load. Although our findings are cross-sectional, they indicate that even without high-intensity exercise, increasing the overall level of PAEE slightly in an entire population at risk for developing type 2 diabetes may be a realistic and worthwhile goal, when aiming to achieve beneficial effects in terms of glucose metabolism. When looking into the activities of the elderly population, suggestions to increase the overall PAEE level could include brisk walking, cycling, and in general, increased activity levels during home-based activities.
Acknowledgments
The ADDITION-Denmark study was supported by the National Health Services in the counties of Copenhagen, Aarhus, Ringkøbing, Ribe, and Southern Jutland in Denmark; the Danish Council for Strategic Research; the Danish Research Foundation for General Practice; Novo Nordisk Foundation; the Danish Centre for Evaluation and Health Technology Assessment; the Diabetes Fund of the National Board of Health; the Danish Medical Research Council; and the Aarhus University Research Foundation. Additionally, the ADDITION-PRO study was funded by an unrestricted grant from the European Foundation for the Study of Diabetes/Pfizer for Research into Cardiovascular Disease Risk Reduction in Patients with Diabetes (74550801), the Danish Council for Strategic Research, and internal research and equipment funds from Steno Diabetes Center. A.-L.S.H. additionally received scholarship funding from the Capital Region of Denmark. A.-L.S.H., B.C., N.B.J., M.E.J., and D.R.W. are employed by Steno Diabetes Center A/S, a research hospital working in the Danish National Health Service and owned by Novo Nordisk A/S. Steno Diabetes Center receives part of its core funding from unrestricted grants from the Novo Foundation and Novo Nordisk A/S. A.-L.S.H., B.C., N.B.J., M.E.J., T.L., and D.R.W. own shares in Novo Nordisk A/S. No other potential conflicts of interest relevant to this article were reported.
The ADDITION-Denmark Steering Committee includes M.E.J., D.R.W., Annelli Sandbæk (Department of Public Health, Aarhus University), T.L., and Knut Borch-Johnsen (Institute of Public Health, University of Southern Denmark, Odense, Denmark).
A.-L.S.H. collected and researched data, contributed to discussion, and wrote the manuscript. B.C. researched the data, contributed to discussion, and reviewed and edited the manuscript. J.W.H., B.G., J.S.C., M.E.J., and M.A. contributed to discussion and reviewed and edited the manuscript. N.B.J., T.L., and D.R.W. designed the study, contributed to discussion, and reviewed and edited the manuscript. S.B. contributed to PA data analysis and discussion and reviewed and edited the manuscript. All authors approved the final version of the manuscript. A.-L.S.H is the guarantor of this work and, as such, had full access to all the data in the study and takes responsibility for the integrity of the data and the accuracy of the data analysis.
The authors acknowledge the ADDITION-PRO study centers and are most grateful to the support staff and the participants for their contribution to the study. The authors also acknowledge Kate Westgate (Medical Research Council Epidemiology Unit, Cambridge, U.K.) for guidance in processing the PA data from the ActiHeart monitor.
Footnotes
This article contains Supplementary Data online at http://care.diabetesjournals.org/lookup/suppl/doi:10.2337/dc12-2671/-/DC1.
A complete list of the members of the ADDITION-Denmark Steering Committee can be found in the acknowledgments.
References
- 1.Assah FK, Brage S, Ekelund U, Wareham NJ. The association of intensity and overall level of physical activity energy expenditure with a marker of insulin resistance. Diabetologia 2008;51:1399–1407 [DOI] [PMC free article] [PubMed] [Google Scholar]
- 2.Dunstan DW, Salmon J, Owen N, et al. AusDiab Steering Committee Physical activity and television viewing in relation to risk of undiagnosed abnormal glucose metabolism in adults. Diabetes Care 2004;27:2603–2609 [DOI] [PubMed] [Google Scholar]
- 3.Healy GN, Dunstan DW, Salmon J, et al. Objectively measured light-intensity physical activity is independently associated with 2-h plasma glucose. Diabetes Care 2007;30:1384–1389 [DOI] [PubMed] [Google Scholar]
- 4.Balkau B, Mhamdi L, Oppert JM, et al. EGIR-RISC Study Group Physical activity and insulin sensitivity: the RISC study. Diabetes 2008;57:2613–2618 [DOI] [PMC free article] [PubMed] [Google Scholar]
- 5.Engberg S, Glümer C, Witte DR, Jørgensen T, Borch-Johnsen K. Differential relationship between physical activity and progression to diabetes by glucose tolerance status: the Inter99 Study. Diabetologia 2010;53:70–78 [DOI] [PubMed] [Google Scholar]
- 6.Corder K, Brage S, Ekelund U. Accelerometers and pedometers: methodology and clinical application. Curr Opin Clin Nutr Metab Care 2007;10:597–603 [DOI] [PubMed] [Google Scholar]
- 7.Corder K, Brage S, Wareham NJ, Ekelund U. Comparison of PAEE from combined and separate heart rate and movement models in children. Med Sci Sports Exerc 2005;37:1761–1767 [DOI] [PubMed] [Google Scholar]
- 8.Villars C, Bergouignan A, Dugas J, et al. Validity of combining heart rate and uniaxial acceleration to measure free-living physical activity energy expenditure in young men. J Appl Physiol 2012;113:1763–1771 [DOI] [PubMed] [Google Scholar]
- 9.Ekelund U, Brage S, Griffin SJ, Wareham NJ, ProActive UK Research Group Objectively measured moderate- and vigorous-intensity physical activity but not sedentary time predicts insulin resistance in high-risk individuals. Diabetes Care 2009;32:1081–1086 [DOI] [PMC free article] [PubMed] [Google Scholar]
- 10.Faerch K, Borch-Johnsen K, Holst JJ, Vaag A. Pathophysiology and aetiology of impaired fasting glycaemia and impaired glucose tolerance: does it matter for prevention and treatment of type 2 diabetes? Diabetologia 2009;52:1714–1723 [DOI] [PubMed] [Google Scholar]
- 11.Umpierre D, Ribeiro PA, Kramer CK, et al. Physical activity advice only or structured exercise training and association with HbA1c levels in type 2 diabetes: a systematic review and meta-analysis. JAMA 2011;305:1790–1799 [DOI] [PubMed] [Google Scholar]
- 12.Tessier FJ. The Maillard reaction in the human body. The main discoveries and factors that affect glycation. Pathol Biol (Paris) 2010;58:214–219 [DOI] [PubMed] [Google Scholar]
- 13.Lutgers HL, Gerrits EG, Graaff R, et al. Skin autofluorescence provides additional information to the UK Prospective Diabetes Study (UKPDS) risk score for the estimation of cardiovascular prognosis in type 2 diabetes mellitus. Diabetologia 2009;52:789–797 [DOI] [PubMed] [Google Scholar]
- 14.Meerwaldt R, Lutgers HL, Links TP, et al. Skin autofluorescence is a strong predictor of cardiac mortality in diabetes. Diabetes Care 2007;30:107–112 [DOI] [PubMed] [Google Scholar]
- 15.Christensen JO, Sandbaek A, Lauritzen T, Borch-Johnsen K. Population-based stepwise screening for unrecognised type 2 diabetes is ineffective in general practice despite reliable algorithms. Diabetologia 2004;47:1566–1573 [DOI] [PubMed] [Google Scholar]
- 16.Johansen NB, Hansen AL, Jensen TM, et al. Protocol for ADDITION-PRO: a longitudinal cohort study of the cardiovascular experience of individuals at high risk for diabetes recruited from Danish primary care. BMC Public Health 2012;12:1078. [DOI] [PMC free article] [PubMed] [Google Scholar]
- 17.Brage S, Brage N, Franks PW, et al. Branched equation modeling of simultaneous accelerometry and heart rate monitoring improves estimate of directly measured physical activity energy expenditure. J Appl Physiol 2004;96:343–351 [DOI] [PubMed] [Google Scholar]
- 18.Besson H, Brage S, Jakes RW, Ekelund U, Wareham NJ. Estimating physical activity energy expenditure, sedentary time, and physical activity intensity by self-report in adults. Am J Clin Nutr 2010;91:106–114 [DOI] [PubMed] [Google Scholar]
- 19.Saltin B, Grimby G. Physiological analysis of middle-aged and old former athletes. Comparison with still active athletes of the same ages. Circulation 1968;38:1104–1115 [DOI] [PubMed] [Google Scholar]
- 20.Wallace TM, Levy JC, Matthews DR. Use and abuse of HOMA modeling. Diabetes Care 2004;27:1487–1495 [DOI] [PubMed] [Google Scholar]
- 21.Gutt M, Davis CL, Spitzer SB, et al. Validation of the insulin sensitivity index (ISI(0,120)): comparison with other measures. Diabetes Res Clin Pract 2000;47:177–184 [DOI] [PubMed] [Google Scholar]
- 22.Bergman RN, Phillips LS, Cobelli C. Physiologic evaluation of factors controlling glucose tolerance in man: measurement of insulin sensitivity and beta-cell glucose sensitivity from the response to intravenous glucose. J Clin Invest 1981;68:1456–1467 [DOI] [PMC free article] [PubMed] [Google Scholar]
- 23.Stumvoll M, Mitrakou A, Pimenta W, et al. Use of the oral glucose tolerance test to assess insulin release and insulin sensitivity. Diabetes Care 2000;23:295–301 [DOI] [PubMed] [Google Scholar]
- 24.Hanson RL, Pratley RE, Bogardus C, et al. Evaluation of simple indices of insulin sensitivity and insulin secretion for use in epidemiologic studies. Am J Epidemiol 2000;151:190–198 [DOI] [PubMed] [Google Scholar]
- 25.Stegle O, Fallert SV, MacKay DJ, Brage S. Gaussian process robust regression for noisy heart rate data. IEEE Trans Biomed Eng 2008;55:2143–2151 [DOI] [PubMed] [Google Scholar]
- 26.Brage S, Ekelund U, Brage N, et al. Hierarchy of individual calibration levels for heart rate and accelerometry to measure physical activity. J Appl Physiol 2007;103:682–692 [DOI] [PubMed] [Google Scholar]
- 27.Henry CJ. Basal metabolic rate studies in humans: measurement and development of new equations. Public Health Nutr 2005;8(7A):1133–1152 [DOI] [PubMed] [Google Scholar]
- 28.van Buuren S. Multiple imputation of discrete and continuous data by fully conditional specification. Stat Methods Med Res 2007;16:219–242 [DOI] [PubMed] [Google Scholar]
- 29.Taylor AE, Ebrahim S, Ben-Shlomo Y, et al. Comparison of the associations of body mass index and measures of central adiposity and fat mass with coronary heart disease, diabetes, and all-cause mortality: a study using data from 4 UK cohorts. Am J Clin Nutr 2010;91:547–556 [DOI] [PubMed] [Google Scholar]
- 30.Vaughan L, Zurlo F, Ravussin E. Aging and energy expenditure. Am J Clin Nutr 1991;53:821–825 [DOI] [PubMed] [Google Scholar]
- 31.Matthiessen J, Biltoft-Jensen A, Rasmussen LB, Hels O, Fagt S, Groth MV. Comparison of the Danish Physical Activity Questionnaire with a validated position and motion instrument. Eur J Epidemiol 2008;23:311–322 [DOI] [PubMed] [Google Scholar]
- 32.InterAct Consortium Validity of a short questionnaire to assess physical activity in 10 European countries. Eur J Epidemiol 2012;27:15–25 [DOI] [PMC free article] [PubMed] [Google Scholar]
- 33.Martin HJ, Syddall HE, Dennison EM, Cox VA, Cooper C, Sayer AA. Assessing Physical Activity in Older People: Findings from the Hertfordshire Cohort Study. The Open Geriatric Medicine Journal 2008;1:43–49
- 34.Mayer-Davis EJ, D’Agostino R, Jr, Karter AJ, et al. Intensity and amount of physical activity in relation to insulin sensitivity: the Insulin Resistance Atherosclerosis Study. JAMA 1998;279:669–674 [DOI] [PubMed] [Google Scholar]
- 35.Larsson CA, Krøll L, Bennet L, Gullberg B, Råstam L, Lindblad U. Leisure time and occupational physical activity in relation to obesity and insulin resistance: a population-based study from the Skaraborg Project in Sweden. Metabolism 2012;61:590–598 [DOI] [PubMed] [Google Scholar]
- 36.Kacerovsky-Bielesz G, Kacerovsky M, Chmelik M, et al. A single nucleotide polymorphism associates with the response of muscle ATP synthesis to long-term exercise training in relatives of type 2 diabetic humans. Diabetes Care 2012;35:350–357 [DOI] [PMC free article] [PubMed] [Google Scholar]
- 37.Chen Z, Black MH, Watanabe RM, et al. Self-reported physical activity is associated with β-cell function in Mexican American adults. Diabetes Care 2013;36:638–644 [DOI] [PMC free article] [PubMed] [Google Scholar]
- 38.Houmard JA, Tanner CJ, Slentz CA, Duscha BD, McCartney JS, Kraus WE. Effect of the volume and intensity of exercise training on insulin sensitivity. J Appl Physiol 2004;96:101–106 [DOI] [PubMed] [Google Scholar]
- 39.Menshikova EV, Ritov VB, Fairfull L, Ferrell RE, Kelley DE, Goodpaster BH. Effects of exercise on mitochondrial content and function in aging human skeletal muscle. J Gerontol A Biol Sci Med Sci 2006;61:534–540 [DOI] [PMC free article] [PubMed] [Google Scholar]