

Abstract
OBJECTIVE
Several pathomechanisms are implicated in the pathogenesis of metabolic syndrome (MetS), most of which have not been investigated in African Americans (AAs). We examined the contribution of a selected panel of biomarkers to the development of MetS in Jackson Heart Study (JHS) participants in this investigation.
RESEARCH DESIGN AND METHODS
We evaluated 3,019 JHS participants (mean age, 54 years; 64% women) with measurements for seven biomarkers representing inflammation (high-sensitivity C-reactive protein [CRP]), adiposity (leptin), natriuretic pathway (B-natriuretic peptide [BNP]), adrenal pathway (cortisol and aldosterone), and endothelial function (endothelin and homocysteine). We related the biomarker panel to the development of MetS on follow-up and to longitudinal changes in MetS components.
RESULTS
There were 278 (22.9%) of 1,215 participants without MetS at baseline who had development of new-onset MetS at follow-up. The incidence of MetS was significantly associated with serum aldosterone (P = 0.004), CRP (P = 0.03), and BNP (P for trend = 0.005). The multivariable-adjusted odds ratios (95% CI) per SD increment of log biomarker were as follows: 1.25 (1.07–1.45) for aldosterone, 1.20 (1.02–1.43) for CRP, and 1.54 (1.07–2.23) and 1.91 (1.31–2.80) for low and high BNP quartiles, respectively. Aldosterone was positively associated with change in all MetS risk components, except low HDL cholesterol and waist circumference. CRP concentration was significantly and directly associated with change in systolic blood pressure (SBP) and waist circumference but inversely associated with HDL cholesterol. For BNP, we observed a U-shape relation with SBP and triglycerides.
CONCLUSIONS
Our analysis confirms that, in AAs, higher circulating aldosterone and CRP concentrations predict incident MetS. The nonlinear U-shape relation of BNP with MetS and its components has not been reported before and thus warrants replication.
The main components of metabolic syndrome (MetS) include dyslipidemia (low HDL cholesterol [HDL-C] and high triglycerides levels), impaired glucose homeostasis (high fasting plasma glucose), high blood pressure (BP), and abdominal obesity. Findings from several cross-sectional and longitudinal studies have shown that MetS is associated with higher concentrations of circulating inflammatory markers (1,2) and neurohormonal activation (3,4). The elevation of these biomarkers often precedes the development of risk factors such as type 2 diabetes (5), insulin resistance (IR) (6,7), and hypertension (7,8). Few studies, however, have examined the conjoint and relative contributions of multiple biomarkers to the development of MetS, and none have been conducted in African Americans (AAs) to our knowledge. Recently, Ingelsson et al. (9) evaluated a comprehensive panel of eight biomarkers representing inflammation, hemostasis, neurohormonal activation, and endothelial dysfunction for their association with the incidence of MetS and its risk factors in Framingham. Ingelsson et al. found that higher circulating plasminogen activator inhibitor-I and aldosterone levels were each associated with the development of MetS and with longitudinal changes of MetS components in whites. Because ethnic differences exist in levels of visceral adiposity, IR, and circulating levels of novel biomarkers (such as C-reactive protein [CRP], adiponectin, and plasma homocysteine), we investigated the individual and conjoint association of selected circulating biomarkers with the incidence of MetS and with longitudinal tracking of MetS components among AAs in the Jackson Heart Study (JHS). We evaluated a panel of seven biomarkers representing inflammation (CRP), adiposity (leptin), adrenal pathway (cortisol and aldosterone), natriuretic pathway (B-type natriuretic peptide [BNP]), and endothelial function (endothelin, ET-1, and homocysteine). Although IR is not a key component of MetS, we used it as a covariate in secondary analysis because it frequently accompanies MetS (10,11) and to avoid confounding of any potential association by IR.
RESEARCH DESIGN AND METHODS
The sampling, recruitment, and cohort description of the completely AA JHS has been reported previously (12). At baseline, JHS consisted of 5,301 participants recruited from the tri-counties (i.e., Hinds, Madison, and Rankin) of the Jackson, Mississippi, metropolitan area. For the current study, participants who attended visit 1 (2000–2004) and visit 2 (2005–2008) were selected.
The final sample sizes for studying biomarker–MetS components and biomarkers–incident MetS relations were 3,019 and 1,215, respectively. Figure 1 shows a flow chart of the research design. We derived our study sample from the total JHS sample at visit 1 by applying inclusion criteria based on the established relationship of the variable with MetS or the established relationship of the variable with biomarkers (e.g., coronary artery disease, diabetes mellitus, and use of sex hormone therapy [associated with elevated CRP levels]).
Figure 1.

Flow diagram summarizing the research design (population samples, sample size, and analysis results presented in tables). CVD, cardiovascular disease; HF, heart failure.
For investigating the relation of biomarkers with longitudinal changes of MetS components, we used a total of 3,019 participants (baseline study sample) retained after excluding persons with the following conditions (in hierarchical order): prevalent cardiovascular and prevalent coronary artery disease (n = 545); self-reported heart failure (n = 64); prevalent diabetes mellitus (i.e., fasting glucose ≥126 mg/dL or use of insulin or oral hypoglycemia agents, n = 225); serum creatinine >2 mg/dL (n = 37); missing covariates (n = 389); missing biomarkers and BNP >100 (n = 843); and self-reported cancer, use of anti-inflammatory therapy, and white blood cell count >12 × 109 cells/L (n = 179). For analyses evaluating new-onset MetS, we used a sample free of MetS at baseline, excluding individuals with MetS at baseline (n = 1,082 or 36%) and those missing relevant follow-up covariates (n = 722).
Biomarker measurements at baseline examination: visit 1
Biomarker measurements during the JHS were performed at the baseline JHS examination. Serum aldosterone was measured by radioimmunoassay (Siemens), whereas plasma BNP and serum cortisol were measured by chemiluminescent immunoassay performed with the Siemens Advia Centaur (Siemens). Serum CRP was measured by the latex particle immunoturbidimetric assay (from ITA and from Roche Diagnostics, Indianapolis, IN), whereas serum leptin was measured by radioimmunoassay using the double-antibody/polyethylene glycol technique of the Human Leptin RIA kit from Millipore (Billerica, MA). ELISA methods were used to measure plasma ET-1 (Minneapolis, MN), whereas plasma homocysteine was measured by the fluorescence polarization immunoassay on the IMX (N-0581; Abbott Laboratories, Oslo, Norway). The intra-assay coefficients of variation for the biomarkers were as follows: 8.7 and 6.2% for low and high aldosterone concentrations; 4.2, 3.1, and 3.4% for the three BNP concentrations (low, mid, and high values); and 9.1 and 7.7% for low and high cortisol levels, respectively. Coefficients of variation for CRP and leptin were 4.5 and 10%, respectively. For ET-1, coefficients of variation ranged between 9.3 and 19.1%. For the three levels of homocysteine, coefficients of variation were 4.6, 3.2, and 2.1%, respectively.
Definition of MetS and incidence MetS
MetS was defined in this study according to National Cholesterol Education Program Adult Treatment Panel III as the presence of at least three of the following five conditions: elevated BP (≥130 mmHg systolic BP [SBP], ≥85 mmHg diastolic BP, or treatment with antihypertensive medications); increased waist circumference (≥102 cm in men or ≥88 cm in women); hyperglycemia (fasting glucose ≥100 mg/dL) or treatment with insulin; hypertriglyceridemia (≥150 mg/dL) or treatment with lipid-lowering treatment; and low HDL-C (<40 mg/dL in men and <50 mg/dL in women) (13).
Determination of incident MetS for this study was based on clinical parameters obtained during visit 2. The follow-up period was on average >4 years from the baseline examination (median, 4.7 ± 0.8 years; range, 3–11 years) among 1,215 individuals (79.1% [n = 961] women) who were free from MetS at baseline and had complete covariate and biomarker data. Incident MetS was considered present if at visit 2 at least three (any three) of the five components of MetS listed were present.
Statistical analyses
We constructed multivariable logistic regression models to describe the relations of the biomarker panel to the incidence of MetS, controlling for the selected clinical and biochemical correlates. Because of the right-skewed distribution of most biomarkers of interest, we transformed biomarker values using natural logarithm and then standardized (mean = 0, variance = 1) them within each sex to facilitate easier comparisons and to account for sex differences in their distributions. For the left-censored serum aldosterone and plasma BNP levels, we used β-substitution (14) to compute values at or below the limit of detection and obtained sex-specific BNP quartiles, because approximately one-quarter of BNP values were at or below the limit of detection, respectively. Pairwise Pearson correlation coefficients were used to assess the interrelations among the biomarkers.
Multimarker panel and incidence of MetS
We tested the likelihood that at least one of the biomarkers is related to the incidence of MetS. The following clinical correlates were included in the models as covariates: age, sex, SBP and diastolic BP, waist circumference, fasting glucose, fasting HDL-C, log triglycerides, and sex hormone use (all assessed at the baseline examination). We compared the goodness of fit of a reduced model (i.e., clinical correlates only) with that of a full model (i.e., seven biomarkers in addition to the clinical covariates). We estimated global probability corresponding to the chance that at least one biomarker is related to the incidence of MetS. Analysis was extended to individual biomarkers only if the global test yielded P < 0.05. To identify a subset of relevant informative biomarkers in the panel, we used stepwise logistic regression with backward elimination and a statistical significance of ≤0.05 for an individual marker to be retained in the model. The clinical correlates were forced into the model. We tested for potential confounding effect of IR by adjusting for homeostasis model assessment of IR, both as a continuous variable and categorical covariate in the multivariable model. We also evaluated the influence of conjoint marker effects on the incidence of MetS by including pairwise interactions between informative markers expressed as continuous variables.
We performed additional regression analysis using penalized splines (using the Generalized Additive Models package available and implemented in the R statistical software) to further describe the structure of the relationship between selected informative markers and incidence of MetS. This approach allowed us to test for departure from linearity of any potential biomarker–incident MetS relations.
Selected biomarkers and longitudinal changes in metabolic risk factors
The association between selected biomarkers and small changes in MetS components (Δ) represent the ability of the biomarker to predict small changes in MetS components, which may shed light on the association between biomarkers and new-onset MetS. In this analysis, we explored the relation between longitudinal change and selected biomarkers. Participants using BP-lowering or lipid-lowering treatments or who were diabetic at the baseline examination were excluded from the analyses for changes in BP, blood glucose, and triglycerides. Changes in risk factors were analyzed using sex-pooled multivariable linear regression models, whereas changes in waist circumference were standardized within sex. We used censored normal regression for change in SBP and diastolic BP, plasma glucose, and logarithm of triglycerides to account for high BP, diabetes, or dyslipidemia treatments at the second examination cycle. In all models, we adjusted for age, sex, baseline BMI (except for the model analyzing waist circumference as the dependent variable), and baseline level of the individual risk factor. To facilitate interpretation of results, we conducted a minor analysis investigating the predictive ability of the selected biomarkers in the smaller sample of participants who did not develop MetS on follow-up (N = 937). All analyses were performed using SAS 9.2 (SAS Institute, Cary, NC) and R programming language.
Secondary analyses.
We estimated sex-specific cutoffs for the informative biomarkers that maximized the sums of sensitivity and specificity for predicting new-onset MetS by examining separate receiver-operating characteristics curves. Using the cutoff points, we obtained sensitivities, specificities, positive predictive values, and negative predictive values for incident MetS. We also compared the difference between the areas under the operating curve c statistic for the full and reduced models.
RESULTS
Baseline clinical and biomarker characteristics
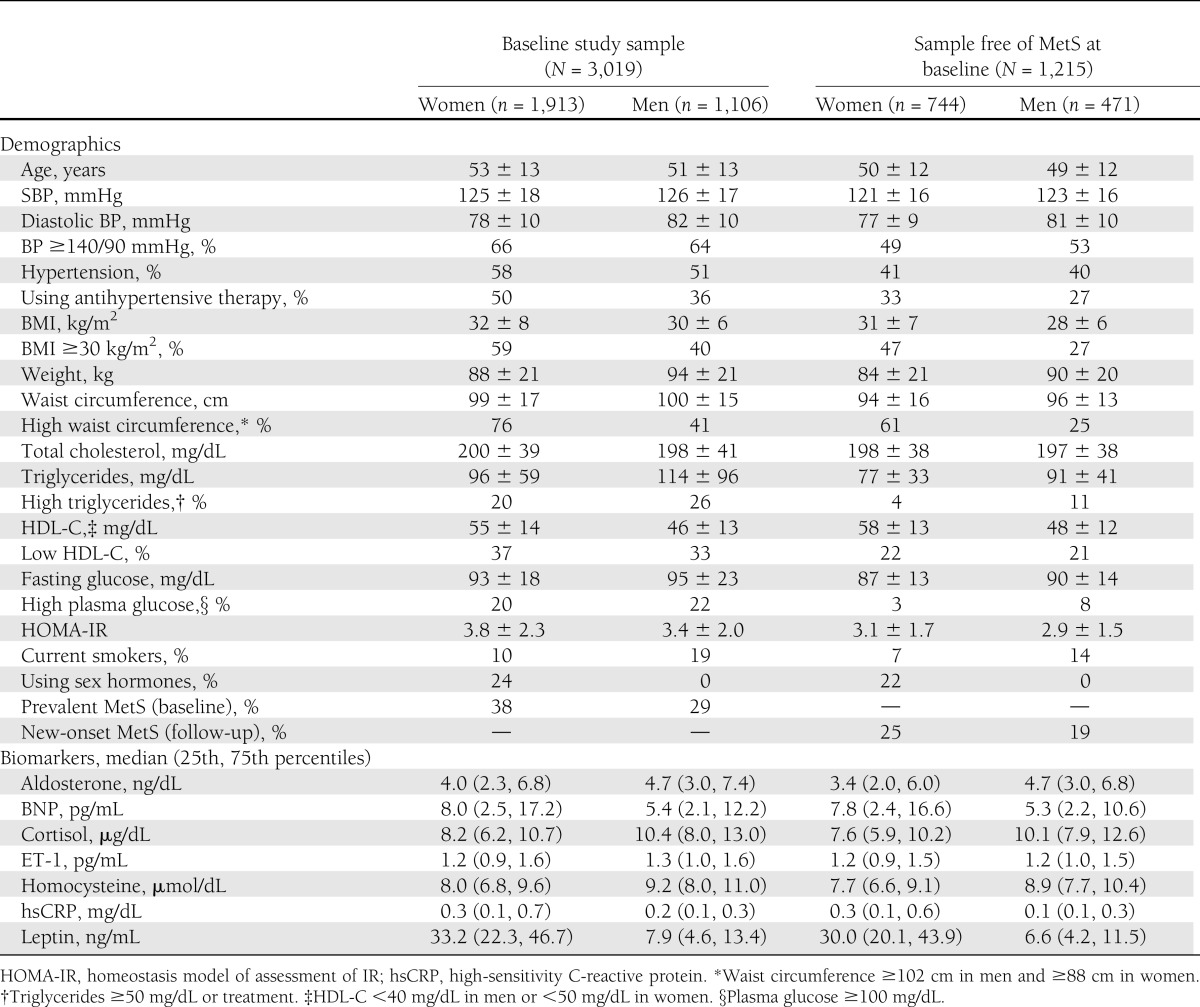
The baseline clinical and biomarker characteristics of the JHS population are shown in Table 1. For the sample free of MetS at baseline, we excluded individuals with MetS and those without relevant follow-up covariates (Fig. 1). A total of 1,082 (36% of the baseline study sample) had MetS, which is a reflection of the high prevalence of obesity and hypertension among JHS participants (Table 1). Most biomarkers exhibited low to moderate significant (P ≤ 0.005) Pearson correlations, with coefficients ranging from −0.18 to 0.36 (Supplementary Table 2). Overall, distributions of biomarkers were similar in the whole sample and in those without MetS, especially in men.
Table 1.
Baseline characteristics of study samples
Relation of multimarker panel and incidence of MetS
At the end of the second JHS examination cycle, 278 participants (186 women) had developed new-onset MetS. The biomarker panel was significantly associated with incidence of MetS (global test, P = 3.31 × 10⁻⁴; Supplementary Table 1). We identified three biomarkers that were significantly associated with incidence of MetS: aldosterone (P = 0.004), CRP (P = 0.03), and BNP (P for trend across quartiles = 0.04).
From variable selection analysis results (Supplementary Table 1), it was apparent that although aldosterone and CRP levels were linearly related to incidence of MetS, BNP quartiles were not. The negative Pearson correlation of plasma BNP levels with both aldosterone and CRP corroborates the nonlinear relationship of BNP and MetS (Supplementary Table 2). Test of linearity using generalized additive models showed a significant (P = 0.005) nonlinear relation with continuous BNP concentration (>3 estimated degrees for the spline) (Supplementary Fig. 1) and a significant (P = 0.003, estimated degrees >1.0) curvilinear relation with BNP quartiles (Fig. 2). Thus, in subsequent analyses, we modeled the BNP–MetS relation as two slopes that were different in direction by collapsing BNP quartiles into three categories; i.e., the second and third quartiles were collapsed into a single group that served as the referent group, with which we compared the first and the fourth quartiles. As summarized in Table 2, both lower (quartile 1 vs. quartile 2 and quartile 3) and higher (quartile 4 vs. quartile 2 and quartile 3) BNP concentrations were associated with incidence of MetS (P = 0.02 and 0.0008, respectively). Tests of all pairwise interactions among informative markers were not statistically significant and thus are not shown. Inclusion of homeostasis model assessment of IR as a covariate in the analysis was not significant and thus was excluded in further analyses.
Figure 2.

Penalized spline smoother of the relationship between new-onset MetS and plasma BNP levels (BNP quartiles).
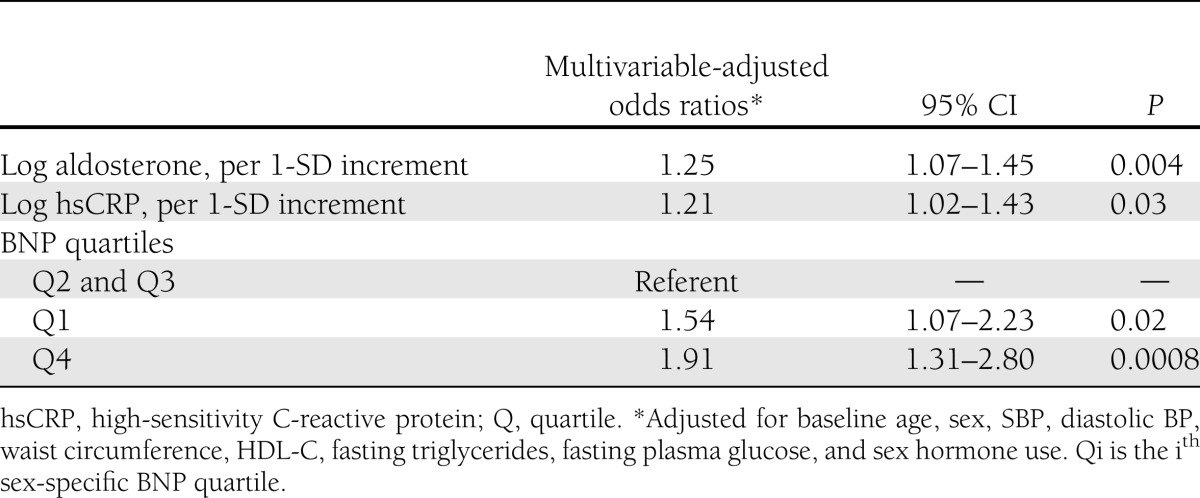
Table 2.
Relations of selected biomarkers to the incidence of MetS on follow-up
Relation of aldosterone, CRP, and BNP concentrations to longitudinal changes in individual components of MetS
The proportion of individuals with elevation of one or more components of the MetS increased during follow-up: elevated glucose levels (11.5%); elevated BP (8.5%); decreased HDL-C (7.5%); elevated triglycerides (5.2%); and increased waist circumference (2.9%).
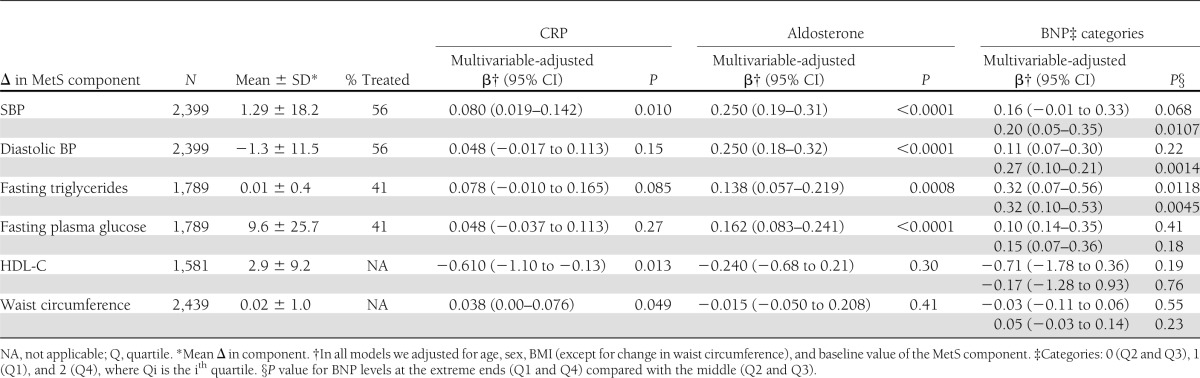
In multivariable-adjusted analysis, aldosterone was positively and significantly (P < 0.0001) associated with longitudinal changes of all MetS risk components except HDL-C and waist circumference (Table 3). We found a significant direct association of CRP with longitudinal SBP (P = 0.0133) and sex-standardized waist circumference (P = 0.049), and a significant inverse association with longitudinal changes of HDL-C (P = 0.015) (Table 3). BNP levels at the extreme ends (quartiles 1 and 4) were significantly associated with SBP (P values at the low and high extremes = 0.069 and 0.0109), diastolic BP (P values at the low and high extremes = 0.22 and 0.0014), and triglycerides (P values at the low and high extremes = 0.0118 and 0.0045), but not with HDL-C, plasma glucose, and waist circumference (Table 3).
Table 3.
Relations of select biomarkers to longitudinal changes in MetS components
Selected biomarkers and risk of incident MetS
Every 1-SD increase in log aldosterone and log CRP was associated with 25 and 21% increase in the risk of incident MetS, respectively. A 1-SD increase in log aldosterone corresponded to 2.1 ng/dL and 1.2 ng/dL above the median for women and men, respectively. The corresponding values for CRP were 3.5 μmol/dL and 3.3 μmol/dL. Low and high BNP levels increased the odds of development of MetS by 54 and 91%, respectively, compared with the referent group (Table 2). There was a statistically significant 54–91% increased risk of MetS at the two extremes of BNP distribution (Table 2). This result is consistent with the curvilinear relationship between BNP and MetS (Fig. 2).
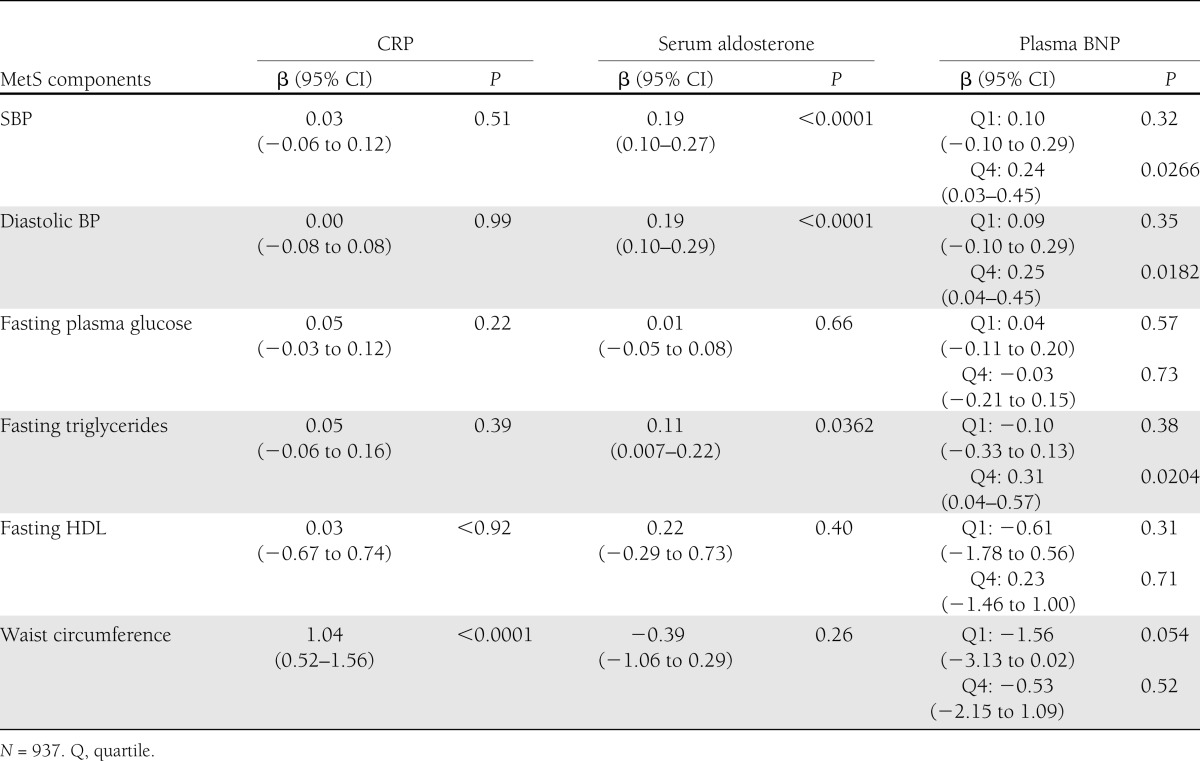
For participants without development of MetS (N = 937) on follow-up, we summarized the results of the multivariable-adjusted association between ΔMetS and the three identified biomarkers in Table 4. CRP was significantly associated with change in waist circumference (P < 0.0001) only. Serum aldosterone was significantly associated with changes in SBP and diastolic BP (P < 0.0001) and fasting triglycerides (P < 0.0362). High plasma BNP levels were significantly associated with changes in SBP (P = 0.0266) and diastolic BP (P = 0.0182) and fasting triglycerides (P = 0.0204). Low plasma BNP was not significantly associated with changes in MetS components. These results demonstrate that the identified biomarkers are associated with small changes in MetS components.
Table 4.
Association of biomarkers with ΔMetS components in participants who did not develop MetS
Evaluation of performance of aldosterone, CRP, and BNP for predicting MetS
Potential clinical usefulness of these markers for predicting new onset of MetS is represented by sensitivities, specificities, positive predictive values, and negative predictive values for sex-specific cut points we derived from receiver-operating characteristics curve analyses (Supplementary Table 3). The maximum sex-specific sensitivity and specificity of the overall model were 0.45 for women and 0.47 for men and 0.84 for women and 0.83 for men. The c statistic for reduced model was 0.767, which was significantly (P ≤ 0.0001) lower than 0.789 for the full model, suggesting that the full model is more informative for predicting incidence of MetS.
Principal findings
In this community-based cohort of AAs, we identified two biomarkers in the neurohormoral pathway (BNP and aldosterone) and one in the inflammatory pathway (CRP) that were significantly related to incidence of MetS. Higher circulating aldosterone and CRP were associated with increased risk of developing MetS, whereas BNP was nonlinearly associated with incidence of MetS. The curvilinear relation found between BNP and MetS suggests that the risk of developing MetS is significantly higher with both lower and higher BNP levels. All three biomarkers were significantly associated with longitudinal changes in SBP and fasting triglycerides. Aldosterone was additionally associated with diastolic BP and fasting glucose, whereas CRP and BNP were associated with HDL-C and waist circumference, respectively.
Although the performance of these biomarkers in predicting MetS as represented by the receiver-operating characteristics was less than ideal, these results nevertheless suggest that the biomarkers and their related pathways may be involved in mediating metabolic risk in AAs.
The prevalence of MetS and components of the syndrome in those with the disorder differs between ethnic groups, suggesting possible ethnic difference in the pathomechanisms of metabolic risk. The prevalence of MetS in the non-Hispanic white population of the Framingham Offspring study was 21.4 and 26.9% in women and men, respectively (15). The prevalence of MetS in our AA cohort was almost double that observed in Framingham women (38%) and somewhat higher than that seen in Framingham men (29%).
The most prevalent components of MetS in Framingham were high BP, low HDL, and high waist circumference for women and high BP, low HDL, and high triglycerides for men, in that order, respectively. In our AA sample, the most prevalent components of MetS were high BP, high waist circumference, and low HDL for both women and men (in that order). In the JHS cohort, high BP and high waist circumference were observed in ∼60% of the women, nearly double that observed in Framingham women. The rate of high waist circumference in men in the JHS was ∼40%, exceeding that seen in Framingham men (31.0%). Lipid profiles differ by ethnicity as well. Triglycerides were higher in women and men in Framingham (26.7 and 37.3%, respectively) compared with women and men in the JHS (∼20 and 26%, respectively). Low HDL was more common in women in JHS than women in Framingham and was more common in men in Framingham compared with men in JHS. High fasting glucose was observed in >20% of women and men in the JHS with MetS; this is more than double that observed in their Framingham counterparts.
These ethnic differences in the prevalence of MetS and its components are likely multifactorial and related to differences in socioeconomic position, lifestyle and behavioral factors (such as diet and physical activity), and genetic factors.
Relation of plasma aldosterone concentrations to MetS
Aldosterone has been related to prevalent MetS (16–18) and individual components of MetS in non-Hispanic whites (19). In one study, aldosterone was related to a 21% increased risk of new-onset MetS in this group. There are limited data on the relation of aldosterone to MetS in the AA population (16,17). We observed that aldosterone was significantly related to MetS and its components in a large community-based AA cohort, adding to the current literature in this high-risk population. The role of aldosterone in pathogenesis of MetS is complex and not fully understood (6,20,21). Available evidence, however, points to the involvement of multiple mechanisms, including the following: increased renal sodium retention, endothelial dysfunction, potentiation of angiotensin II action, and reduced vascular compliance (6,19). The most plausible and widely accepted mechanism was first described by Wehling et al. (22) and confirmed by Schiffrin et al. (18), Sowers et al. (23), and Brown (24). This mechanism involves nongenomic aldosterone effects, such as regulation of intracellular cations, cell volume, redox status, metabolic signaling, and vascular endothelium-dependent relaxation (18), that occur in tissues of epithelial and endothelial origin as well as in cell lines of human mononuclear leukocytes (25).
Mechanism linking CRP and MetS
CRP is a circulating pentraxin produced predominantly in the liver as part of an acute-phase response. CRP plays a major role in the human innate immune response and also provides a stable plasma biomarker for low-grade systemic inflammation (26). AAs are known to have higher CRP levels compared with other ethnic groups (27,28); however, in our previous study, we did not observe this distinction (29).
Findings linking CRP to incident MetS and individual components of MetS (particularly obesity and high BP) support the theory that systemic inflammation plays a key role in development of risk factors for cardiovascular disease and cardiovascular events (2). Proinflammatory cytokines produced by adipose tissue may impact lipid and glucose metabolism, resulting in the development of MetS and risk factors such as diabetes and dyslipidemia (30). Cytokines such as interleukin-6 and tumor necrosis factor can impact metabolism through their influence on hepatic fatty acid synthesis (31).
Relation of BNP to MetS
Previous studies have shown a significant inverse relation between BNP levels and both prevalent MetS and individual components of MetS (particularly obesity). These findings have been reported in cross-sectional studies of populations of several ethnic backgrounds such as whites (3,32,33), AAs (8,34), and Asians (35). In one study, the inverse relation between N-terminal pro-BNP (NT-proBNP) levels and MetS was thought to be attributable to the inverse relation of NT-proBNP with plasma lipids, serum insulin, and BMI, independently of age and sex (3). On the contrary, no significant association was found between log NT-proBNP and MetS in one study conducted in a Taiwanese population, although NT-proBNP was positively and significantly associated with SBP and negatively associated with BMI, triglycerides, and insulin level (35).
The curvilinear relation between BNP and MetS found in this investigation may be a reflection of lower BNP relation to obesity and higher BNP relation to BP. The relation of higher BNP concentrations to longitudinal increases in BP may result from BNP release in response to early increases in sympathetic tone and early activation of the renin-angiotensin system that occur with the development of high BP. Early release of BNP helps to compensate for volume and salt overload through natriuresis (36,37). It also compensates for vasoconstriction through vascular relaxation and vascular remodeling (38).
BNP may affect lipid and glucose metabolism through more direct pathways. For example, there is evidence that natriuretic peptides may significantly increase both insulin levels and glucagon secretion (39). Additionally, there is evidence that they play a role in both lipolysis and release of triacylglycerols from adipose tissue (40).
Strengths and limitations
The main strength of our study includes the large sample size of AAs with data collected over 4 years regarding several important clinical covariates. This rich dataset allowed us to investigate, for the first time, the pathomechanisms involved in the development of MetS in AAs. The main limitation stems from restriction of our analyses to only individuals with available covariate and biomarker data. We developed the biomarker panel based on both practical considerations and biological plausibility. Only biomarkers with maximum data points were included, and so the findings should be considered as hypothesis generating and warrant confirmation in future studies. Also, the sample size was inadequate for investigating the many ways that development of MetS can be observed (i.e., at least three components of five = 10 ways). Further, lack of data from another ethnic group to allow for direct comparison limits the generalization of our findings to non-AA populations.
CONCLUSIONS
In our community-based sample of AAs, we observed that circulating plasma aldosterone, CRP, and BNP concentrations were significantly associated with incident MetS and longitudinal changes in select MetS components. Our investigation illustrates the likely key role these biomarkers play in the development of MetS and cardiovascular disease (a major consequence of MetS) among AAs.
Acknowledgments
This work was supported by National Institutes of Health contracts (N01-HC-95170, N01-HC-95171, and N01-HC-95172) provided by the National Heart, Lung, and Blood Institute and the National Center for Minority Health and Health Disparities.
No potential conflicts of interest relevant to this article were reported.
S.K.M. conceived, designed, and conducted data analysis and prepared the manuscript. R.S.V. conceived, designed, and conducted data analysis and prepared the manuscript. A.B. assisted in editing the manuscript and discussion. J.L. conceived, designed, and conducted data analysis and prepared the manuscript. V.X. assisted in editing the manuscript and discussion. M.Si. assisted in editing the manuscript and discussion. R.K.G. assisted in data collection and quality control. T.E.S. assisted in data collection and quality control. M.St. provided funding for data collection and laboratory analyses of biomarkers. H.A.T. provided funding for data collection and laboratory analyses of biomarkers. E.R.F. conceived, designed, and conducted data analysis and prepared the manuscript. S.K.M. is the guarantor of this work and, as such, had full access to all the data in the study and takes responsibility for the integrity of the data and the accuracy of the data analysis.
The authors thank the Jackson Heart Study team (University of Mississippi Medical Center, Jackson State University, and Tougaloo College) and participants for their long-term commitment and important contributions to understanding the epidemiology of cardiovascular and other chronic diseases.
Footnotes
This article contains Supplementary Data online at http://care.diabetesjournals.org/lookup/suppl/doi:10.2337/dc12-2562/-/DC1.
References
- 1.Festa A, D’Agostino R, Jr, Howard G, Mykkänen L, Tracy RP, Haffner SM. Chronic subclinical inflammation as part of the insulin resistance syndrome: the Insulin Resistance Atherosclerosis Study (IRAS). Circulation 2000;102:42–47 [DOI] [PubMed] [Google Scholar]
- 2.Ridker PM. Clinical application of C-reactive protein for cardiovascular disease detection and prevention. Circulation 2003;107:363–369 [DOI] [PubMed] [Google Scholar]
- 3.Olsen MH, Hansen TW, Christensen MK, et al. N-terminal pro brain natriuretic peptide is inversely related to metabolic cardiovascular risk factors and the metabolic syndrome. Hypertension 2005;46:660–666 [DOI] [PubMed] [Google Scholar]
- 4.Prasad A, Quyyumi AA. Renin-angiotensin system and angiotensin receptor blockers in the metabolic syndrome. Circulation 2004;110:1507–1512 [DOI] [PubMed] [Google Scholar]
- 5.Meigs JB, Hu FB, Rifai N, Manson JE. Biomarkers of endothelial dysfunction and risk of type 2 diabetes mellitus. JAMA 2004;291:1978–1986 [DOI] [PubMed] [Google Scholar]
- 6.Stiefel P, Vallejo-Vaz AJ, García Morillo S, Villar J. Role of the Renin-Angiotensin system and aldosterone on cardiometabolic syndrome. Int J Hypertens 2011;2011:685238. [DOI] [PMC free article] [PubMed] [Google Scholar]
- 7.Whaley-Connell A, Johnson MS, Sowers JR. Aldosterone: role in the cardiometabolic syndrome and resistant hypertension. Prog Cardiovasc Dis 2010;52:401–409 [DOI] [PMC free article] [PubMed] [Google Scholar]
- 8.Fox ER, Musani SK, Singh P, et al. Association of plasma B-type natriuretic peptide concentrations with longitudinal blood pressure tracking in African Americans: findings from the Jackson Heart Study. Hypertension 2013;61:48–54 [DOI] [PMC free article] [PubMed] [Google Scholar]
- 9.Ingelsson E, Pencina MJ, Tofler GH, et al. Multimarker approach to evaluate the incidence of the metabolic syndrome and longitudinal changes in metabolic risk factors: the Framingham Offspring Study. Circulation 2007;116:984–992 [DOI] [PubMed] [Google Scholar]
- 10.Reilly MP, Wolfe ML, Rhodes T, Girman C, Mehta N, Rader DJ. Measures of insulin resistance add incremental value to the clinical diagnosis of metabolic syndrome in association with coronary atherosclerosis. Circulation 2004;110:803–809 [DOI] [PubMed] [Google Scholar]
- 11.St-Onge MP, Janssen I, Heymsfield SB. Metabolic syndrome in normal-weight Americans: new definition of the metabolically obese, normal-weight individual. Diabetes Care 2004;27:2222–2228 [DOI] [PubMed] [Google Scholar]
- 12.Fuqua SR, Wyatt SB, Andrew ME, et al. Recruiting African-American research participation in the Jackson Heart Study: methods, response rates, and sample description. Ethn Dis 2005;15(Suppl. 6):S6–S18, 29 [PubMed] [Google Scholar]
- 13.Day C. Metabolic syndrome, or What you will: definitions and epidemiology. Diab Vasc Dis Res 2007;4:32–38 [DOI] [PubMed] [Google Scholar]
- 14.Ganser GH, Hewett P. An accurate substitution method for analyzing censored data. J Occup Environ Hyg 2010;7:233–244 [DOI] [PubMed] [Google Scholar]
- 15.Meigs JB, Wilson PW, Nathan DM, D’Agostino RB, Sr, Williams K, Haffner SM. Prevalence and characteristics of the metabolic syndrome in the San Antonio Heart and Framingham Offspring Studies. Diabetes 2003;52:2160–2167 [DOI] [PubMed] [Google Scholar]
- 16.Bochud M, Nussberger J, Bovet P, et al. Plasma aldosterone is independently associated with the metabolic syndrome. Hypertension 2006;48:239–245 [DOI] [PubMed] [Google Scholar]
- 17.Kidambi S, Kotchen JM, Grim CE, et al. Association of adrenal steroids with hypertension and the metabolic syndrome in blacks. Hypertension 2007;49:704–711 [DOI] [PubMed] [Google Scholar]
- 18.Schiffrin EL. Effects of aldosterone on the vasculature. Hypertension 2006;47:312–318 [DOI] [PubMed] [Google Scholar]
- 19.Vasan RS, Evans JC, Larson MG, et al. Serum aldosterone and the incidence of hypertension in nonhypertensive persons. N Engl J Med 2004;351:33–41 [DOI] [PubMed] [Google Scholar]
- 20.Sowers JR, Bakris GL, Black HR, Giles TD. The cardiometabolic syndrome and calcium channel blocker combination drugs. J Cardiometab Syndr 2007;2:207–212 [DOI] [PubMed] [Google Scholar]
- 21.Stas S, Whaley-Connell AT, Sowers JR. Aldosterone and hypertension in the cardiometabolic syndrome. J Clin Hypertens (Greenwich) 2008;10:94–96 [DOI] [PMC free article] [PubMed] [Google Scholar]
- 22.Wehling M, Christ M, Theisen K. Membrane receptors for aldosterone: a novel pathway for mineralocorticoid action. Am J Physiol 1992;263:E974–E979 [DOI] [PubMed] [Google Scholar]
- 23.Sowers JR, Whaley-Connell A, Epstein M. Narrative review: the emerging clinical implications of the role of aldosterone in the metabolic syndrome and resistant hypertension. Ann Intern Med 2009;150:776–783 [DOI] [PMC free article] [PubMed] [Google Scholar]
- 24.Brown NJ. Aldosterone and vascular inflammation. Hypertension 2008;51:161–167 [DOI] [PubMed] [Google Scholar]
- 25.Funder JW. The nongenomic actions of aldosterone. Endocr Rev 2005;26:313–321 [DOI] [PubMed] [Google Scholar]
- 26.Du Clos TW. Function of C-reactive protein. Ann Med 2000;32:274–278 [DOI] [PubMed] [Google Scholar]
- 27.Albert MA, Glynn RJ, Buring J, Ridker PM. C-reactive protein levels among women of various ethnic groups living in the United States (from the Women’s Health Study). Am J Cardiol 2004;93:1238–1242 [DOI] [PubMed] [Google Scholar]
- 28.Kim CX, Bailey KR, Klee GG, et al. Sex and ethnic differences in 47 candidate proteomic markers of cardiovascular disease: the Mayo Clinic proteomic markers of arteriosclerosis study. PLoS ONE 2010;5:e9065. [DOI] [PMC free article] [PubMed] [Google Scholar]
- 29.Fox ER, Benjamin EJ, Sarpong DF, et al. Epidemiology, heritability, and genetic linkage of C-reactive protein in African Americans (from the Jackson Heart Study). Am J Cardiol 2008;102:835–841 [DOI] [PMC free article] [PubMed] [Google Scholar]
- 30.Maachi M, Piéroni L, Bruckert E, et al. Systemic low-grade inflammation is related to both circulating and adipose tissue TNFalpha, leptin and IL-6 levels in obese women. Int J Obes Relat Metab Disord 2004;28:993–997 [DOI] [PubMed] [Google Scholar]
- 31.Feingold KR, Staprans I, Memon RA, et al. Endotoxin rapidly induces changes in lipid metabolism that produce hypertriglyceridemia: low doses stimulate hepatic triglyceride production while high doses inhibit clearance. J Lipid Res 1992;33:1765–1776 [PubMed] [Google Scholar]
- 32.Licata G, Volpe M, Scaglione R, Rubattu S. Salt-regulating hormones in young normotensive obese subjects. Effects of saline load. Hypertension 1994;23(Suppl.):I20–I24 [DOI] [PubMed] [Google Scholar]
- 33.Wang TJ, Larson MG, Keyes MJ, Levy D, Benjamin EJ, Vasan RS. Association of plasma natriuretic peptide levels with metabolic risk factors in ambulatory individuals. Circulation 2007;115:1345–1353 [DOI] [PubMed] [Google Scholar]
- 34.Das SR, Drazner MH, Dries DL, et al. Impact of body mass and body composition on circulating levels of natriuretic peptides: results from the Dallas Heart Study. Circulation 2005;112:2163–2168 [DOI] [PubMed] [Google Scholar]
- 35.Li WY, Chiu FC, Chien YF, Lin JW, Hwang JJ. Association of amino-terminal pro-brain natriuretic peptide with metabolic syndrome. Intern Med 2011;50:1143–1147 [DOI] [PubMed] [Google Scholar]
- 36.Houben AJ, van der Zander K, de Leeuw PW. Vascular and renal actions of brain natriuretic peptide in man: physiology and pharmacology. Fundam Clin Pharmacol 2005;19:411–419 [DOI] [PubMed] [Google Scholar]
- 37.Levin ER, Gardner DG, Samson WK. Natriuretic peptides. N Engl J Med 1998;339:321–328 [DOI] [PubMed] [Google Scholar]
- 38.Richards AM. Natriuretic peptides: update on Peptide release, bioactivity, and clinical use. Hypertension 2007;50:25–30 [DOI] [PubMed] [Google Scholar]
- 39.Verspohl EJ, Bernemann IK. Atrial natriuretic peptide (ANP)-induced inhibition of glucagon secretion: mechanism of action in isolated rat pancreatic islets. Peptides 1996;17:1023–1029 [DOI] [PubMed] [Google Scholar]
- 40.Birkenfeld AL, Boschmann M, Moro C, et al. Lipid mobilization with physiological atrial natriuretic peptide concentrations in humans. J Clin Endocrinol Metab 2005;90:3622–3628 [DOI] [PubMed] [Google Scholar]