

Abstract
OBJECTIVE
Increased advanced glycation end products (AGEs) and oxidation products (OPs) are proposed to lead to progression of diabetic nephropathy (DN). We investigated the relationship between AGEs, OPs, and progression of DN in 103 subjects with type 1 diabetes participating in the Natural History of Diabetic Nephropathy Study.
RESEARCH DESIGN AND METHODS
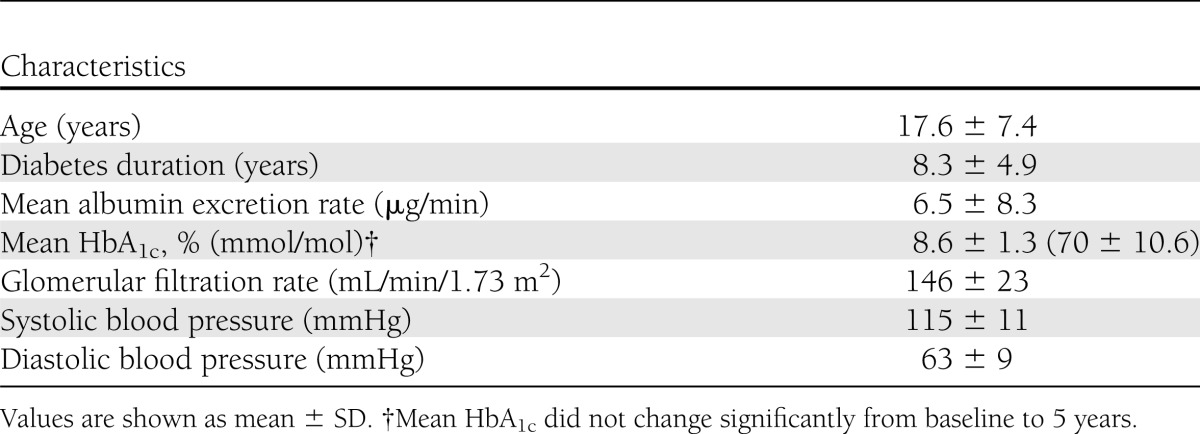
Mean age of subjects was 17.6 ± 7.4 years, and mean duration of diabetes was 8.3 ± 4.9 years. All patients were normoalbuminuric. Change in glomerular basement membrane (GBM) width from baseline to 5 years, measured using electron micrographs of renal biopsies, was our primary end point, and mesangial fractional volume was a secondary end point. Fast progressors (FPs) were defined as those in the upper quartile of GBM change, and the remaining patients were classified as slow progressors (SPs). AGEs (3-deoxyglucosone and methylglyoxal hydroimidazolones [MGHI]), carboxymethyl lysine (CML), carboxyethyl lysine (CEL), and OPs (methionine sulfoxide and 2-aminoadipic acid) were measured at year 5 by liquid chromatography/triple-quadruple mass spectroscopy on 10-K plasma filtrates.
RESULTS
We found that MGHI, CEL, and CML levels were significantly higher in FPs relative to SPs. No product predicted mesangial expansion. A model containing only HbA1c accounted for 4.7% of GBM width variation, with the total variability explained by the model increasing to 11.6% when MGHI, CEL, and CML were added to the regression model (7.9% increase). MGHI was a significant independent predictor of FP. Using a logistic regression model to relate each biomarker to the probability of a subject’s classification as an FP, CML, CEL, and MGHI, but not HbA1c, showed a significant relationship to the probability of FP.
CONCLUSIONS
The results suggest that these three major AGEs may be early indicators of progression of important DN lesions.
When considering the high economic and personal cost of diabetes-related renal disease worldwide, it is clear that better earlier predictors of diabetic nephropathy (DN) are needed. Identifying specific biochemical biomarkers predictive of DN has the potential to allow the identification of patients at high or low risk of diabetes complications during the earliest stages of diabetes, when they are still preventable.
Although several large-scale studies have clearly demonstrated that intensive glucose control plays a role in preventing or delaying diabetes complications (1,2), effective new biomarkers for early detection of clinically evident kidney damage have not been established (3–6). The current major biomarker for progression of DN, the appearance of albuminuria, often is unable to identify those at greatest risk during the long 10- to 20-year “silent phase,” during which evolving structural damage is not otherwise clinically apparent (7); by the time these markers become positive, substantial glomerular damage can already be present (8,9). HbA1c as a tool to predict diabetes complications also has significant shortcomings (10–13), and this early chemical reaction product (Amadori product) is unable to detect the more complex advanced glycation/oxidation products that may induce vascular damage. On the basis of the limitations of the biomarkers used currently, clinical treatment decisions have to be made on the premise that all diabetic patients are equally susceptible to complications when early aggressive goals are attempted in the treatment of glycemia.
The task of predicting DN is further complicated by the variable propensity to diabetes complications among individuals with diabetes (7,14,15). Although poor glycemic control is clearly a risk factor (16) for DN, accelerated DN may occur in some individuals with modest hyperglycemia, whereas others never progress in spite of poor glycemic control over many years (17,18). Studies of families show clustering of the risk of DN (14,15,19,20), and there is concordance for the severity and patterns of diabetic glomerular structural lesions among pairs of siblings with type 1 diabetes (T1DM) (7). Further support for a variable response of the kidney to hyperglycemia comes from work showing that other less well-defined variables, of equal or greater importance to glycemia, strongly influence nephropathy risk (21).
New insights into individual propensity to DN is provided by the observations that increased cellular production of methylglyoxal, a highly reactive α-dicarbonyl, and increased oxidative stress occur in patients with rapid DN progression (22–24) Since these dicarbonyl and oxidative pathways ultimately result in the formation of specific long-lived advanced glycation and oxidative end products (OPs) (25,26), which integrate the activity of precursor pathways over time, our hypothesis is that these products may have the potential to predict DN. Therefore, we have performed cross-sectional analysis of the relationship between the accumulation of these products and preceding rapid histologic change in glomerular basement width in a unique study population with T1DM (4,27,28).
RESEARCH DESIGN AND METHODS
Study population
We used blood samples from 103 normoalbuminuric subjects participating in the Natural History of Diabetic Nephropathy Study (NHDNS). This study was designed to examine the early development of DN in subjects with T1DM, as determined by electron-microscopic quantification of two research renal biopsies performed 5 years apart (4,28). The characteristics of this young population with T1DM are shown in Table 1.
Table 1.
Characteristics of the NHDNS population (n = 103) at baseline
The primary renal end point in this population was defined as change in glomerular basement membrane (GBM) width from baseline to 5 years, measured using electron micrographs of renal biopsies. Mesangial fractional volume was measured as a secondary end point. Fast progressors (FPs) were defined as patients in the upper quartile (n = 24) of GBM thickening, and slow progressors (SPs) comprised the remainder of the patients (n = 79).
Plasma sample processing
Plasma samples were collected at the 5-year NHDNS visit by a rigorous protocol where blood was collected in tubes containing EDTA and immediately placed on ice and centrifuged. Following centrifugation, plasma was immediately separated from red blood cells, snap-frozen in dry ice, and stored at −80°C until analyses were performed. We performed analyses on the plasma filtrate, prepared by centrifugation through 10-K cutoff Amicon filters, using liquid chromatography/triple-quadruple mass spectroscopy (LC-MS/MS). This fraction contains both free advanced glycation end products (AGEs) and OPs as well as peptides of various sizes, and our analytical method measured the free products as described below.
Biomarkers measured
Nine AGEs and OPs were measured by LC-MS/MS utilizing internal stable heavy isotope substituted standards. An Agilent model 6410 Triple Quadruple MS System with a 1200 Rapid Resolution LC System was used, and we have developed methods for the concurrent quantitative measurement of biomarkers indicative of protein glycation, oxidation, and nitrosative damage by employing a single 2.0 × 250-mm Synergy 4 μ 80 A column (Phenomenex, Torrance, CA) with a mobile phase of methanol/water gradient with 0.29% heptafluorobutyric acid and a total analysis time of 60 min.
AGEs measured included carboxymethyl lysine (CML), carboxyethyl lysine (CEL), glyoxal hydroimidazolone (GHI), methylglyoxal hydroimidazolone (MGHI), and 3-deoxyglucosone hydroimidazolone (3DGHI). CEL and MGHI are methylglyoxal-derived AGEs of lysine and arginine, respectively. OPs included methionine sulfoxide (MetSO), 3-nitrotyrosine, 2-aminoadipic acid, and dityrosine.
Within-analysis variation
The within-analysis coefficient of variation for 10 consecutive runs for the same plasma filtrate varied from 8.6% (MGHI) to 11.6% for GHI.
Stability of stored AGEs and OPs over time
We initially analyzed the mean levels of our AGEs and OPs in NHDNS plasma samples stored at −80°C for 10 years and compared these results with freshly drawn and prepared plasma samples from 6 young subjects with T1DM. Even for products sensitive to oxidative stress, such as MetSO, these analyses showed similar mean levels of both AGEs and OPs (data not shown).
Statistical analyses
Both continuous and categorical statistical methods were used to investigate the relationships between the AGEs/OPs and nephropathy progression based on the 5-year change in GBM width and mesangial fractional volume.
Linear regression analyses including each biomarker as a continuous covariate were fit to data from 103 participants. Both simple linear and multiple linear regression analyses were performed, including the last HbA1c, diabetes duration, and sex as multiple regression covariates when analyzing GBM; age was added to this list for analyses of change in mesangial expansion score, defined as the change in mesangial fractional volume factored for the time between baseline and follow-up biopsies. Parametric t tests (parametric) and nonparametric Wilcoxon rank-sum analyses were used to compare levels of AGEs and OPs in FP and SP groups.
Using logistic regression, we also developed predictive equations relating each biomarker to the probability of classification as FP of nephropathy. CML and MGHI values were log transformed when used as predictors. On each plot we could determine the intersection between an observed value and the probability of a subject showing a greater degree of progression of DN over 5 years. We also determined the odds ratio (OR) for a 1-SD difference in CML, CEL, and MGHI as well as HbA1c. These are displayed as forest plots.
RESULTS
Changes in renal histology occurred early
Analyses of the baseline data from the NHDNS cohort have shown that biopsy changes consistent with early DN lesions could present within a few years of the onset of T1DM, well before clinical evidence of their presence is discernible, and that these baseline structural changes are predictive of the later development of persistent microalbuminuria (29).
Three AGE biomarkers were significantly higher in FPs
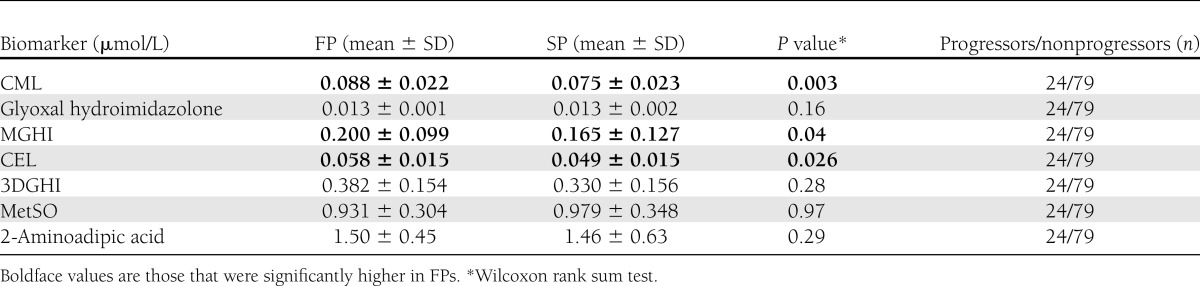
As shown in Table 2, MGHI, CEL, and CML levels were significantly higher in GBM-defined FP relative to SP. The other AGE and oxidative biomarkers measured (GHI, 3DGHI, MetSO, and 2-aminoadipic acid) were not associated with DN progression (Table 2). Levels of 3-nitrotyrosine and dityrosine were below the limits of detection. No AGE or OP predicted mesangial expansion.
Table 2.
Plasma “free fraction” biomarker levels in FPs and SPs based on rates of GBM thickening over 5 years
AGE biomarkers add to the predictive value of the regression model
Further regression analyses exploring the value of these three biomarkers (MGHI, CEL, and CML) in retroactively predicting early DN found that HbA1c at year 5 accounted for 4.7% of the variation in GBM width (R2), and the proportion of variation in GBM width accounted for by the model increased to 11.6% when MGHI, CEL, and CML were added (7.9% increase). MGHI was also a significant independent predictor of GBM increase in this analysis.
Logistic regression models of FP and SP of DN using the three informative AGE biomarkers and HbA1c
We used a logistic regression model to develop optimal predictive equations relating each biomarker to the probability of a subject’s classification as an FP. CML and MGHI values were log transformed for the statistical analysis but then back-transformed when creating the predictive probability plots shown in Fig. 1. For each biomarker, but not for HbA1c (P = 0.28), there was a significant relationship to the probability of classification as an FP (Fig. 1). For CML, CEL, and MGHI, but not HbA1c (P = 0.28), we noted significant relationships between the levels of the biomarkers and the probability of a subject being in the FP group, with P values of 0.02, 0.03, and 0.048, respectively. On each plot, as noted in Fig. 1, we could also determine the intersection between an observed value and the probability of a subject being in the FP group. Thus, using CEL as an example, a value of 0.3 nmol/L could be translated into a 10% FP risk of DN, whereas a value of 0.9 nmol/L is associated with a 50% risk.
Figure 1.

A logistic regression model was used to develop predictive equations relating each biomarker to the probability of a subject’s classification as FP of DN. CML and MGHI values were log transformed when used as predictors and then back-transformed when creating predictive probability plots. For the three biomarkers (CML [panel B], CEL [panel C], and MGHI [panel D]), but not for HbA1c (panel A) (P = 0.28), measured at the same time,, there was a significant relationship with the probability of classification as an FP (CML P = 0.02; CEL P = 0.03; MGHI P = 0.048). For HbA1c, the relationship was significant when fit to the entire sample (n = 186) over 5 years (P = 0.006).
Using this logistic regression model we also determined the OR for a 1-SD difference in the three biomarkers of interest as well as HbA1c. The ORs for FP for CEL (1.72), MGHI (1.68), and CML (1.95) were statistically significant; this was not the case for HbA1c (1.29) (Table 3). For example, a 1-SD increase in CEL would lead to a 1.72-fold increase in the odds of being in the FP group. This analysis is shown as forest plots in Fig. 2, with demonstrated significance achieved for CEL, CML, and MGHI but not HbA1c.
Table 3.
ORs for prediction of DN progression*
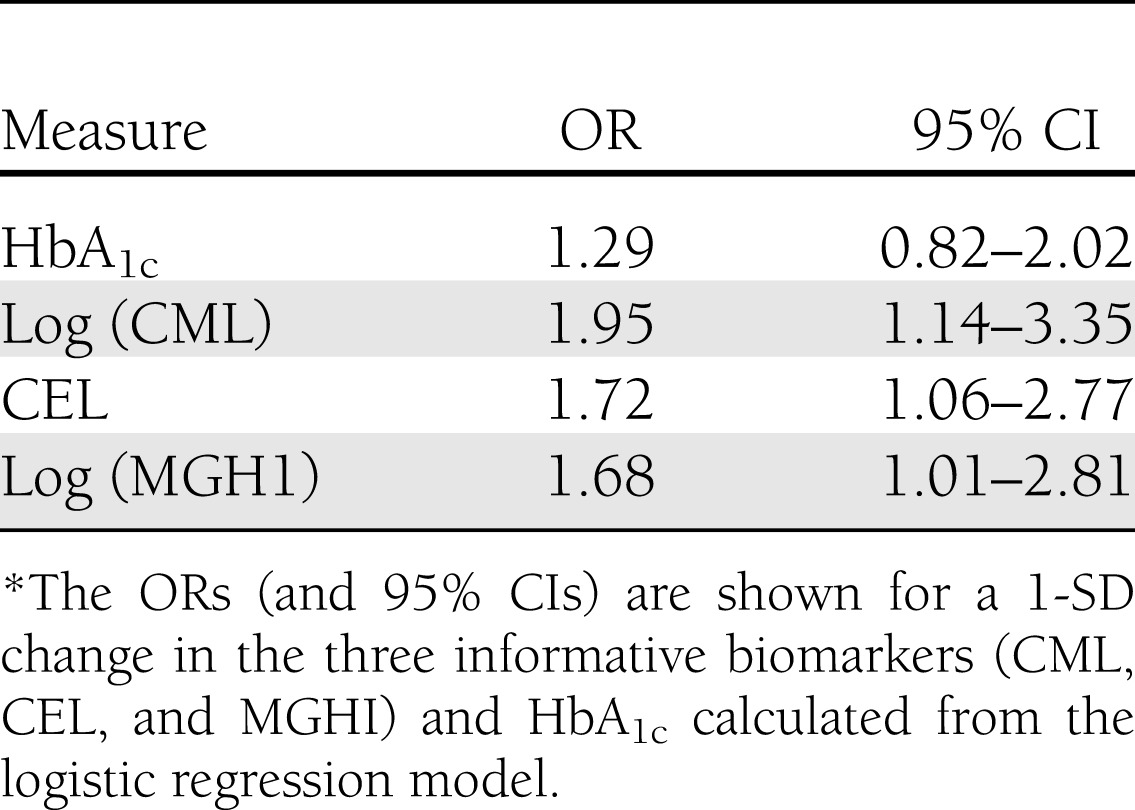
Figure 2.
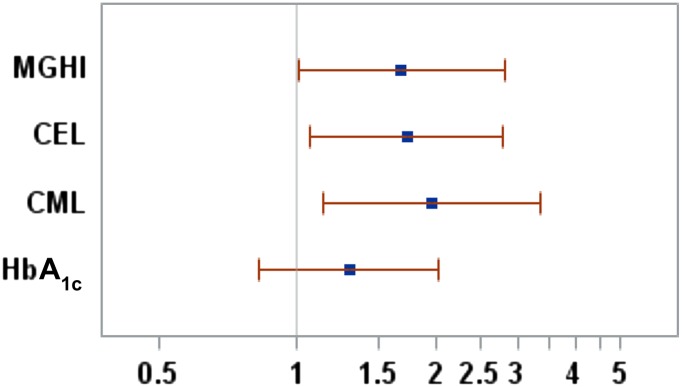
A forest plot of the ORs (and 95% CIs) for a 1-SD change in the three informative biomarkers (CML, CEL, and MGHI) and HbA1c, as calculated from the logistic regression model. For example, a 1-SD increase in CEL would lead to a 1.72-fold increase in the odds of being in the FP group. The P values for these plots are associated with those shown in Fig. 1.
Are FP or SP groups being identified?
To address this question, we looked at the percentage of FPs and SPs in the lower tertile of values for CML, CEL, and MGHI. For the lower tertile the cutoff values were <0.062 nmol/L (0.033–0.062) for CML, <0.042 nmol/L (0.020–0.042) for CEL, and <0.103 nmol/L (0.030–0.103) for MGHI. We found that the majority (94%) of subjects (30 of 32) in each lower tertile subgroup fell into the category of being protected from DN.
CONCLUSIONS
These studies show that the levels of three specific plasma biomarkers are significantly higher in FPs than in SPs, as documented by biopsy, and that these AGE biomarkers together have additive predictive value concurrent with HbA1c. More specifically, HbA1c at year 5 accounted for 4.7% of the variation in GBM width (r2), while the proportion of variation in GBM width accounted for by the model increased to 11.6% when MGHI, CEL, and CML were added (7.9% increase). We also observed that MGHI was a statistically significant independent predictor of GBM increase.
The predictive value of these three biomarkers was further explored by using a logistic regression model, where equations relating each biomarker to the probability of classification as FP, defined as the upper tertile of the rate of increase in GBM width, were developed. Using this logistical regression model we have shown that CEL, MGHI, and CML correlate significantly with (predict) FP, whereas HbA1c does not.
It should also be pointed out that all biomarkers were measured at the 5-year point and not at baseline. At this point the degree of progression or nonprogression of DN was apparent on the biopsies, and the accumulation of long-lived AGEs had occurred proportional to the degree of GBM change. Therefore, the use of the term prediction needs to be qualified since CML, CEL, and MGHI retroactively showed significant associations with the change in GBM width over the previous 5 years, suggesting the possibility that these three AGEs reflect the preceding pathogenetic processes involved in GBM thickening.
Since two of the three predictive biomarkers are end products of methylglyoxal (CEL and MGHI), these outcomes support a role for elevated methylglyoxal levels in the development of DN, which is consonant with increased cellular production of methylglyoxal in DN progressors that we and others (22) have observed. Since the OPs measured in these studies were not predictive, an association of oxidative stress in DN progression, as proposed by others, was not confirmed (30). Since CML formation results from both glycation and oxidation (31), however, it is possible that correlation of this AGE with GBM thickening also reflects some role for oxidative processes.
The method of collection, storage, and processing of samples is important because improper handling can lead to artifactual oxidation, as we found for MetSO, which was elevated in serum samples from this study that were not collected or stored per protocol. This effect was not observed, however, in appropriately processed plasma samples used in this study. We chose to measure our biomarkers in the plasma 10-K filtrate, which contains both free AGEs and OPs as well as peptides, although our assay measured only the “free fraction,” which represents breakdown products released into plasma by proteolytic digestion of chemically modified tissue proteins. Therefore, changes in plasma concentrations of free AGEs and OPs have been chosen as our primary analytical end point, since they have been shown to reflect generalized tissue damage in diabetes (26). We also considered measuring protein-bound AGEs and OPs produced by sequential digestion of plasma with multiple proteolytic enzymes (26) but decided not to because our preliminary studies showed only modest increases in biomarker levels in diabetic patients versus controls relative to that seen for the 10-K filtrate. We also decided not to measure urinary AGEs and OPs because of the confounding effect of widely varying renal clearance of products previously observed (25), leading to poor correlation with plasma levels.
Only a single plasma sample collected and processed by a rigorous protocol was analyzed in this study. Finding correlation of specific AGEs in this single plasma sample with progression of an important DN lesion suggests, but by no means assures, that even stronger predictive value could have been obtained with multiple samples collected over a few years. This question of increased predictive value when studied over longer time periods will be an important one to address in future studies. At this point we cannot tell if the three informative AGEs play a causative role in DN progression or reflect turnover of increased tissue stores of these AGEs, but considering that there is substantial evidence that AGEs can play a pathogenic role in vascular damage (32–34), the former is possible. There has been considerable interest in the relationship between AGEs and the development of DN, and an excellent review has summarized the outcomes of the relevant studies (34). In general these studies differ from that reported here in that limited numbers of AGEs and OPs were quantified, and more advanced nephropathy was usually present at the time of measurement of AGEs or OPs. We believe that this makes it unlikely that our results are influenced by albuminuria or impaired renal function and that our results relate primarily to the presence or absence of clear early, phenotypic, diabetes-related changes in kidney structure as opposed to most other studies, which showed that renal impairment or leakage of protein into urine can independently influence biomarker levels.
CML levels in skin collagen sampled at the end of the Diabetes Control and Complications Trial (DCCT) were shown to correlate with later development of DN (35), but our approach does not require such an invasive procedure to obtain tissue. Our outcomes also differ from those of Perkins et al. (36), who paradoxically observed significant increases in plasma free fraction CML, GHI, 3DGHI, and MetSO in normoalbuminuric diabetic subjects relative to those with established microalbuminuria.
We used increased GBM width as our primary renal end point, since increased GBM width has been shown to be the earliest structural indicator of progression of nephropathy to microalbuminuria in the overall NHDNS study population (29). Since changes in mesangial fractional volume are, on average, minimal in the first ≈15 years of T1DM, it did not serve as an early structural predictor of progression to microalbuminuria (37).
Clearly, we need better predictors of DN. Microalbuminuria is currently the most commonly used predictor of DN risk, but it has been recognized that ≈40% of patients with longstanding diabetes at risk for DN will have normal urinary albumin when initially screened, there is an imprecise correlation between the degree of DN proven by biopsy and the level of microalbuminuria, and nephropathy may already be advanced by the time microalbuminuria develops (38). Furthermore, only about 30% of patients with T1DM and microalbuminuria will progress to macroalbuminuria (39). Repeated measure of HbA1c has proven useful in predicting diabetic microvascular complications in large outcome studies (1), but it also has shortcomings as an early predictor of DN, including its estimation of average blood glucose over only a relatively short 3-month time period and its inability to fully reflect most of the key chemical pathways that produce complications (30).
More widespread clinical use of new biomarkers such as those identified in the studies reported here could allow early individualized treatments to prevent diabetes complications by identifying those at high or low risk of complications during the earliest stages of diabetes. This identification could allow us to select risk- and cost-appropriate therapeutic regimens to achieve appropriate levels of glycemic control in individuals destined to develop early and more severe pathology. Important information on basic biochemical mechanisms and pathways responsible for diabetes complications provided by these studies could also stimulate the development of novel therapeutic approaches that could modify offending chemical pathways to delay or arrest DN.
Acknowledgments
Financial support was provided by the Juvenile Diabetes Research Foundation.
P.J.B. is on the Speaker’s Bureau of AstraZeneca LP, Eli Lilly and Company, Novo Nordisk, Inc., Boehringer Ingelheim Pharmaceuticals, Inc., and Bristol-Myers Squibb Company. M.M. is on the advisory panel of and is a consultant for AstraZeneca LP. No other potential conflicts of interest relevant to this article were reported.
P.J.B. wrote the manuscript, researched data, and received detailed feedback and edits from each co-author. S.K.H., G.B.R., M.E.M., S.S.R., and M.M. reviewed and edited the manuscript and contributed to the discussion. G.B.R., M.E.M., and S.S.R. reviewed and validated the statistical analyses. P.J.B. is the guarantor of this work and, as such, had full access to all the data in the study and takes responsibility for the integrity of the data and the accuracy of the data analysis.
Parts of this study were presented in abstract form at the 72nd Scientific Sessions of the American Diabetes Association, Philadelphia, Pennsylvania, 8–12 June 2012.
References
- 1.The Diabetes Control and Complications Trial Research Group The effect of intensive treatment of diabetes on the development and progression of long-term complications in insulin-dependent diabetes mellitus. N Engl J Med 1993;329:977–986 [DOI] [PubMed] [Google Scholar]
- 2.Turner RC, Cull CA, Frighi V, Holman RR, UK Prospective Diabetes Study (UKPDS) Group Glycemic control with diet, sulfonylurea, metformin, or insulin in patients with type 2 diabetes mellitus: progressive requirement for multiple therapies (UKPDS 49). JAMA 1999;281:2005–2012 [DOI] [PubMed] [Google Scholar]
- 3.Caramori ML, Fioretto P, Mauer M. The need for early predictors of diabetic nephropathy risk: is albumin excretion rate sufficient? Diabetes 2000;49:1399–1408 [DOI] [PubMed] [Google Scholar]
- 4.Drummond K, Mauer M, International Diabetic Nephropathy Study Group The early natural history of nephropathy in type 1 diabetes: II. Early renal structural changes in type 1 diabetes. Diabetes 2002;51:1580–1587 [DOI] [PubMed] [Google Scholar]
- 5.Mogensen CE, Christensen CK. Predicting diabetic nephropathy in insulin-dependent patients. N Engl J Med 1984;311:89–93 [DOI] [PubMed] [Google Scholar]
- 6.Perkins BA, Krolewski AS. Early nephropathy in type 1 diabetes: the importance of early renal function decline. Curr Opin Nephrol Hypertens 2009;18:233–240 [DOI] [PMC free article] [PubMed] [Google Scholar]
- 7.Fioretto P, Steffes MW, Barbosa J, Rich SS, Miller ME, Mauer M. Is diabetic nephropathy inherited? Studies of glomerular structure in type 1 diabetic sibling pairs. Diabetes 1999;48:865–869 [DOI] [PubMed] [Google Scholar]
- 8.Dluhy RG, McMahon GT. Intensive glycemic control in the ACCORD and ADVANCE trials. N Engl J Med 2008;358:2630–2633 [DOI] [PubMed] [Google Scholar]
- 9.Cefalu WT. Glycemic targets and cardiovascular disease. N Engl J Med 2008;358:2633–2635 [DOI] [PubMed] [Google Scholar]
- 10.Monnier L, Colette C. Contributions of fasting and postprandial glucose to hemoglobin A1c. Endocr Pract 2006;12(Suppl. 1):42–46 [DOI] [PubMed] [Google Scholar]
- 11.Beisswenger PJ, Howell SK, O’Dell RM, Wood ME, Touchette AD, Szwergold BS. alpha-Dicarbonyls increase in the postprandial period and reflect the degree of hyperglycemia. Diabetes Care 2001;24:726–732 [DOI] [PubMed] [Google Scholar]
- 12.Ceriello A, Hanefeld M, Leiter L, et al. Postprandial glucose regulation and diabetic complications. Arch Intern Med 2004;164:2090–2095 [DOI] [PubMed] [Google Scholar]
- 13.Rohlfing CL, Wiedmeyer HM, Little RR, England JD, Tennill A, Goldstein DE. Defining the relationship between plasma glucose and HbA(1c): analysis of glucose profiles and HbA(1c) in the Diabetes Control and Complications Trial. Diabetes Care 2002;25:275–278 [DOI] [PubMed] [Google Scholar]
- 14.Clustering of long-term complications in families with diabetes in the diabetes control and complications trial. The Diabetes Control and Complications Trial Research Group. Diabetes 1997;46:1829–1839 [PubMed] [Google Scholar]
- 15.Seaquist ER, Goetz FC, Rich S, Barbosa J. Familial clustering of diabetic kidney disease. Evidence for genetic susceptibility to diabetic nephropathy. N Engl J Med 1989;320:1161–1165 [DOI] [PubMed] [Google Scholar]
- 16.Lachin JM, Genuth S, Nathan DM, Zinman B, Rutledge BN, DCCT/EDIC Research Group Effect of glycemic exposure on the risk of microvascular complications in the diabetes control and complications trial—revisited. Diabetes 2008;57:995–1001 [DOI] [PubMed] [Google Scholar]
- 17.Krolewski AS, Warram JH, Rand LI, Kahn CR. Epidemiologic approach to the etiology of type I diabetes mellitus and its complications. N Engl J Med 1987;317:1390–1398 [DOI] [PubMed] [Google Scholar]
- 18.Andersen AR, Christiansen JS, Andersen JK, Kreiner S, Deckert T. Diabetic nephropathy in Type 1 (insulin-dependent) diabetes: an epidemiological study. Diabetologia 1983;25:496–501 [DOI] [PubMed] [Google Scholar]
- 19.Prager TC, Wilson DJ, Avery GD, et al. Vitreous fluorophotometry: identification of sources of variability. Invest Ophthalmol Vis Sci 1981;21:854–864 [PubMed] [Google Scholar]
- 20.Pettitt DJ, Saad MF, Bennett PH, Nelson RG, Knowler WC. Familial predisposition to renal disease in two generations of Pima Indians with type 2 (non-insulin-dependent) diabetes mellitus. Diabetologia 1990;33:438–443 [DOI] [PubMed] [Google Scholar]
- 21.Caramori ML, Kim Y, Huang C, et al. Cellular basis of diabetic nephropathy: 1. Study design and renal structural-functional relationships in patients with long-standing type 1 diabetes [published correction appears in Diabetes 2002;51:1294]. Diabetes 2002;51:506–513 [DOI] [PubMed] [Google Scholar]
- 22.Beisswenger PJ, Drummond KS, Nelson RG, Howell SK, Szwergold BS, Mauer M. Susceptibility to diabetic nephropathy is related to dicarbonyl and oxidative stress. Diabetes 2005;54:3274–3281 [DOI] [PubMed] [Google Scholar]
- 23.Lu J, Randell E, Han Y, Adeli K, Krahn J, Meng QH. Increased plasma methylglyoxal level, inflammation, and vascular endothelial dysfunction in diabetic nephropathy. Clin Biochem 2011;44:307–311 [DOI] [PubMed] [Google Scholar]
- 24.Beisswenger P, Howell S, Szwergold B, et al. Progression of diabetic nephropathy is predicted by increased oxidative stress and decreased deglycation (Abstract). Diabetologia 2008;51(Suppl. 1):S24 [Google Scholar]
- 25.Ahmed N, Babaei-Jadidi R, Howell SK, Beisswenger PJ, Thornalley PJ. Degradation products of proteins damaged by glycation, oxidation and nitration in clinical type 1 diabetes. Diabetologia 2005;48:1590–1603 [DOI] [PubMed] [Google Scholar]
- 26.Ahmed N, Babaei-Jadidi R, Howell SK, Thornalley PJ, Beisswenger PJ. Glycated and oxidized protein degradation products are indicators of fasting and postprandial hyperglycemia in diabetes. Diabetes Care 2005;28:2465–2471 [DOI] [PubMed] [Google Scholar]
- 27.Drexel H, Klocker H, Patsch JR, Breier C, Braunsteiner H. Measurement of glycated protein by a rapid and specific method for absolute quantification of lysine-bound glucose. Clin Chem 1987;33:1656–1659 [PubMed] [Google Scholar]
- 28.Drummond KN, Kramer MS, Suissa S, et al. International Diabetic Nephropathy Study Group Effects of duration and age at onset of type 1 diabetes on preclinical manifestations of nephropathy. Diabetes 2003;52:1818–1824 [DOI] [PubMed] [Google Scholar]
- 29.Caramori M, Parks A, Mauer M. Renal lesions and diabetic nephropathy risk in type 1 diabetes. J Am Soc Nephrol. In press [DOI] [PMC free article] [PubMed] [Google Scholar]
- 30.Brownlee M. The pathobiology of diabetic complications: a unifying mechanism. Diabetes 2005;54:1615–1625 [DOI] [PubMed] [Google Scholar]
- 31.Baynes JW, Thorpe SR. Role of oxidative stress in diabetic complications: a new perspective on an old paradigm. Diabetes 1999;48:1–9 [DOI] [PubMed] [Google Scholar]
- 32.Brownlee M. Biochemistry and molecular cell biology of diabetic complications. Nature 2001;414:813–820 [DOI] [PubMed] [Google Scholar]
- 33.Kalea AZ, Schmidt AM, Hudson BI. RAGE: a novel biological and genetic marker for vascular disease. Clin Sci (Lond) 2009;116:621–637 [DOI] [PubMed] [Google Scholar]
- 34.Monnier VM, Sell DR, Genuth S. Glycation products as markers and predictors of the progression of diabetic complications. Ann N Y Acad Sci 2005;1043:567–581 [DOI] [PubMed] [Google Scholar]
- 35.Genuth S, Sun W, Cleary P, et al. DCCT Skin Collagen Ancillary Study Group Glycation and carboxymethyllysine levels in skin collagen predict the risk of future 10-year progression of diabetic retinopathy and nephropathy in the diabetes control and complications trial and epidemiology of diabetes interventions and complications participants with type 1 diabetes. Diabetes 2005;54:3103–3111 [DOI] [PMC free article] [PubMed] [Google Scholar]
- 36.Perkins BA, Rabbani N, Weston A, et al. Serum levels of advanced glycation endproducts and other markers of protein damage in early diabetic nephropathy in type 1 diabetes. PLoS One 2012;7:e35655. [DOI] [PMC free article] [PubMed] [Google Scholar]
- 37.Steinke JM, Sinaiko AR, Kramer MS, Suissa S, Chavers BM, Mauer M, International Diabetic Nephopathy Study Group The early natural history of nephropathy in Type 1 Diabetes: III. Predictors of 5-year urinary albumin excretion rate patterns in initially normoalbuminuric patients. Diabetes 2005;54:2164–2171 [DOI] [PubMed] [Google Scholar]
- 38.Fioretto P, Steffes MW, Mauer M. Glomerular structure in nonproteinuric IDDM patients with various levels of albuminuria. Diabetes 1994;43:1358–1364 [DOI] [PubMed] [Google Scholar]
- 39.Giorgino F, Laviola L, Cavallo Perin P, Solnica B, Fuller J, Chaturvedi N. Factors associated with progression to macroalbuminuria in microalbuminuric Type 1 diabetic patients: the EURODIAB Prospective Complications Study. Diabetologia 2004;47:1020–1028 [DOI] [PubMed] [Google Scholar]