Abstract
Analysis of texture within tumours on computed tomography (CT) is emerging as a potentially useful tool in assessing prognosis and treatment response for patients with cancer. This article illustrates the image and histological features that correlate with CT texture parameters obtained from tumours using the filtration-histogram approach, which comprises image filtration to highlight image features of a specified size followed by histogram analysis for quantification. Computer modelling can be used to generate texture parameters for a range of simple hypothetical images with specified image features. The model results are useful in explaining relationships between image features and texture parameters. The main image features that can be related to texture parameters are the number of objects highlighted by the filter, the brightness and/or contrast of highlighted objects relative to background attenuation, and the variability of brightness/contrast of highlighted objects. These relationships are also demonstrable by texture analysis of clinical CT images. The results of computer modelling may facilitate the interpretation of the reported associations between CT texture and histopathology in human tumours. The histogram parameters derived during the filtration-histogram method of CT texture analysis have specific relationships with a range of image features. Knowledge of these relationships can assist the understanding of results obtained from clinical CT texture analysis studies in oncology.
Keywords: Computed tomography, tumour heterogeneity, computer-assisted image processing, radiological-pathological correlation
Introduction
Heterogeneity is an important feature of malignancy that is associated with adverse tumour biology. Texture analysis is emerging as a useful technique for assessing heterogeneity in tumour images that are acquired in routine clinical practice[1,2]. Quantitative assessments of tumour heterogeneity have the potential to provide non-invasive imaging biomarkers of prognosis and treatment response. Clinical studies have indicated the ability of CT texture analysis (CTTA) to provide independent predictors of survival for patients with non-small cell lung cancer (NSCLC), oesophageal cancer, colorectal cancer (CRC) and head and neck cancer and an early marker of treatment response in metastatic renal cancer[2]. This article illustrates the image and histological features that correlate with CT texture parameters obtained using the filtration-histogram approach to texture analysis.
Analysis methodology
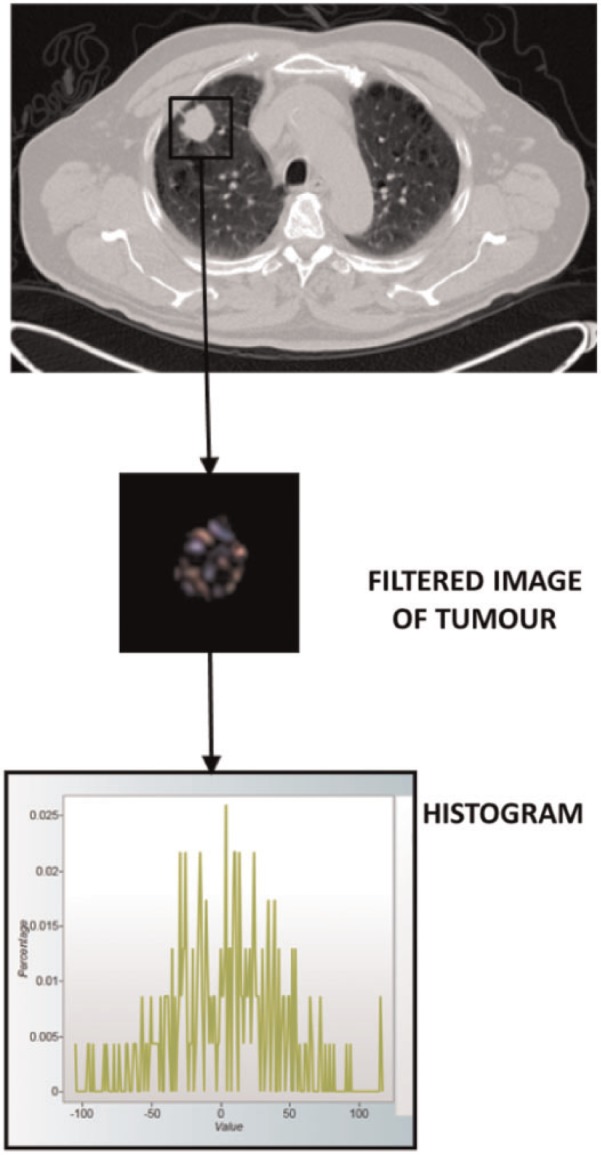
CTTA quantifies the distribution of pixel values within a lesion. The filtration-histogram method comprises an initial filtration step that highlights image features of a specified size, followed by histogram analysis of the filtered image (Fig. 1). The size of the image features highlighted by the filter is denoted by the spatial scaling factor (SSF), which ranges between object radii of 2–6 mm. The histograms of the pixel values in the filtered and unfiltered images are quantified using standard descriptors, specifically: mean, standard deviation (SD), skewness and kurtosis (Table 1).
Figure 1.

Summary of the filtration-histogram method for CTTA. The conventional CT image (top) is filtered to highlight objects of a pre-selected size. The distribution of tumour features within the filtered image (middle) is assessed using standard statistical parameters derived from the corresponding histogram (bottom).
Table 1.
Definitions of histogram parameters
| Parameter | Definition |
|---|---|
| Mean | The average value of the pixels within the region of interest |
| SD | A measure of how much variation or dispersion exists from the average (mean value). A low SD indicates that the data points tend to be very close to the mean; high SD indicates that the data points are spread out over a large range of values |
| Skewness | A measure of the asymmetry of the histogram. The skewness value can be positive or negative. A negative skew indicates that the tail on the left side of the histogram is longer than the right side. A positive skew indicates that the tail on the right side is longer than the left side. A zero value indicates that the values are evenly distributed on both sides of the mean |
| Kurtosis | A measure of the peakedness of the histogram. The kurtosis value can be positive or negative. A positive kurtosis indicates a histogram that is more peaked than a Gaussian (normal) distribution. A negative kurtosis indicates that histogram is flatter than a Gaussian (normal) distribution |
Impact of highlighted objects on post-filtration histograms
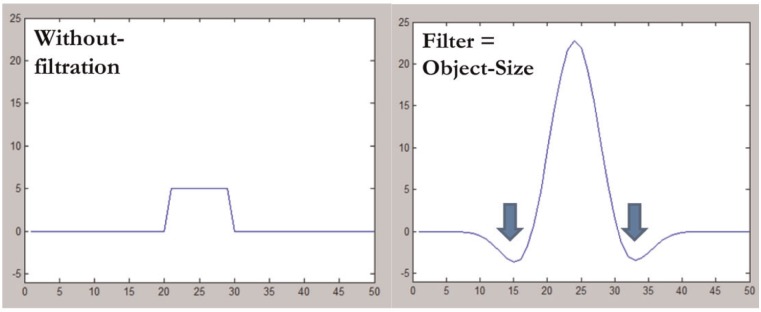
Fig. 2 shows the effect the filter has on the profile of an object that matches the SSF. For an object brighter than the surrounding pixels, the object is enhanced and the adjacent pixels are suppressed and inverted. The degree of suppression depends on the difference in attenuation between the enhanced object and the adjacent pixel. For an object darker than the surrounding pixels, the object is enhanced and inverted and the adjacent pixels are suppressed. A uniform array of pixels of any value returns an array of zero pixels after filtration.
Figure 2.

Profiles from an object with a radius of 10 pixels and density of 5 HU before (left) and after (right) image filtration using an SSF that matches the object radius. The image intensity of the object is increased (peak 23 HU), whereas the surrounding pixels are suppressed and inverted (minimum density –3 HU, blue arrows).
The impact of highlighting objects brighter or darker than their surrounds on post-filtration histograms can be modelled as illustrated in Fig. 3. An image with no highlighted objects gives a histogram entirely composed of zeros (Fig. 3A). For an object brighter than adjacent pixels, the increase in pixel values for the enhanced object results in a shift of values to the right, whereas the suppression of the adjacent pixels results in some values being shifted to the left (Fig. 3B). For objects less bright than adjacent pixels, the enhanced and inverted pixels are shifted to the left (Fig. 3C).
Figure 3.

No highlighted object (A) results in all pixels being zero. Pixels from a highlighted object that is brighter than background are enhanced producing right-sided histogram values; suppression and inversion of the surrounding pixels results in left-sided histogram values that are closer to zero than enhanced pixels (B). The opposite pattern is seen for objects darker than background (C).
Table 2 shows the histogram values for the distributions in Fig. 3. Note that compared with no highlighted objects, a bright object increases the mean value and results in positive skewness, whereas a dark object decreases the mean value and produces negative skewness. SD increases and kurtosis decreases irrespective of whether the highlighted objects are brighter or darker than their backgrounds.
Table 2.
Histogram values for the distributions in Fig. 3
| Parameter | No objects highlighted | Bright object after filtration | Dark object after filtration |
|---|---|---|---|
| Mean | 0 | 0.88 | –0.88 |
| SD | 0 | 5.88 | 5.88 |
| Skewness | 0 | 2.85 | –2.85 |
| Kurtosis | 50 | 7.39 | 7.39 |
Impact of additional highlighted objects
Table 3 compares modelled histogram parameters obtained when one object is highlighted by the filter with the corresponding values when (a) two objects of the same brightness are highlighted, (b) one bright object and one equivalent dark object are highlighted, (c) two bright objects of different intensity with the second having half the intensity of the single object, and (d) two bright objects of different intensity with the second having twice the intensity of the single object. It can be seen that adding a second object of the same brightness doubles the mean value and increases the SD; skewness and kurtosis are reduced. With one bright and one dark object highlighted, mean and skewness are zero (i.e. as for no highlighted objects) as the effects of bright and dark objects cancel. However, SD values are comparable (but slightly higher) with that observed with two bright objects. Kurtosis is reduced compared with the value for one object but the reduction is less than that seen for two bright objects. With two objects of differing intensity, the mean and SD values change in proportion to the mean intensity of the objects. However, skewness and kurtosis are increased compared with two objects of the same intensity, irrespective of whether the second object is brighter or darker than the single object. Thus, these parameters are increased in the presence of greater variability in the intensity of highlighted objects. Based on the above, the image characteristics responding to each histogram can be summarized as in Table 4.
Table 3.
Histogram values comparing one bright object highlighted by the filter with different combinations of pairs of objects
| Parameter | One bright object | Two objects, same brightness | One bright and one dark object | Two bright objects (second object less intense) | Two bright objects (second object more intense) |
|---|---|---|---|---|---|
| Mean | 0.88 | 1.76 | 0 | 1.32 | 2.64 |
| SD | 5.88 | 8.22 | 8.41 | 6.51 | 13.02 |
| Skewness | 2.85 | 1.75 | 0 | 2.11 | 2.11 |
| Kurtosis | 7.39 | 1.46 | 2.82 | 3.56 | 3.56 |
Table 4.
Summary of major effects of image features on histogram parameters
| Histogram parameter | Main corresponding image characteristics |
|---|---|
| Mean | Changes approximately in proportion to the number of objects highlighted and their mean brightness (dark objects are negative) |
| SD | Increases approximately in proportion to the square root of the number of objects highlighted and their mean intensity difference compared to background (i.e. dark and bright objects are both positive) |
| Skewness | Reflects the average brightness of highlighted objects (predominantly bright objects give positive values, predominantly dark objects negative values) |
| Tends to zero with increasing number of objects highlighted | |
| Moves away from zero with intensity variations in highlighted objects | |
| Kurtosis | Inversely related to the number of objects highlighted (whether bright or dark). Increased by intensity variations in highlighted objects |
Image examples
Comparison of unenhanced and contrast-enhanced liver
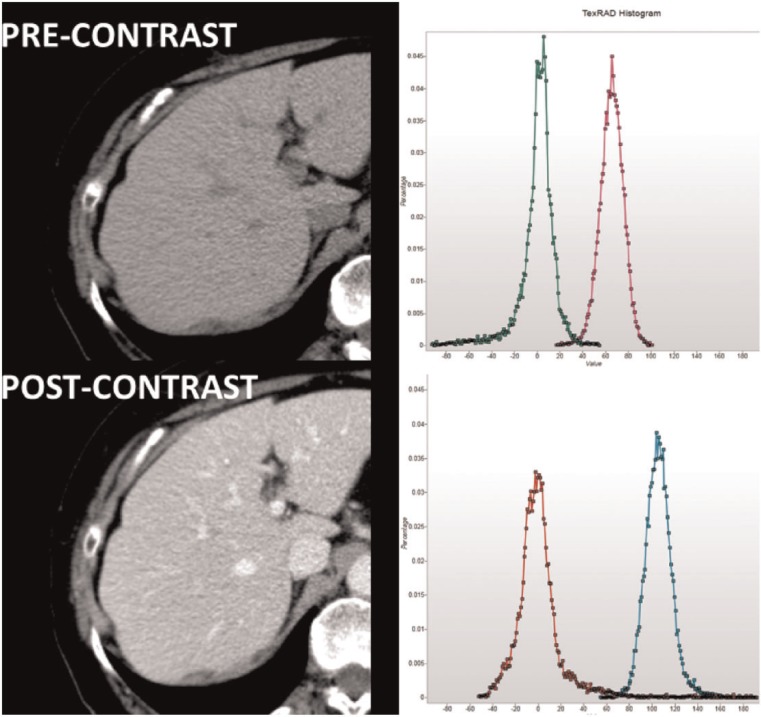
Fig. 4 shows images of the liver before and after contrast enhancement along with the histograms from a right lobe region of interest (ROI) before filtration and after filtration with an SSF of 6 mm. Table 5 gives the histogram parameters for each ROI. Each ROI comprised in excess of 16000 pixels.
Figure 4.
Liver images before (above) and after (below) contrast along with the corresponding histograms from liver regions before image filtration (magenta before contrast, cyan after contrast) and after filtration (green before contrast, red after contrast) to high objects of radius 6 mm. (The x-axis ranges have been matched.)
Table 5.
Histogram parameters for the liver regions from Fig. 4
| SSF | Before contrast |
After contrast |
||||||
|---|---|---|---|---|---|---|---|---|
| Mean | SD | Skewness | Kurtosis | Mean | SD | Skewness | Kurtosis | |
| 2 | 0.07 | 23.41 | –0.1393 | 0.4395 | –0.02 | 29.22 | 0.3767 | 1.3891 |
| 3 | 0.13 | 18.21 | –0.7693 | 2.993 | 0.05 | 25.49 | 1.1459 | 4.5284 |
| 4 | 0.2 | 16.62 | –1.3712 | 5.9439 | 0.31 | 24.11 | 2.068 | 10.4249 |
| 5 | 0.21 | 16.04 | –1.6813 | 6.9841 | 0.59 | 23.41 | 2.6674 | 14.9277 |
| 6 | 0.09 | 15.41 | –1.7851 | 6.7521 | 0.82 | 22.71 | 2.8955 | 15.9609 |
This example compares images with comparable numbers of objects highlighted (i.e. blood vessels) with the objects being hypodense (dark) before contrast enhancement and hyperdense (bright) after contrast. The SD values are comparable but higher after contrast. Based on Table 4, this finding likely reflects similar numbers of objects highlighted, but with greater attenuation differences between highlighted objects (i.e. vessels) and background after contrast. The hypodensity of the vessels before contrast becoming hyperdense after contrast is reflected by negative and positive skewness values, respectively. The post-enhancement skewness values lie further from zero consistent with increased variability in the brightness of highlighted objects after contrast. A similar effect would account for the higher kurtosis values after contrast despite similar numbers of highlighted objects. The mean values close to zero imply highlighting of objects of opposite density balancing the vessels, most likely areas of liver parenchyma.
Comparison of liver with spleen after contrast
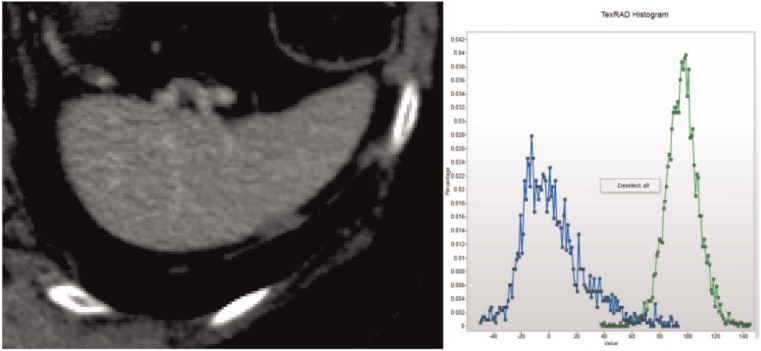
Fig. 5 shows an image and histograms with and without filtration for the spleen after contrast. There are objects brighter than background but fewer than enhanced liver with a lower enhancement difference. Table 6 gives the corresponding histogram parameters. SD values are lower than for enhanced liver but are higher than unenhanced liver consistent with intermediate number and brightness of highlighted objects. Skewness values for contrast-enhanced spleen are positive reflecting the preponderance of objects brighter than background. However, the skewness values are lower than for enhanced liver consistent with reduced variability in the contrast between highlighted objects and background with a similar effect accounting for the lower kurtosis values. The negative mean values suggest highlighted areas of splenic parenchyma, dark compared with vessels, exceed the number of highlighted vessels.
Figure 5.
Contrast-enhanced spleen and corresponding histograms before (green) and after (blue) image filtration
Table 6.
Histogram parameters for contrast-enhanced spleen
| SSF | Mean | SD | Skewness | Kurtosis |
|---|---|---|---|---|
| 0 | 96.46 | 12.05 | 0.0089 | 1.1427 |
| 2 | 0.45 | 31.34 | 0.3234 | 0.0416 |
| 3 | –0.61 | 23.49 | 0.5226 | 0.2758 |
| 4 | –1.2 | 19.95 | 0.5948 | 0.1905 |
| 5 | –1.35 | 18.43 | 0.455 | –0.1493 |
| 6 | –1.21 | 16.52 | 0.4046 | –0.5591 |
Secondary histogram parameters
The basic histogram parameters can be used to derive a range of secondary parameters. The derivation of these parameters and their relationships to image features are summarized in Table 7.
Table 7.
Summary of some secondary histogram parameters
| Parameter | Derivation | Relationship to image features |
|---|---|---|
| Mean of positive pixels (MPP) | Considers only pixels greater than 0 | Reduces the impact of dark objects on the mean histogram value |
| Proportion of positive pixels (PPP) | The fraction of pixels in the filtered image with values greater than 0 | Reflects the number of objects (positive or negative) highlighted by the filter |
| Variance | SD2 | Approximately linear relationship with the number of objects highlighted but approximates an exponential relationship with their mean intensity difference compared with background |
| Kurtosis reciprocal | 1/(kurtosis + 3) | Approximates a linear relationship with number of objects highlighted. Reduced by intensity variations amongst highlighted objects |
| Normalized SD | ln(SD)/ln(pixel number) | Relates SD to the potential variability for the region size |
Histological correlates
Several studies have reported associations between CT texture measurements derived using the filtration-histogram approach (Table 8). These findings suggest relationships between regional variations in tumour attenuation values on CT images and a range of biological tumour processes. However, detailed interpretation of these associations is constrained by a lack of information on how attenuation values in tumour tissue are altered by specific pathologic features. Obtaining such data through CT images of explanted tumour material is further complicated by changes in blood volume resulting from tumour removal and an inability to replicate the effects of contrast enhancement. Nevertheless, two studies on lung tumours suggest that differences in CT attenuation exist between solid tumour, necrosis, blood and fibrosis[3,4]. Based on these limited studies, necrosis appears to exhibit lower attenuation than solid tumour, whereas inactive fibrosis appears to be more attenuating than solid tumour[3]. In this study, blood had lower attenuation than solid tumour but blood within explanted tissue is likely to have the attenuation characteristics of denatured blood. From clinical practice, fresh blood, including intravascular blood is typically of higher attenuation. Based on these studies and the results of texture analysis modelling described above, tentative explanations for the observed associations between histopathology and CT texture can be proposed.
Table 8.
Pathologic correlates for CT texture measurements using the filtration-histogram method
| Tumour type | Histological marker | Parameter (association) | CT technique | Reference |
|---|---|---|---|---|
| NSCLC | Hypoxia: pimonidazole (extrinsic marker) | SD (+) | CE | Ganeshan et al.[5] |
| NSCLC | Angiogenesis: CD34 | MPP (–) | UE and CE | Ganeshan et al.[5] |
| NSCLC | Ki67–proliferation | PPP (+) | LDCT (PET) | Ganeshan et al.[6] |
| Colorectal with KRAS mutation | Hypoxia: HIF-1alpha | MPP (–) | LDCT (PET) | Ganeshan et al.[7] |
| Colorectal with KRAS mutation | Angiogenesis: CD105 | Skewness (+) | LDCT (PET) | Ganeshan et al.[7] |
| Colorectal without KRAS mutation | Angiogenesis: VEGF | SD (–) | LDCT (PET) | Ganeshan B et al.[7] |
| Glioma | Tumour grade | SD (+) | CE | Skogen et al.[8] |
| Breast | Tumour grade | SD (–) | LDCT (PET) | Ganeshan et al.[9] |
| Breast | Oestrogen receptor expression | SD (+) | LDCT (PET) | Ganeshan et al.[9] |
| Breast | Progesterone receptor expression | SD/20 + skewness (+) | LDCT (PET) | Ganeshan et al.[7] |
CE, contrast-enhanced; MPP, mean of positive pixels; UE, unenhanced; PPP, proportion of positive pixels; LDCT (PET), low-dose unenhanced CT component of positron emission tomography/CT).
Of the primary histogram parameters, SD has been most commonly shown to be associated with specific histological markers. SD is positively associated with hypoxia in NSCLC[5] and negatively associated with angiogenesis in CRCs without the KRAS mutation[7]. SD values are increased with dark or bright objects highlighted by the filter. Hypoxic areas of tumour are typically associated with necrosis, which exhibits low attenuation values. Furthermore, hypoxia and necrosis are more likely to occur in tumours with low levels of angiogenesis. Hence, both correlations probably reflect increased numbers of dark tumour regions. The fact that SD is positively correlated with tumour grade in glioma[8] but negatively with grade in breast cancer[9] could reflect differential highlighting of dark or bright regions in these tumour types, perhaps reflecting varying amounts of inactive fibrosis. The positive association between skewness and angiogenesis in CRCs with KRAS mutations[7] is consistent with a preponderance of bright areas in tumours with high angiogenesis. The combination of high SD and skewness that has been associated with progesterone (PR) status in breast cancer implies a preponderance of bright objects highlighted in PR-positive tumours, whereas the association with SD alone in oestrogen-positive tumours could reflect highlighting of bright and/or dark image features[9].
Of the secondary histogram parameters, the mean of positive pixels (MPP) has been correlated negatively with angiogenesis in NSCLC[5] and negatively with hypoxia in CRCs exhibiting KRAS mutations[7]. The latter correlation is consistent with hypoxic tumours exhibiting fewer bright areas due to a greater likelihood of necrosis. The negative correlation with angiogenesis in NSCLC is harder to explain with the computer simulations above, but it should be remembered that even positive pixels do result when the filter highlights dark as well as light objects due to inversion of the surrounding pixels (Fig. 3C). However, the divergent associations between MPP and histology in these tumour types would suggest differences in the relationships between angiogenesis and hypoxia in NSCLC and CRC.
Conclusion
The histogram parameters derived during the filtration-histogram method of CTTA have specific relationships to the number of image features highlighted by filtration, the contrast or brightness of the highlighted features relative to background and the variability in the contrast of highlighted features. Knowledge of these relationships can assist the understanding of results obtained from clinical CTTA studies in oncology.
Disclosures
The authors are shareholders and directors of TexRAD Ltd, a supplier of texture analysis software for medical images.
Footnotes
This article was presented at the ICIS Society Meeting and 13th Annual Teaching Course, York, UK, 30 September to 2 October 2013.
References
- 1.Davnall F, Yip CS, Ljungqvist G, et al. Assessment of tumor heterogeneity: an emerging imaging tool for clinical practice? Insights Imaging. 2012;3:573–589. doi: 10.1007/s13244-012-0196-6. [DOI] [PMC free article] [PubMed] [Google Scholar]
- 2.Ganeshan B, Miles KA. Quantifying tumour heterogeneity with CT. Cancer Imaging. 2013;13:140–149. doi: 10.1102/1470-7330.2013.0015. [DOI] [PMC free article] [PubMed] [Google Scholar]
- 3.Quaia E, Baratella E, Pizzolato R, Bussani R, Cova MA. Radiological-pathological correlation in intratumoural tissue components of solid lung tumours. Radiol Med. 2009;114:173–189. doi: 10.1007/s11547-008-0354-6. [DOI] [PubMed] [Google Scholar]
- 4.Sieren JC, Smith AR, Thiesse J, et al. Exploration of the volumetric composition of human lung cancer nodules in correlated histopathology and computed tomography. Lung Cancer. 2011;74:61–68. doi: 10.1016/j.lungcan.2011.01.023. [DOI] [PMC free article] [PubMed] [Google Scholar]
- 5.Ganeshan B, Goh V, Mandeville HC, Ng QS, Hoskin PJ, Miles KA. Non-small cell lung cancer: histopathologic correlates for texture parameters at CT. Radiology. 2013;266:326–336. doi: 10.1148/radiol.12112428. [DOI] [PubMed] [Google Scholar]
- 6.Ganeshan B, Miles K, Win T, et al. CT markers of angiogenesis and proliferation in non-small cell lung cancer. International Cancer Imaging Society 2012, Oxford, UK. [Google Scholar]
- 7.Ganeshan B, Ziauddin X, Goh VJ, et al. Quantitative imaging biomarkers from PET-CT as potential correlates for angiogenesis and hypoxia in colorectal cancer. European Society of Radiology 2012, Vienna, Austria. [Google Scholar]
- 8.Skogen K, Ganeshan B, Good C, Critchley G, Miles K. Measurements of heterogeneity in gliomas on computed tomography relationship to tumour grade. J Neurooncol. 2013;111:213–219. doi: 10.1007/s11060-012-1010-5. [DOI] [PubMed] [Google Scholar]
- 9.Ganeshan B, Keshtgar MR, Endozo R, et al. CT texture analysis as an adjunct to PET-CT in early breast cancer: a potential marker of tumour receptor status and grade. In: UK Radiological Congress 2012, Manchester, UK. [Google Scholar]


