

Abstract
This present investigation deals with the development and optimization of polymeric nanoparticle systems loaded with 3,5,3′-triiodothyroacetic acid (Triac). A 211–6 fractional factorial design and another 22 factorial design were used to study the contrasts on particle size distribution, morphology, surface charge, drug content, entrapment efficiency, and in vitro drug release profiles. The independent variables were the concentration of Triac, type and quantity of both polymer and oil, quantity of Span™ 60 and Tween® 80, volume of solvent and water, and velocity of both magnetic stirring and the transfer of the organic phase into the aqueous solution. The results of optimized formulations showed a narrow size distribution with a polydispersity index lower than 0.200. The particle sizes were on average 159.6 nm and 285.6 nm for nanospheres and nanocapsules, respectively. The zeta potential was higher than 20 mV (in module) and the entrapment efficiency was nearly 100%. A high-performance liquid chromatography method was developed, validated, and efficiently applied to Triac quantification in colloidal suspension. The main independent variables were the type and quantity of the polymer and oil. In vitro drug release profile depicted several features to sustain Triac release. Different formulations showed various release rates indicating an interaction between Triac and other formulation compounds such as polymer and/or oil quantity. Two different models were identified (biexponential and monoexponential) that allowed the control of both the release rate and Triac concentration. Thus, the prepared nanoparticles described here may be of clinical importance in delivering Triac for thyroid treatment.
Keywords: Triac, nanoparticles, optimization, factorial design of experiments, HPLC analytical method
Introduction
Thyroid hormone receptors (TRs) are members of the nuclear receptor superfamily that are activated by the binding of thyroid hormones.1 They are essential for the development of several organs, including the central nervous system, skeleton, heart, intestine, skeletal muscle, and sensory organs. Moreover, TRs also have important regulatory effects on oxygen consumption and metabolic rate.2 The 3,5,3′-L-triiodothyronine (T3), and L-thyroxine are the most abundant thyroid hormones.1 There are several diseases related to TRs, notably the syndrome of resistance to thyroid hormone that is an inherited endocrine human disease characterized by a reduced responsiveness of target tissues to thyroid hormone. Resistance to thyroid hormone is usually caused by a mutation in the TRβ gene.2,3 The mutations have been described in the carboxyl-terminus of TRβ, in three hot spot areas of the ligand-binding and hinge domains.34
3,5,3′-triiodothyroacetic acid (Triac), a naturally-occurring T3 analog, has been used on an empirical basis to treat the syndrome of resistance to thyroid hormone in goitrous patients, in some subjects with thyroid cancer, and in thyroidectomized patients, in order to achieve better thyroid-stimulating hormone suppression without symptoms of thyrotoxicosis.5 It has been reported that Triac binds to TRs with higher affinity than T3, but it has a very short residence time on nuclear receptors and a short plasmatic half-life.56 Furthermore, Triac shows little solubility in water. Therefore, high daily doses are necessary. Triac concentrations may be up to 200 times the physiological concentration of T3.7 On the other hand high concentrations may cause various undesirable effects such as an increase of the heart rate and induction of arrhythmias, which might limit Triac’s usefulness.8 The solutions to these problems are among the main reasons for the development of new formulations such as polymeric nanoparticle systems.
Thus, it would be desirable to develop compounds, techniques, or formulations that could elicit beneficial effects while avoiding the deleterious actions. In order to achieve such purpose, there are several studies upon nanoparticles that highlight these subjects. Nanoparticles have been used to increase bioavailability, sustain, localize, or target drug action in the body9 These carrier systems have been proposed for controlled delivery of drugs.
Nanoparticles have showed satisfactory therapeutic potential and greater stability in biologic fluids as well as during storage.10 They have been used for several reasons: (a) improvement of the bioavailability of drugs with poor adsorption characteristics, (b) prolongation of the residence time of drugs in the body, (c) control of the release of the drugs, (d) targeting of therapeutic agents to a particular organ or tissue and thus reducing toxicity, and (e) improvement of the drug stability11
In order to use drugs safely in the body, various carrier systems have been proposed by using biodegradable polymers as poly(ɛ-caprolactone) (PCL), polylactide, and polyglycolide. These polymeric materials are usually biocompatible, nonantigenic, and highly hydrophobic in nature.12 For example, PCL and poly(methyl methacrylate) (PMMA) are biocompatible polyesters, which have been widely used in drug delivery applications. They have some desirable characteristics such as being resistant to chemical hydrolysis, achiral, high permeability for many drugs, and lack of toxicity9
In the present work, Triac was entrapped in both PCL and PMMA nanoparticles. The nanoparticles of Triac were prepared by interfacial polymer deposition following solvent displacement, known as nanoprecipitation method, which was proposed by Fessi et al.13 Problems in formulation, delivery, and release characteristics of Triac are among the reasons for this study. The optimized formulation was identified by using two factorial designs. Firstly, a 211–6 fractional factorial design was carried out. Secondly, the best formulation went through a specific adjustment according to another 22 factorial design. Factorial designs are commonly adopted in pharmaceutical research that is concerned with the effects of formulation variables and their interactions on response variables; this is because they yield the most information from fewer experiments.14
Material and methods
Reagents and chemicals
Triac was obtained from Sigma-Aldrich Chemie GmbH (Steinheim, Germany). The polymers PCL (average molecular weight 65,000 Da) and PMMA (average molecular weight 120,000 Da), and the sorbitan monostearate (Span™ 60) were bought from Sigma-Aldrich. Polysorbate 80 (Tween® 80) and isodecyl oleate were obtained from Importadora Quimica Delaware (Porto Alegre, Brazil). The phosphoric acid, sodium chloride, potassium chloride, disodium hydrogen phosphate, and potassium dihydrogen phosphate were obtained from J T Baker (Ecatepec, Mexico). The neem oil was provided by Barauna Comercio Industria LTDA (Catanduva, Brazil). All organic solvents used were high-performance liquid chromatography (HPLC) grade purchased from J T Baker. Purified water (18 MΩ) was obtained by a reverse osmosis Milli-Q® system model UV plus ultra-low organics water (Millipore Corporation, Bedford, MA).
Preparation of nanoparticles
The nanoparticles were prepared through the method of solvent displacement involving the precipitation of a preformed polymer (nanoprecipitation) proposed by Fessi et al.13 Briefly, an exact quantity of polymer, Triac, Span 60, and oil (only in nanocapsules) were accurately weighed and dissolved in acetone at 45°C. Then, the organic phase was poured into Tween 80 aqueous solution, which was under moderate magnetic stirring, by using a peristaltic pump at 10% (PumpPro® TPM 600 55RPM; Watson-Marlow Pumps Group, Wilmington, MA) at ambient temperature. In due course, the colloidal suspension was maintained for 10 minutes under moderate magnetic stirring. Subsequently, the solvent and excess of water were removed by using a rotary evaporator (Rotovapor® R-210, Buchi Labortechnik AG, Flawil, Switzerland). The formulations are described in Tables 1 and 2. The final volume of each colloidal dispersion was fixed in 100 mL.
Table 1.
Values and coded units of 211–6 fractional factorial design for the preparation of 3,5,3′-triiodothyroacetic acid-loaded nanoparticles by the nanoprecipitation method
| Exp | A | B | C | D | E | ABCDE = F | ABCD = G | ABCE = H | ABDE = I | ACE = J | BCDE = K |
|---|---|---|---|---|---|---|---|---|---|---|---|
| 1 | −1 | −1 | −1 | −1 | −1 | −1 | 1 | 1 | 1 | 1 | 1 |
| 2 | 1 | −1 | −1 | −1 | −1 | 1 | −1 | −1 | −1 | −1 | 1 |
| 3 | −1 | 1 | −1 | −1 | −1 | 1 | −1 | −1 | −1 | 1 | −1 |
| 4 | 1 | 1 | −1 | −1 | −1 | −1 | 1 | 1 | 1 | −1 | −1 |
| 5 | −1 | −1 | 1 | −1 | −1 | 1 | −1 | −1 | 1 | −1 | −1 |
| 6 | 1 | −1 | 1 | −1 | −1 | −1 | 1 | 1 | −1 | 1 | −1 |
| 7 | −1 | 1 | 1 | −1 | −1 | −1 | 1 | 1 | −1 | −1 | 1 |
| 8 | 1 | 1 | 1 | −1 | −1 | 1 | −1 | −1 | 1 | 1 | 1 |
| 9 | −1 | −1 | −1 | 1 | −1 | 1 | −1 | 1 | −1 | −1 | −1 |
| 10 | 1 | −1 | −1 | 1 | −1 | −1 | 1 | −1 | 1 | 1 | −1 |
| 11 | −1 | 1 | −1 | 1 | −1 | −1 | 1 | −1 | 1 | −1 | 1 |
| 12 | 1 | 1 | −1 | 1 | −1 | 1 | −1 | 1 | −1 | 1 | 1 |
| 13 | −1 | −1 | 1 | 1 | −1 | −1 | 1 | −1 | −1 | 1 | 1 |
| 14 | 1 | −1 | 1 | 1 | −1 | 1 | −1 | 1 | 1 | −1 | 1 |
| 15 | −1 | 1 | 1 | 1 | −1 | 1 | −1 | 1 | 1 | 1 | −1 |
| 16 | 1 | 1 | 1 | 1 | −1 | −1 | 1 | −1 | −1 | −1 | −1 |
| 17 | −1 | −1 | −1 | −1 | 1 | 1 | 1 | −1 | −1 | −1 | −1 |
| 18 | 1 | −1 | −1 | −1 | 1 | −1 | −1 | 1 | 1 | 1 | −1 |
| 19 | −1 | 1 | −1 | −1 | 1 | −1 | −1 | 1 | 1 | −1 | 1 |
| 20 | 1 | 1 | −1 | −1 | 1 | 1 | 1 | −1 | −1 | 1 | 1 |
| 21 | −1 | −1 | 1 | −1 | 1 | −1 | −1 | 1 | −1 | 1 | 1 |
| 22 | 1 | −1 | 1 | −1 | 1 | 1 | 1 | −1 | 1 | −1 | 1 |
| 23 | −1 | 1 | 1 | −1 | 1 | 1 | 1 | −1 | 1 | 1 | −1 |
| 24 | 1 | 1 | 1 | −1 | 1 | −1 | −1 | 1 | −1 | −1 | −1 |
| 25 | −1 | −1 | −1 | 1 | 1 | −1 | −1 | −1 | 1 | 1 | 1 |
| 26 | 1 | −1 | −1 | 1 | 1 | 1 | 1 | 1 | −1 | −1 | 1 |
| 27 | −1 | 1 | −1 | 1 | 1 | 1 | 1 | 1 | −1 | 1 | −1 |
| 28 | 1 | 1 | −1 | 1 | 1 | −1 | −1 | −1 | 1 | −1 | −1 |
| 29 | −1 | −1 | 1 | 1 | 1 | 1 | 1 | 1 | 1 | −1 | −1 |
| 30 | 1 | −1 | 1 | 1 | 1 | −1 | −1 | −1 | −1 | 1 | −1 |
| 31 | −1 | 1 | 1 | 1 | 1 | −1 | −1 | −1 | −1 | −1 | 1 |
| 32 | 1 | 1 | 1 | 1 | 1 | 1 | 1 | 1 | 1 | 1 | 1 |
| Low | PCL | 300 | NO | 10 | 250 | 82 | 0* | 62.5 | 62.5 | 25 | 65 |
| High | PMMA | 700 | IO | 50 | 1000 | 250 | 750 | 187.5 | 187.5 | 62.5 | 130 |
Note:
Nanospheres.
Abbreviations: A, kind of polymer; B, velocity of magnetic stirring (rpm); C, kind of oil; D, velocity to transferring the organic phase into aqueous solution (% of the pump capacity); E, quantity of 3,5,3′-triiodothyroacetic acid (μg); exp, experiment; F, quantity of polymer (mg); G, quantity of oil (mg); h, quantity of Span™ 60; I, quantity of Tween® 80; IO, isodecyl oleate; J, quantity of solvent (mL); K, quantity of water (mL); NO, neem oil; PCL, poly(ɛ-caprolactone); PMMA, poly(methyl methacrylate).
Table 2.
Values and coded units of 22 factorial design
| Experiment | Levels
|
Variables
|
||
|---|---|---|---|---|
| Low | High | PMMA (mg) | Oil* (mg) | |
| 33 | −1 | −1 | 82.5 | 0 |
| 34 | 1 | −1 | 250 | 0 |
| 35 | −1 | 1 | 82.5 | 750 |
| 36 | 1 | 1 | 250 | 750 |
Note:
Isodecyl oleate.
Abbreviation: PMMA, poly(methyl methacrylate).
Experimental design
The experiments were performed with the nanoprecipitation method by using a fractional factorial design. Eleven independent variables were studied in two levels: low and high, which were represented by the normalized values of −1 and +1, respectively. The independent variables were: concentration of Triac, type and quantity of both polymer and oil, quantity of Span 60 and Tween 80, volume of solvent and water, and velocity of both magnetic stirring and the transfer of the organic phase into the aqueous solution. The experiment was fractioned in 211–6, resulting in 32 formulations. The experimental setup of these selected variables is shown in Table 1. The dependent variables investigated were: pH, particle size, zeta potential, Triac absolute recovery, and Triac entrapment efficiency. Microsoft Office Excel® 2007 (Microsoft Corporation, Redmond, WA) was used for the analysis of contrast values between factors. The repeatability in the nanoparticle preparation was evaluated through relative standard deviation (RSD) calculations for six formulations randomly selected. The best selected formulation from the first 211–6 factorial design was studied in-depth using a 22 factorial design, which resulted in four other formulations (Table 2). In this second design, the independent variables were the quantity of polymer (PMMA) and the presence (750.0 mg, 0.75% mass/volume) or absence of isodecyl oleate (0.0 mg). The quantity of the organic solvent, water, and the surfactants Span 60 and Tween 80 were 25 mL, 65 mL, 187.5 mg, and 62.5 mg, respectively. The velocity of magnetic stirring (700 rpm) and transfer of the organic phase into the aqueous solution (10% of the maxima velocity of the peristaltic pump) were kept constant. The amount of Triac was 1 mg. The dependent variables were those already reported in the 211–6 factorial design plus released kinetics.
Physicochemical characterization of nanoparticles
Quantification of Triac content in nanoparticles
Triac was assayed by HPLC (1200 Series; Agilent Technologies, Santa Clara, CA). The HLPC system was configured with a degasser G1322A, quaternary pump G1311A, autosampler G1329A, column oven G1316A, and ultraviolet detector G1314B. Control of the HPLC system and the acquisition and processing of data was carried out through EZCrom™ SI software (G6702AA; Agilent Technologies). The reversed-phase procedure in isocratic mode utilized a stainless steel Gemini® C18 column (150 × 4.6 mm inner diameter, 5 μm particle size; Phenomenex, Torrance, CA) coupled with a C18 (4 × 3 mm inner diameter, 5 μm particle size) security guard cartridge (Phenomenex). The mobile phase consisted of a mixture of acetonitrile and triethylamine buffer 0.1% (40:60 volume/volume), with fixed pH 5.6. The column temperature was maintained at 35°C. The flow rate was 1.0 mL/minute for 10 minutes to an injection volume of 20 μL. All experiments were performed at 220 nm.
Preparation of sample solutions and method validation
A stock standard solution of 1 mg mL−1 of Triac was prepared by accurately weighing 10 mg of Triac into a 10 mL volumetric flask and filling up the volume with methanol. A working standard solution (100 μg mL−1) was obtained by further dilution of the stock standard solution. Seven standard solutions (5, 10, 20, 40, 60, 80, and 100 μg mL−1), each one in triplicate, were obtained by measuring the required amount of the working standard solution, being mixed with a sufficient quantity of methanol. Similarly, three standard solutions (6, 50, and 90 μg mL−1), were each prepared in quintuplicate to determine the accuracy and precision of the method. The linearity was determined through the calculation of the linear regression from the peak area versus the concentration plot for the seven standard solutions using the linear least squares methodology, and through the analysis of respective response factors (ie, peak area divided by concentration of each standard sample). The limits of detection (LOD) and quantification (LOQ) were calculated mathematically based on the relationship between the standard deviation of the calibration curve and its slope, by using the multiplier suggested in the International Conference on Harmonization standard.15 LOD and LOQ were calculated from the following equations:
Pretreatment and analyses of Triac from polymeric nanoparticles
Before Triac content was assayed by HPLC on optimized chromatographic parameters, it was necessary to develop two different pretreatment methods: a specific one to assay the total content of Triac in colloidal suspension (absolute recovery) and another one to quantify the Triac associated with the nanoparticles (entrapment efficiency).
The total content of Triac was determined by the opening of nanoparticles dispersed in a colloidal suspension, following the procedure described below: 1 mL of chloroform was added to 0.5 mL of colloidal suspension and left to rest for 2 hours. This time was necessary for the total dissolution of the polymer with simultaneous delivery of Triac to the dispersion medium (solvent). In due course, 0.5 mL of methanol was added and the solution was subjected to centrifugation at 14,000 rpm for 30 minutes at 30°C (5810 R; Eppendorf, Hamburg, Germany) which made the total Triac extraction from the polymer possible. Finally, the methanol phase was dried (SpeedVac® Plus SC 110A; Savant Instruments Inc, Farmingdale, NY) and the Triac was resuspended in 0.2 mL of methanol that had been analyzed by HPLC.
The entrapment efficiency of the Triac nanoparticles was determined by analyzing the concentration of the free unloaded compound in the aqueous phase of the colloidal suspension. Centrifugation was carried out using the cellulose acetate tube filter of the 0.22-μm pore membrane (Costar® Spin-X®; Corning Inc, Corning, NY). Approximately 0.5 mL of nanoparticle dispersion was placed in the outer chamber of the filter assembly. The assembly was then centrifuged at 5000 rpm for 15 minutes at 15°C. The nanoparticles along with encapsulated compounds remained in the outer chamber, whereas the aqueous dispersion medium containing the free unloaded compounds moved to the sample recovery chamber through the filter membrane. After separation, 0.3 mL of aqueous dispersion medium was dried. Finally, the product was resuspended in 0.2 mL of methanol and the amount of free Triac in the dispersion medium was estimated by HPLC. The entrapment efficiency was subsequently calculated as the equation follows:
Characterization of suspensions
The physicochemical analysis of nanoparticles was carried out immediately after their preparation. After preparing all colloidal suspensions, the pH values were determined by using a potentiometer (B474; Micronal, Sao Paulo, Brazil). The particle size analysis of nanoparticles was performed by photon correlation spectroscopy. The photon correlation spectroscopy measurements (nm) were carried out at room temperature and a fixed angle of 90 degrees. This technique yields the mean particle hydrodynamic diameter and the polydispersity index, which is a dimensionless measure of the broadness of the particle size distribution. The values of both the particle size and the zeta potential were measured by using Zetatrac® (Microtrac Inc, Montgomeryville, PA) which was controlled by Flex version 10.5.0 software (Microtrac). For photon correlation spectroscopy and zeta potential (mV) measurements, 0.1 mL of each colloidal suspension was diluted into 10 mL of ultrapure water and 10 mM sodium chloride, respectively. The values reported are the mean values for each nanoparticle formulation. These measures were carried out at 25°C.
The nanoparticles were dried on polished metal support and then gold sputtered after they were examined by scanning electron microscopy (SEM) (XL 30 FEG; Philips, Eindhoven, Netherlands) at 10 kV, using different magnifications up to 25,000×.
In vitro release studies of Triac from nanocapsules
In vitro release studies of Triac from nanocapsules in colloidal suspension were carried out after some changes in the dialysis bag diffusion technique previously described by Levy and Benita.16 Dialysis bags (dialysis tubing cellulose membrane, 0.4 inches; Sigma-Aldrich) with 1 mL of the Triac colloidal suspension were sealed and dropped into 1 L of phosphate buffered saline (PBS) at pH 7.4. This solution was kept under continuous magnetic stirring. PBS was prepared by dissolving the following salts: 8 g sodium chloride; 0.2 g potassium chloride; 1.44 g sodium phosphate dibasic dihydrate, and 0.24 g of monopotassium phosphate per 1 L of ultrapure water. The whole system was kept at 35°C and on continuous stream at 3 mL/minute. The stream was controlled by a peristaltic pump (PumpPro TPM 600). At given time intervals, a dialysis bag was withdrawn from the stirred release medium and the Triac content was directly assayed by the previously validated HPLC method. The values reported were the mean values of three different batches.
Results and discussion
Significant efforts have been applied to research in nanotechnology to make new ways of drug vectorization of molecules such as hormones, antitumors, and antimicrobials available, as well as make macromolecules such as polysaccharides, proteins, and peptides deliver into specific tissues or target cells.11,17
The nanoprecipitation method involves the precipitation of a preformed polymer from an organic solution with the diffusion of this organic solvent into the aqueous medium. All formulations presented a macroscopic homogeneous aspect like a bluish white milky opalescent fluid (Tyndall effect) as a result of the nanoparticle formation as soon as the organic phases were diffused into the aqueous phase, in agreement with results previously reported for other nanoparticle systems.13,18 This observation confirms the formation of nanoparticles. The polymer was dissolved in a water-miscible solvent of intermediate polarity, leading to the precipitation of nanospheres (absence of oil) and nanocapsules. Polymeric deposition occurs in the interface between the water and organic solvent caused by fast diffusion of the solvent, which leads to the instantaneous formation of a colloidal suspension. The solvent displacement technique allows the preparation of nanocapsules when a small volume of nontoxic oil is incorporated into the organic phase.11,19
Through the nanoprecipitation technique proposed by Fessi et al,13 it was possible to make several colloidal suspensions of nanospheres and nanocapsules to both PCL and PMMA loaded with Triac. This technique has been depicted to be simple as well as very reproducible. The better formulations have shown absolute recovery and entrapment efficiency higher than 90%, demonstrating a high performance of the nanoprecipitation technique to Triac. High loading efficiencies are generally reported for lipophilic drugs when nanoparticles are prepared.11,19
In the formulations proposed for the current study, it was possible to prepare colloidal suspension containing up to 20 μg mL−1 (32.2 μM) of Triac. This concentration was nearly 5000 times higher than a simple Triac soluble in aqueous medium (4.0 × 10⁻³ μg mL−1). Triac dispersion in the colloidal suspension prepared in this work can be increased or decreased by controlling the water quantity in the final volume of the preparation.
The PCL and PMMA polymers are considered to be biocompatible materials.4 Pharmaceutical nanotechnology focuses on formulating therapeutically active agents in biocompatible nanoforms.20 Thus, PCL and PMMA are safe and desirable for biological experiments. The spherical shape of nanoparticles was confirmed by using SEM. In order to obtain good resolution through SEM, it was necessary to remove all the water from the colloidal suspension after being added to the polished metal support. This process caused the gathering of nanoparticles, and polymeric pellicle was formed as a result. However, it was possible to observe nanoparticles on the polymeric pellicle (Figure 1).
Figure 1.
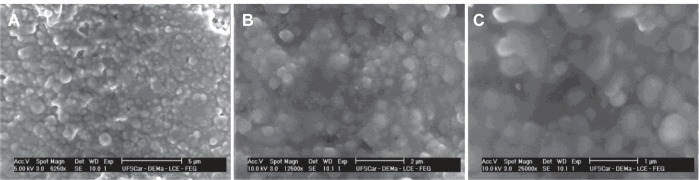
Scanning electron microscope images of poly(methyl methacrylate) nanocapsules containing 3,5,3′-triiodothyroacetic acid at different magnifications: (A) 6250×; (B) 12,500×, and (C) 25,000×.
Analytical validation
The investigation of both absolute recovery and entrapment efficiency variables was made possible by using the HPLC method. Therefore, the applicability of the method was checked by analytical validation according to the International Conference on Harmonization.15 The parameters investigated were as follows: specificity, linearity and range, accuracy and precision, LOD, and LOQ. The specificity of the method was evaluated by comparing the chromatograms of prepared nanoparticle samples containing the active compound with prepared nanoparticle samples without Triac (Figure 2). No interfering peak was observed in 4.55 minutes in the blank chromatogram (retention time of Triac) at a wavelength of 220 nm. In this sense, the method may be considered to be specific for the desired analysis since no interference peaks were observed. The analytical calibration curves (n = 3) were linear over the concentration range from 5–100 μg mL−1 (Figure 3).
Figure 2.
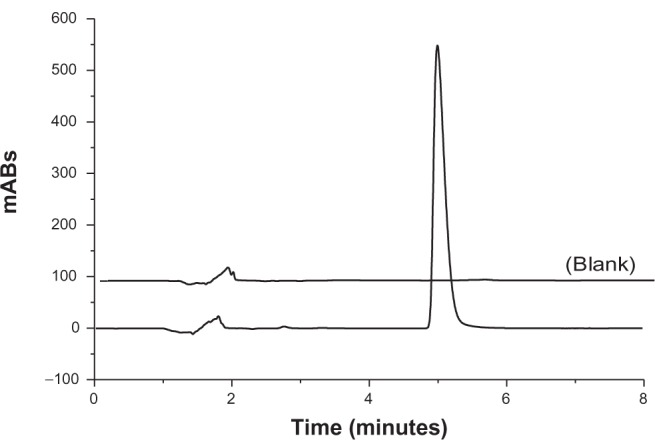
Typical chromatogram of a suspension of polymeric nanoparticles with and without (blank) 3,5,3′-triiodothyroacetic acid.
Figure 3.
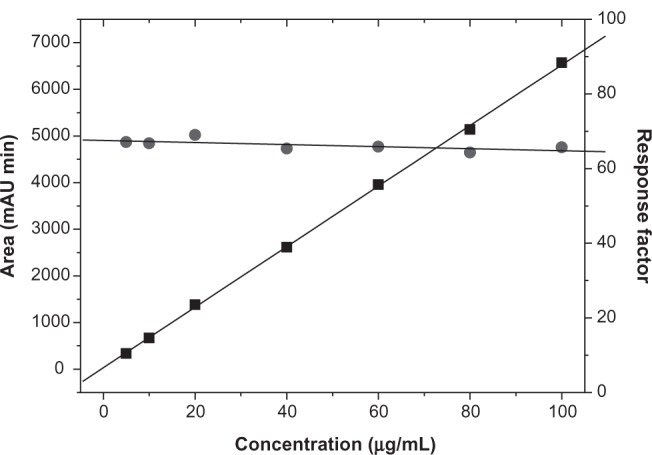
Linearity for the quantitative method of 3,5,3′-triiodothyroacetic acid analysis by high-performance liquid chromatography. (A) Calibration curve obtained with 3,5,3′-triiodothyroacetic acid standard solutions (n = 21); and (B) 3,5,3′-triiodothyroacetic acid response factor versus concentration of 3,5,3′-triiodothyroacetic acid standard solution (n = 21).
Linearity was assessed through calculating the regression equation (y = ax + b) and the correlation coefficient (r2) by the least squares method where: y = (64.94 ± 0.1834) x + (30.17 ± 8.143) and r2 = 0.9996; “y” represents the area of the chromatographic peak and “x” represents the concentration of standard solution in μg mL−1. The standard deviations of the values of “a” and “b” are indicated in the parentheses. When r2 values are greater than 0.999 it indicates a good linearity of all the concentrations used and a homoscedastic distribution of replicates at all levels applied in the calibration curve assembly. The quality of linearity was also evaluated through analysis of the response factor (Figure 3). The visual appearance of the chart and the value of the linear regression, which were obtained by plotting the response factors of each standard solution of the established work range versus the concentration of the standard solutions (Figure 3), revealed a slope (−0.03) close to zero and 2.3% of the RSD between all levels of the concentration patterns, thus enhancing the evaluation of the linearity of the method. Therefore, samples may be adequately analyzed within the concentration range of the proposed method.
Accuracy was analyzed by calculating the average percentage recoveries for Triac at three different concentrations. The three standard solutions (6, 50, and 90.0 μg mL−1) were each carefully prepared in quintuplicate and analyzed by the proposed method in three nonconsecutive days. These concentrations were chosen as they covered the linear working range. The same solutions were used to calculate the precision. The total average recovery (accuracy) and RSD was 99.3% ± 1.23%, showing strong agreement between the experimental and theoretical values. The precision was represented by RSD. RSD for repeatability at each concentration level of standard solutions on each day (n = 5) and for all days (n = 15) were lower than 1.17% and 1.76%, respectively. The results indicate good precision of the analytical method. Detailed results for the three concentration levels tested are shown in Table 3.
Table 3.
Results of precision for three different concentrations of 3,5,3′-triiodothyroacetic acid standard solutions
| Nominal concentration (μg mL−1) | Mean concentration μg mL−1/RSD (%)
|
|||
|---|---|---|---|---|
| Precision
|
Accuracy
|
|||
| Day 1 | Day 2 | Day 3 | All days | |
| (n = 5) | (n = 5) | (n = 5) | (n = 15) | |
| 6 | 5.69/0.001 | 5.87/1.06 | 5.72/1.41 | 5.76/1.45 |
| 50 | 50.8/1.17 | 49.2/0.512 | 49.5/1.35 | 49.8/1.76 |
| 90 | 91.7/1.02 | 92.2/0.802 | 91.9/0.490 | 91.9/0.83 |
Abbreviation: RSD, relative standard deviation.
LOD and LOQ were calculated in accordance with the standard deviation of the response (32.07) and slope of the calibration curve (64.94). They were found to be 1.3 μg mL−1 and 3.8 μg mL−1, respectively. The validated method was successfully applied in the evaluation of both the absolute recovery and the entrapment efficiency of Triac in polymeric nanoparticles. The pretreatments were shown to be effective for the quantification of the total content of Triac, showing a high efficiency of the solvent mixture and time used to extract this compound in each of the colloidal suspensions which were prepared, and also to analyze the amount of Triac encapsulated. It was possible to obtain recoveries up to 100% with regard to the linear calibration curve. These results are fundamental for the analysis of whether the target analyte was efficiently nanoencapsulated and its solubility and stability increased, as well as for the analysis of the kinetic release and the tested formulation efficacy. The quantitative results are described in Table 3.
Characterization of nanoparticles loaded with Triac
The aim of this study was to develop and evaluate processes and parameters to prepare nanoparticles loaded with Triac by using factorial designs. Two factorial designs, a fractional 211–6 and another 22, were proposed and developed to look for better features for nanoparticles loaded with Triac. For the first fractional factorial design 211–6, there were eleven independent variables which resulted in 32 experiments. The second 22 factorial design had two independent variables which resulted in four experiments. The last one was carried out by using the best formulation identified in the first factorial design, which was determined after analysis of the dependent variables. The results of the dependent variables for both factorial designs are illustrated in Tables 4 and 5, respectively.
Table 4.
Results of the pH, particle size, zeta potential, absolute recovery, and entrapment efficiency for the 211–6 fractional factorial design
| Exp | pH | PS (nm) | ζ (mV) | AR (%) | EE (%) |
|---|---|---|---|---|---|
| 1 | 4.46 | 336.0 | −14.6 | 44.6 | 98.7 |
| 2 | 6.43 | UNC | −14.53 | 96.9 | 100.5 |
| 3 | 5.17 | 226.4 | 15.90 | 16.0 | 99.4 |
| 4 | 6.48 | 367.0 | −20.18 | 44.3 | 97.9 |
| 5 | 4.47 | 264.5 | −14.12 | 69.7 | 97.4 |
| 6 | 6.15 | 323.0 | −29.24 | 101.5 | 98.6 |
| 7 | 7.00 | 516.0 | −35.98 | 107.0 | 99.0 |
| 8 | 5.76 | 124.7 | −14.53 | 98.9 | 98.0 |
| 9 | 4.87 | 269.7 | −18.52 | 39.7 | 100.7 |
| 10 | 4.31 | 597.0 | 8.01 | 14.5 | 97.3 |
| 11 | 4.85 | 344.0 | −18.31 | 69.6 | 98.2 |
| 12 | 6.50 | 174.2 | −25.06 | 97.2 | 100.3 |
| 13 | 6.41 | 97.6 | −3.40 | 73.8 | 98.1 |
| 14 | 6.20 | 752.0 | −19.91 | 104.5 | 88.1 |
| 15 | 5.45 | 533.0 | −20.10 | 79.2 | 97.8 |
| 16 | 4.75 | 169.8 | −21.17 | 89.5 | 99.9 |
| 17 | 4.92 | 657.0 | −39.97 | 88.2 | 99.6 |
| 18 | 6.03 | 137.7 | −20.15 | 99.5 | 94.4 |
| 19 | 6.10 | 156.6 | −21.06 | 113.6 | 84.2 |
| 20 | 6.37 | 235.6 | −42.62 | 94.3 | 99.6 |
| 21 | 5.20 | 83.4 | −19.34 | 105.1 | 98.6 |
| 22 | 6.42 | UNC | 13.94 | 91.1 | 94.2 |
| 23 | 6.50 | 241.8 | −24.92 | 90.3 | 90.8 |
| 24 | 4.88 | 119.7 | −18.49 | 94.0 | 98.4 |
| 25 | 6.56 | 139.2 | −18.68 | 40.8 | 88.6 |
| 26 | 6.33 | 727.0 | −94.01 | 40.9 | 101.1 |
| 27 | 4.50 | 267.6 | −19.20 | 7.9 | 105.9 |
| 28 | 5.70 | 99.6 | −15.30 | 46.2 | 92.8 |
| 29 | 5.48 | 821.0 | −19.98 | 70.8 | 87.8 |
| 30 | 5.95 | 186.4 | −20.84 | 86.9 | 91.9 |
| 31 | 4.80 | 155.0 | −20.80 | 78.7 | 95.7 |
| 32 | 5.05 | 517.0 | −23.85 | 103.1 | 99.0 |
Abbreviations: AR, absolute recovery; EE, entrapment efficiency; exp, experiment; PS, particle size; UNC, uncertain; ζ, zeta potential.
Table 5.
Results of the dependent variables for the 22 factorial design
| Exp | pH | PS (nm) | ζ (mV) | AR (%) | EE (%) |
|---|---|---|---|---|---|
| 33 | 5.86 | 199,1 | −20.51 | 101.3 | 90.5 |
| 34 | 5.44 | 168.0 | −17.35 | 102.7 | 101.0 |
| 35 | 5.50 | 342.0 | −22.19 | 82.7 | 94.2 |
| 36 | 5.69 | 640.0 | −64.23 | 81.2 | 90.8 |
Abbreviations: AR, absolute recovery; EE, entrapment efficiency; exp, experiment; PS, particle size; ζ, zeta potential.
The reproduction ability of the nanoprecipitation technique was evaluated by preparing six samples: three identical nanospheres (experiment eight, Table 1) and another three identical nanocapsules (experiment six, Table 1). The dispersion of data was expressed by calculating RSD. The values of RSD to pH, particle size, zeta potential, Triac absolute recovery, and Triac entrapment efficiency in the nanospheres were lower than 3.94%, 7.61%, 4.77%, 2.49%, and 3.87%, respectively; and in nanocapsules they were lower than 2.66%, 8.02%, 4.35%, 3.15%, and 3.64%, respectively. As a result of these data, the experimental variations among the formulations were considered to be existent when the calculated contrasts were higher than the random dispersion. These data depict a satisfactory repeatability of the nanoparticle process.
A technique of the fractional factorial design 211–6, to two-level factorial design, offers the possibility of investigating eleven independent variables. The fixed variables, which are described in Table 1, were defined prior to literature review13,18 and experimental compatibility evaluation for Triac. The dependent variables utilized to investigate the colloidal dispersion were pH, particle size, polydispersity index, and zeta potential. On the other hand, the dependent variables – absolute recovery and encapsulation efficiency – were applied in the stability and kinetic release studies (Table 4).
The contrasts of each variable and their interactions were calculated according to the following equation: contrast variable where and are the average of pH, particle size, zeta potential, absolute recovery, and encapsulation efficiency at the higher (coded as +1) and lower (coded as −1) levels, respectively. In an analysis for a fractioned factorial design, the values of the calculated contrasts are confused among the effects. In the performed experiments in this work, the contrast one, for example, is a confusion of the effect one between the third-order and sixth-order interactions.
Analyzing the data of the fractional factorial design 211–6, it was observed that the pH value is directly related to the formulation compounds. The presence of oil is a factor that might affect the outcome of the assay. The pH values ranged from 4.31–6.56. In due course, through calculation of the contrasts, it was possible to observe that this primary independent (oil quantity) factor decreased pH by 12%. However, the calculation of the contrast for two combined variables (second-order interactions) – quantity of Triac and oil and quantity of polymer and oil – showed that the pH value increased to higher levels of 12% and 9.3%, respectively. In average values, there was no difference between nanospheres (nanoparticle without oil) and nanocapsules. These effects confirm the adsorption of Triac and polymer onto vesicles instantly formed by oil.
As soon as the undesirable values of particle size greater than 500 nm were excluded, nanospheres and nanocapsules with average particle size of 159.6 nm and 285.6 nm, respectively, were obtained. Particle size in nanospheres and nanocapsules ranged from 83.4–269.7 and 169.8–367.0 nm, respectively. These results are in accordance with previous work that applied the nanoprecipitation technique.13,18 Particle size can have important consequences in pharmaceutical applications for nanoparticles loaded with Triac. In this case, the selection between nanocapsules or nanospheres might occur through the stability or solubility of Triac and through the membranes which the nanoparticles need to cross. The particle size in nanocapsules is limited by the size of the drops which are immediately created (oil core) when the organic phase is transferred into the aqueous phase. The oil core is controlled by the flow through which the organic phase is poured into aqueous solution, as well as the magnetic stirring and viscosity of the aqueous phase. Under the same conditions, nanocapsules will always have a higher particle size than nanospheres. Regarding the size of nanoparticles, not only is their average size (nm) important, but also their size variability (polydispersity index). The four best formulations (experiments six, eight, 20, and 24; Table 4) obtained a polydispersity index lower than 0.200. Values of polydispersity index lower than 0.200 describe good-to-average distribution, taking into account that the colloidal suspension is considered to be a homogenic suspension. They help to keep the stability of colloidal dispersion without the formation of microparticles or precipitates. The best colloidal suspensions didn’t precipitate even after 4 months. This narrow particle size distribution circumvents creation of the Triac concentration gradient between small and large nanoparticles which could lead to Triac crystallization onto large particles, ie, crystal growth known as Ostwald ripening.21 The SEM images show a relatively homogenous system, which is consistent with the observed polydispersity index (Figure 1). The morphological analysis for the best selected formulations through SEM revealed the formation of spherical particles which showed regular surface and form, homogeneity, and lower dispersion in their sizes.
Among the several factors investigated, the quantity of polymer, oil, and Span 60 were the most important factors regarding the particle size of nanoparticles. They increased the particle size up to 24.0%, 31.4%, and 31.0%, respectively. Naturally, these results refer to a widening of the polymeric shell, the presence of a core vesicle (oil), and the interaction/dissolution of Span 60 into the oily core. Increase in polymer concentration led to an increase in viscosity of the organic phase, thereby reducing the net shear stress and promoting the formation of droplets with larger size. In addition, the increasing viscosity could hinder rapid dispersion of polymer solution into the aqueous phase, resulting in larger droplets which formed larger nanoparticles after the elimination of the organic solvent.22 Tween 80 increases particle size by up to 13%. After the removal of the organic solvent, more Tween 80 molecules can be physically incorporated onto the nanoparticle surface.21 All contrast combinations that showed significant variation in particle size were related to these three variables. Nanocapsules from isodecyl oleate and PMMA were smaller than nanocapsules from neem oil and PCL.
The electrostatic potential (zeta potential) is related to the surface charge of the nanoparticles. Nanoparticles with a zeta potential between +10 mV and −10 mV are considered approximately neutral. On the other hand nanoparticles with a zeta potential higher than +30 mV or lower than −30 mV are considered to be very stable in the dispersion medium. This variable depicted an average value of −21 mV Their values ranged from 15.9–42.6 mV (except for experiment 26 which was excluded). Triac and both tensoactives, Span 60 and Tween 80, caused the main effect on zeta potential. Triac and Span 60 decreased zeta potential. On the other hand Tween 80 increased it. Tween 80, an amphiphilic nonionic stabilizer, may cause steric stabilization which is dominated by the solvation effect.
The average absolute recovery was 74.9%, with a range of 7.9% to approximately 100%. The main independent variables which had effect on absolute recovery were isodecyl oleate, PMMA, and the quantity of water, which increased absolute recovery by up to 28.6%, 12.1%, and 18.8%, respectively. The combination of several variables (analysis of the contrast values in different orders) did not show significant results for absolute recovery. When the amount of polymer and oil were at a high level, the interaction or affinity of Triac probably increased which lead to a higher absolute recovery and entrapment efficiency. The velocity at which the organic phase was transferred into the aqueous phase decreased absolute recovery by 18.2%. Due to low Triac water solubility, higher entrapment efficiencies were obtained in this study. The entrapment efficiency for all formulations was higher than 84% and the average value was 96.6%. The concentration of Triac did not influence this variable. When both Triac and the quantity of oil were at a higher level, they caused an increase of 13.8% in encapsulation efficiency. The encapsulation efficiency was favored by the lipophilic feature of Triac, which prefers the oily core and polymeric interaction instead of the aqueous medium.
Through the 211–6 fractional factorial design, it was possible to define both the better independent variables and formulations. The best levels were: PMMA, isodecyl oleate, 10% velocity of transference of the organic phase, 250-μg quantity of Triac, 62.5-mg quantity of Span 60, 187.5-mg quantity of Tween 80, and 130-mL volume of water. These results can be observed in experiments six, eight, 22, and 24 (Table 4), which depicted the best dependent variables. In due course, a new 22 factorial design was analyzed which aimed to search for better information on both polymer and isodecyl oleate quantities as well as study the release kinetics. In this experiment, the velocity of magnetic stirring was fixed at 300 rpm; the velocity of transference of the organic phase into the aqueous phase was 10% of the pump capacity; the quantity of Triac, Span 60, and Tween 80 was 1.0, 62.5 and 187.5 mg, respectively; and the volume of the solvent and the water was 25 mL and 130 mL, respectively. In this 22 factorial design, the independent variables were the quantities of PMMA and isodecyl oleate. The results of the dependent variables are depicted in Table 5.
In the 22 factorial design, it was possible to observe that the quantity of polymer and oil were the main factors to have an effect on particle size and zeta potential. Both increase the particle size significantly through individual or combined effects at a higher level. Nanocapsules showed values of particle size and zeta potential (in module) higher than those in nanospheres. Higher zeta potential is necessary for colloidal stability. However, smaller particle size might be favorable for penetrability. On the other hand, no difference was observed in either the pH or in the entrapment efficiency for both nanocapsules and nanospheres loaded with Triac. The quantity of oil is an individual variable that decreases the absolute recovery. It is possible that an irreversible reaction occurs between Triac and oil. However, when the quantity of oil and polymer are at a higher level, no effects were observed in absolute recovery. Therefore, experiment 34 may be considered the best one.
Release kinetics
In these experiments, the release assays provided for all formulations of the 22 factorial design were carried out in simulated fluid conditions in PBS medium at 35°C, which was kept under magnetic stirring with continuous stream. The continuous stream system avoids saturation on the system.51 In this assay, Triac passes through the pores of the membrane while the nanoparticles do not, hence allowing observation of the diffusion of Triac. The PBS buffer and controlled temperature were selected in order to imitate the human biological system. During the assay, aliquots were collected at predetermined times and Triac was quantified by HPLC. The results were expressed in terms of the percentage release (Figure 4). The release profile shows that the percentage of Triac, which was released at the first sampling time of 1 hour, in formulations 33, 34, 35, and 36 was 60.2%, 36.5%, 39.0%, and 41.6%, respectively. These four formulations depicted a fast release kinetic during the first hour. This probably occurs through fast migration of the Triac adsorbed on the polymeric nanoparticle surface or positioned in the superficial polymeric layer.24 After the first hour, formulations 34, 35, and 36 showed constant and slow release rate and the total percentage of release after 10 hours was 52.8%, 53.8%, and 52.7%, respectively. Only formulation 33 depicted 100% release after 10 hours. Mousa et al and Yalcin et al described the preparation of nanoparticles of the poly(lactic-co-glycolic acid) loaded with thyroid hormone, but did not show results for the release kinetic mechanism.25,26
Figure 4.
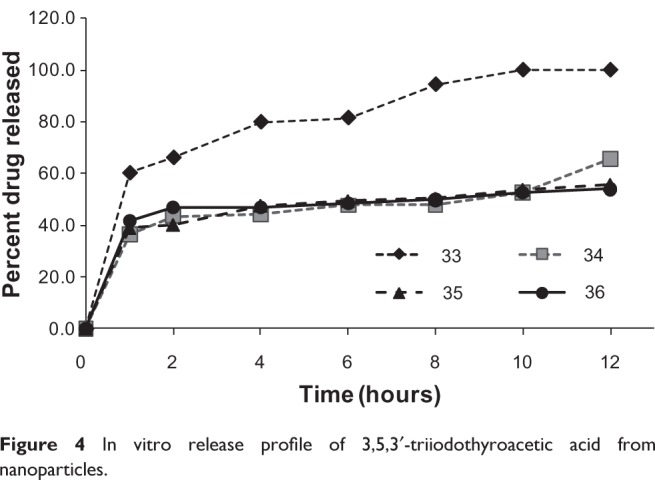
In vitro release profile of 3,5,3′-triiodothyroacetic acid from nanoparticles.
The nanospheres formulated at high PMMA level showed a similar mechanism and release rate as the nanocapsules prepared using isodecyl oleate. The presence of a higher quantity of polymer and/or oil may increase the length of diffusional pathways of the Triac loaded in the nanoparticles towards the aqueous phase. Furthermore, the existence of an interaction between the compound and the polymer of the nanoparticles may be suggested.52 As a result, there may be a reduction on the release rate.
Mathematical modeling (zero order, first order, and biexponential) was applied to obtain information about the kinetics of Triac dissolution and release behavior. After adjusting these models, the best profile was selected based on the highest r2. According to these criteria, biexponential (second order) was the best model to describe the dissolution and release profiles for nanoencapsulated Triac in formulations 34, 35, and 36. For formulation 33, the best model was monoexponential (first order). In these cases, the biexponential model may originate from an interaction between Triac and other formulation compounds such as polymer and/or oil quantity. On the other hand, the monoexponential model is only affected by Triac concentration. The monoexponential model was observed in the formulation which did not contain oil but had a tested lower polymeric level. The variation between these two models proposes ways to control both the release rate and Triac concentration in the human biological system.
Conclusion
In the present study, the preparation and characterization of nanospheres and nanocapsules loaded with Triac aimed at a new approach for formulation and release kinetics. For simultaneous analysis of the influence of different contrasts and factors on the properties of the nanoparticles and to find optimum formulations, the formulation was optimized by using two factorial experimental designs. The influence of the kind and quantity of polymer and oil on drug loading was demonstrated. The optimum formulation with the highest Triac loading was achieved by using PMMA. There was no difference between nanocapsule and nanosphere loading or absolute recovery amount in the best formulations. The HPLC method developed and validated was satisfactory in analyzing the absolute recovery and entrapment efficiency. A colloidal suspension containing up to 20 μg mL−1 (32.2 μM) of Triac was able to be prepared. For different formulations, variable release rates were identified in a normal leaching study in PBS buffer.
Acknowledgments
The authors are grateful to Conselho Nacional de Desenvolvimento Cientifico e Tecnologico (CNPq) and to Fundacao de Amparo a Pesquisa do Estado de Sao Paulo (FAPESP) for financial support.
Footnotes
Disclosure
The authors report no conflicts of interest in this work.
References
- 1.Koury EJ, Pawlyk AC, Berrodin TJ, Smolenski CL, Nagpal S, Deecher DC. Characterization of ligands for thyroid receptor subtypes and their interactions with co-regulators. Steroids. 2009;74(2):270–276. doi: 10.1016/j.steroids.2008.11.014. [DOI] [PubMed] [Google Scholar]
- 2.Wu SY, Green WL, Huang WS, Hays MT, Chopra IJ. Alternate pathways of thyroid hormone metabolism. Thyroid. 2005;15(8):943–958. doi: 10.1089/thy.2005.15.943. [DOI] [PubMed] [Google Scholar]
- 3.Messier N, Laflamme L, Hamann G, Langlois MF. In vitro effect of Triac on resistance to thyroid hormone receptor mutants: potential basis for therapy. Mol Cell Endocrinol. 2001;174(1–2):59–69. doi: 10.1016/s0303-7207(00)00446-9. [DOI] [PubMed] [Google Scholar]
- 4.Collingwood TN, Adams M, Tone Y, Chatterjee VK. Spectrum of transcriptional, dimerization, and dominant negative properties of twenty different mutant thyroid hormone beta-receptors in thyroid hormone resistance syndrome. Mol Endocrinol. 1994;8(9):1262–1277. doi: 10.1210/mend.8.9.7838159. [DOI] [PubMed] [Google Scholar]
- 5.Messier N, Langlois MF. Triac regulation of transcription is T3receptor isoform – and response element – specific. Mol Cell Endocrinol. 2000;165(1–2):57–66. doi: 10.1016/s0303-7207(00)00266-5. [DOI] [PubMed] [Google Scholar]
- 6.Goslings B, Schwartz HL, Dillmann W, Surks MI, Oppenheimer JH. Comparison of the metabolism and distribution of L-triidothyronine triidothyroacetic acid in the rat: a possible explanation of differential hormonal potency. Endocrinology. 1976;98(3):666–675. doi: 10.1210/endo-98-3-666. [DOI] [PubMed] [Google Scholar]
- 7.Medina-Gomez G, Calvo RM, Obregon MJ. Thermogenic effect of triiodothyroacetic acid at low doses in rat adipose tissue without adverse side effects in the thyroid axis. Am J Physiol Endocrinol Metab. 2008;294(4):E688–E697. doi: 10.1152/ajpendo.00417.2007. [DOI] [PubMed] [Google Scholar]
- 8.Baxter JD, Dillmann WH, West BL, et al. Selective modulation of thyroid hormone receptor action. J Steroid Biochem Mol Biol. 2001;76(1–5):31–42. doi: 10.1016/s0960-0760(01)00052-8. [DOI] [PubMed] [Google Scholar]
- 9.Elvira C, Fanovich A, Fernandez M, Fraile J, San Roman J, Domingo C. Evaluation of drug delivery characteristics of microspheres of PMMA–PCL–cholesterol obtained by supercritical-CO2impregnation and by dissolution–evaporation techniques. J Control Release. 2004;99(2):231–240. doi: 10.1016/j.jconrel.2004.06.020. [DOI] [PubMed] [Google Scholar]
- 10.Pinto Reis C, Neufeld RJ, Ribeiro AJ, Veiga F. Nanoencapsulation II. Biomedical applications and current status of peptide and protein nanoparticulate delivery systems. Nanomedicine. 2006;2(2):53–65. doi: 10.1016/j.nano.2006.04.009. [DOI] [PubMed] [Google Scholar]
- 11.Pinto Reis C, Neufeld RJ, Ribeiro AJ, Veiga F. Nanoencapsulation I. Methods for preparation of drug-loaded polymeric nanoparticles. Nanomedicine. 2006;2(1):8–21. doi: 10.1016/j.nano.2005.12.003. [DOI] [PubMed] [Google Scholar]
- 12.Nimesh S, Manchanda R, Kumar R, et al. Preparation, characterization and in vitro drug release studies of novel polymeric nanoparticles. Int J Pharm. 2006;323(1–2):146–152. doi: 10.1016/j.ijpharm.2006.05.065. [DOI] [PubMed] [Google Scholar]
- 13.Fessi H, Puisieux F, Devissaguet JP, Ammoury N, Benita S. Nanocapsule formation by interfacial polymer deposition following solvent displacement. Int J Pharm. 1989;55(1):R1–R4. [Google Scholar]
- 14.Bruns RE, Scarminio IS, de Barros Neto B. Statistical Design – Chemometrics. Amsterdam: Elsevier; 2006. [Google Scholar]
- 15.International Conference on Harmonization Guidance for industry. Q2B validation of analytical procedures: methodology November1996Available from: http://www.fda.gov/downloads/Drugs/GuidanceComplianceRegulatoryInformation/Guidances/ucm073384.pdfAcessed March 22, 2012
- 16.Levy MY, Benita S. Drug release from submicronized o/w emulsion: a new in vitro kinetic evaluation model. Int J Pharm. 1990;66(1–3):29–37. [Google Scholar]
- 17.Almeida AJ, Souto E. Solid lipid nanoparticles as a drug delivery system for peptides and proteins. Adv Drug Deliv Rev. 2007;59(6):478–490. doi: 10.1016/j.addr.2007.04.007. [DOI] [PubMed] [Google Scholar]
- 18.Schaffazick SR, Pohlmann AR, Mezzalira G, Guterres SS. Development of nanocapsule suspensions and nanocapsule spray-dried powders containing melatonin. J Braz Chem Soc. 2006;17(3):562–569. [Google Scholar]
- 19.Quintanar-Guerrero D, Allemann E, Fessi H, Doelker E. Preparation techniques and mechanism of formation of biodegradable nanoparticles from preformed polymers. Drug Dev Ind Pharm. 1998;24((12)12):1113–1128. doi: 10.3109/03639049809108571. [DOI] [PubMed] [Google Scholar]
- 20.Hamidi M, Azadi A, Rafiei P. Hydrogel nanoparticles in drug delivery. Adv Drug Deliv Rev. 2008;60(15):1638–1649. doi: 10.1016/j.addr.2008.08.002. [DOI] [PubMed] [Google Scholar]
- 21.Wu L, Zhang J, Watanabe W. Physical and chemical stability of drug nanoparticles. Adv Drug Deliv. 2011;63(6):456–469. doi: 10.1016/j.addr.2011.02.001. [DOI] [PubMed] [Google Scholar]
- 22.Song X, Zhao Y, Wu W, et al. PLGA nanoparticles simultaneously loaded with vincristine sulfate and verapamil hydrochloride: systematic study of particle size and drug entrapment efficiency. Int J Pharm. 2008;350(1–2):320–329. doi: 10.1016/j.ijpharm.2007.08.034. [DOI] [PubMed] [Google Scholar]
- 23.Alsenz J, Kansy M. High throughput solubility measurement in drug discovery and development. Adv Drug Deliv Rev. 2007;59(7):546–567. doi: 10.1016/j.addr.2007.05.007. [DOI] [PubMed] [Google Scholar]
- 24.Teixeira M, Alonso MJ, Pinto MM, Barbosa CM. Development and characterization of PLGA nanospheres and nanocapsules containg xanthone and 3-methoxyxanthone. Eur J Pharm Biopharm. 2005;59(3):491–500. doi: 10.1016/j.ejpb.2004.09.002. [DOI] [PubMed] [Google Scholar]
- 25.Mousa SA, Yalcin M, Bharali DJ, et al. Tetraiodothyroacetic acid and its nanoformulation inhibit thyroid hormone stimulation of non-small cell lung cancer cells in vitro and its growth in xenografts. Lung Cancer. 2012;76(1):39–45. doi: 10.1016/j.lungcan.2011.10.003. [DOI] [PubMed] [Google Scholar]
- 26.Yalcin M, Bharali DJ, Dyskin E, et al. Tetraiodothyroacetic acid and tetraiodothyroacetic acid nanoparticle effectively inhibit the growth of human follicular thyroid cell carcinoma. Thyroid. 2010;20(3):281–286. doi: 10.1089/thy.2009.0249. [DOI] [PubMed] [Google Scholar]