

Abstract
Background
Recent studies have shown that personal best marathon time is a strong predictor of race time in male ultramarathoners. We aimed to determine variables predictive of marathon race time in recreational male marathoners by using the same characteristics of anthropometry and training as used for ultramarathoners.
Methods
Anthropometric and training characteristics of 126 recreational male marathoners were bivariately and multivariately related to marathon race times.
Results
After multivariate regression, running speed of the training units (β = −0.52, P < 0.0001) and percent body fat (β = 0.27, P < 0.0001) were the two variables most strongly correlated with marathon race times. Marathon race time for recreational male runners may be estimated to some extent by using the following equation (r2 = 0.44): race time ( minutes) = 326.3 + 2.394 × (percent body fat, %) − 12.06 × (speed in training, km/hours). Running speed during training sessions correlated with prerace percent body fat (r = 0.33, P = 0.0002). The model including anthropometric and training variables explained 44% of the variance of marathon race times, whereas running speed during training sessions alone explained 40%. Thus, training speed was more predictive of marathon performance times than anthropometric characteristics.
Conclusion
The present results suggest that low body fat and running speed during training close to race pace (about 11 km/hour) are two key factors for a fast marathon race time in recreational male marathoner runners.
Keywords: body fat, skinfold thickness, anthropometry, endurance, athlete
Introduction
The number of recreational runners participating in major running events, particularly in world class city marathons such as those held in New York, Chicago, London, and Berlin, has increased considerably in recent years.12 Depending on the length and duration of a race, athletic performance seems to be influenced by physiological characteristics,37 specific anthropometric properties,8–21 and training variables,9,11,22–29 in addition to other characteristics, including age,1,30 gender,18,30 and nutrition.31
Successful marathon and half-marathon running requires regular training and an appropriate lifestyle in both elite and recreational runners.13,27,32–34 Frequency, intensity, and volume of training seem to be of great importance.10,11,13,20 Tanda described a strong correlation between training volume and intensity during an eight-week training period and marathon performance.25 Different training variables, such as the number of training units, kilometers completed during a training unit, maximum kilometers completed during a training unit, total time spent running during training, mean weekly running kilometers, maximal weekly running kilometers, and mean daily run kilometers were related to marathon race times.11,20,26 It has been shown that elite marathoners run more kilometers per week and at a higher velocity than recreational runners.34 With respect to shorter running distances, both the peak running velocity and the run speed during training units were highly related to race performance.27,35
Considering anthropometry as a predictive variable, the association of skinfolds with performance in running has been investigated intensively.21,27–29,32 Regarding race time in elite marathoners, several predictive anthropometric variables were identified, including the sum of skinfolds,8,32 skinfold thickness at the abdominal, front thigh and medial calf sites, and lower limb skinfold thickness.20,21
Regarding previous experience, recent studies have investigated potential predictive variables for ultramarathoners.14,16–18,29 Personal best marathon time and weekly training kilometers, but not anthropometric characteristics, have been described as predictors for recreational male ultrarunners, such as 100 km ultramarathoners16,18 and 24-hour ultramarathoners.14,17,29 The conclusion was that a fast running speed during training and a high training volume had to be achieved in order to achieve a fast race performance in ultrarunning.16–18
These findings suggested that training variables are of higher importance compared with anthropometric characteristics in running performance.16,18 Furthermore, it has been demonstrated that the personal marathon best time was a strong predictor variable for race performance in ultramarathoners.14,17 In this context, we intended investigating variables influencing the marathon performance in recreational athletes, when the same variables (ie, age, body height, body weight, skinfold measures, body mass index, body fat, skeletal muscle mass, years of active running, minimal, maximal and average weekly training hours and distance, and average speed during training) were included as have been used when investigating recreational ultramarathoners.14,16–18 We hypothesized that training duration and running speed during training, but not anthropometric measures, would determine marathon race time in recreational runners.
Materials and methods
The organizer of the marathon in Basel, Switzerland, invited all male participants in the races held in 2010 and 2011 using an electronically distributed newsletter, three months before the start of the marathon, to participate in the planned investigation. In order to increase the sample size, we collected data in two subsequent years. No criteria for inclusion or exclusion were applied. Anthropometric characteristics and training characteristics as independent variables were determined before the race and bivariately and multivariately correlated with marathon race times as the dependent variable.
Subjects
From a total of 691 starters, 126 white men were interested in participation in the study. The number of interested women was far too low to compare with men. Before the race, the participants were informed of the procedure and gave their informed written consent. The institutional review board of the Canton of St Gallen, Switzerland, approved the study. All interested athletes were subelite recreational athletes. We defined an elite athlete as a runner earning his living from trophy money and sponsorship. Among the study subjects, all participants completed the race distance of 42.195 km within 5.5 hours, which was the time limit set by the organizer. Two male runners finished within the top three finishers. The athletes started at 10:15 am and had to complete two laps. The weather was comparable in both years. In 2010, the temperature at the start was 17.5°C with a relative humidity of 88%. At 2 pm, the temperature rose to 23.9°C and relative humidity decreased to 60%. Wind speed was 1 m/sec at the start and increased to 2 m/sec by 2 pm. In 2011, the temperature was 16.9°C at the start with a relative humidity of 83%. At 2 pm, the temperature increased to 23.5°C and relative humidity was 66%. The wind speed was 1 m/sec at the start and remained unchanged at 1 m/sec by 2 pm. The organizer provided food and fluids at several aid stations.
Measurements and procedures
On the afternoon of the day before the races, body weight, body height, limb circumference, and skinfold thicknesses were determined. A Beurer® BF15 scale (Beurer GmbH, Ulm, Germany) was used to measure body mass to the nearest 0.1 kg. A stadiometer (Tanita HR 001 portable height measure, Tanita Europe, Amsterdam, The Netherlands) was used to measure body height to the nearest 0.01 m. Body mass index (kg/m2) was calculated using the body mass and body height of the athletes. The same investigator measured limb circumferences and all skinfold thicknesses on the right arm, torso, and leg. The skinfold thicknesses were measured using a skinfold caliper (GPM-Hautfaltenmessgerät, Siber and Hegner, Zurich, Switzerland). All skinfolds were measured to the nearest 0.2 mm. The skinfold caliper measures with a pressure of 0.1 MPa ± 5% over the whole measuring range. One trained investigator took all the anthropometric measurements. All measurements were taken three times and the mean was used for calculation. Skinfold thickness was measured after 4 seconds.36 A reliability check was conducted on 27 male runners.37 Intraclass correlation between the two investigators was excellent for all anatomical measurement sites and for various summary measurements of skinfold thickness. Agreement tended to be higher within than between investigators, and reached good reliability with an intraclass correlation of 0.99 (95% confidence interval 0.99–1.00) for the summary measurements of skinfold thickness between investigators. Intraclass correlation for investigator 1 versus investigator 1 and for investigator 2 versus investigator 2 for the single skinfold thicknesses was between 0.98 and 0.99, respectively. For the sum of seven and eight skinfolds, respectively, the intraclass correlation was 0.99–1.00. For the sum of eight skinfolds for investigator 1, bias (ie, average difference between investigator 1 and investigator 2) was −0.515 mm and the standard deviation of the average difference was 1.492 mm; 95% limits of agreement were between −3.439 mm and 2.409 mm. Limb circumferences were measured using a nonelastic tape measure (KaWe CE, Kirchner und Welhelm, Germany) to the nearest 0.1 cm. The circumference of the upper arm was measured at the mid-arm, the circumference of the thigh was taken at the mid-thigh, and the circumference of the calf was measured at the mid-calf. Body fat percentage was estimated using an anthropometric equation:
where Σ7SF is the sum of the skinfold thicknesses of pectoral, mid-axilla, triceps, subscapular, abdomen, suprailiac, and front thigh skinfolds.38
The predicted residual sum of squares (PRESS) r2 was high (0.90), and the PRESS standard error of estimates was excellent (2.2% at the mean) for the equation when applied to a sample of 160 men. Skeletal muscle mass was estimated using the following anthropometric equation:
where Ht is body height, CAG is skinfold-corrected upper arm girth, CTG is skinfold-corrected thigh girth, CCG is skinfold-corrected calf girth, gender = 1 for males; age in years; race = 0 for white males and 1 for black males.39 Limb circumferences (Climb ) were corrected for subcutaneous adipose tissue thickness. Skinfold caliper measurement (S) was assumed to be twice the subcutaneous adipose tissue thickness. The corrected muscle (including bone) circumferences (Cm) were calculated as Cm = Climb − π S. For dimensional consistency, corrected muscle circumferences were squared and multiplied by body height to obtain a three-dimensional skeletal muscle mass measurement.39 This anthropometric equation was validated using magnetic resonance imaging to determine skeletal muscle mass. There was a high correlation between the predicted skeletal muscle mass and skeletal muscle mass measured by magnetic resonance imaging (r2 = 0.83, P < 0.0001, standard error of estimates = 2.9 kg). The correlation between the measured and the predicted skeletal muscle mass difference and the measured skeletal muscle mass was highly significant (r2 = 0.90, P = 0.009).
From registration for the study to the start of the marathon, the athletes kept a training dairy recording all training units with distance and duration per unit. They also reported their number of years as an active runner.
Statistical analyses
The data are presented as the mean ± standard deviation. The Pearson correlation was used to investigate potential associations between characteristics of anthropometry, training, and previous performance. For the strength of a correlation, r > 0.70 indicated a very strong, r = 0.40 to 0.69 a strong, r = 0.30 to 0.39 a moderate, r = 0.20 to 0.29 a weak, and r = 0.01 to 0.19 a negligible relationship. The significance level was adjusted according to the Bonferroni procedure. To reduce the variables for multivariate regression analysis, bivariate correlation analysis between the variables of age and characteristics of anthropometry and training was performed. In a second step, all significant variables after bivariate analysis entered the multiple linear regression analysis (stepwise, forward selection, P of F for inclusion < 0.05, P of F for exclusion > 0.1). Multicollinearity between the predictor variables was excluded with r > 0.9. An alpha level of 0.05 was used to indicate statistical significance. Predictive variables were then used to create an equation to predict marathon race time from anthropometric and training characteristics. Intraclass correlation analysis was used to investigate the reliability of predicted marathon race times with effective marathon race times. Statistical analyses were performed using IBM SPSS Statistics (version 19, SPSS Inc, Chicago, IL).
Results
A total of 126 athletes finished the race within 231.9 ± 31.7 minutes, corresponding to a mean running speed of 11.1 ± 1.5 km/hour. Table 1 shows the anthropometric characteristics and their association with race time. Pectoral, abdominal, suprailiac, and front thigh skinfolds were moderately related to marathon race time, whereas mid-axillary and medial calf skinfolds were strongly related to race times. Also, the sum of eight skinfolds and percent body fat were strongly related to marathon race times.
Table 1.
Anthropometric variables and their relationship to marathon race times (n = 126)
| Parameter | Result | Pearson r | P |
|---|---|---|---|
| Age (years) | 42.8 ± 10.8 | 0.23 | |
| Body mass (kg) | 73.9 ± 8.1 | 0.24 | |
| Body stature (m) | 1.78 ± 0.06 | −0.01 | |
| Body mass index (kg/m2) | 23.4 ± 2.2 | 0.27 | |
| Length of leg (cm) | 85.5 ± 4.2 | −0.03 | |
| Circumference of upper arm (cm) | 29.2 ± 1.9 | 0.15 | |
| Circumference of thigh (cm) | 55.0 ± 2.6 | 0.22 | |
| Circumference of calf (cm) | 37.9 ± 2.3 | 0.18 | |
| Pectoral skinfold (mm) | 8.2 ± 3.0 | 0.35 | <0.0001 |
| Mid-axilla skinfold (mm) | 9.7 ± 2.9 | 0.40 | <0.0001 |
| Triceps skinfold (mm) | 7.9 ± 2.6 | 0.23 | |
| Subscapular skinfold (mm) | 10.5 ± 4.0 | 0.25 | |
| Abdominal skinfold (mm) | 15.4 ± 6.9 | 0.37 | <0.0001 |
| Suprailiac skinfold (mm) | 18.4 ± 7.1 | 0.31 | 0.0004 |
| Front thigh skinfold (mm) | 12.1 ± 4.9 | 0.34 | 0.0001 |
| Medial calf skinfold (mm) | 6.2 ± 2.4 | 0.41 | <0.0001 |
| Sum of eight skinfolds (mm) | 88.4 ± 26.2 | 0.42 | <0.0001 |
| Body fat percentage (%) | 16.3 ± 5.6 | 0.44 | <0.0001 |
| Skeletal muscle mass (kg) | 38.4 ± 3.3 | −0.02 |
Notes: Results are presented as the mean ± standard deviation. The P value is inserted in case of a significant association after Bonferroni correction (P < 0.0018 for 28 variables).
Table 2 summarizes the training variables and their relationship. The weekly running kilometers, maximal weekly running distance, and number of weekly training units were moderately related to marathon race times. Running speed during the training sessions was strongly associated with race times. Percent body fat and running speed during training was correlated in a highly significant manner (Figure 1).
Table 2.
Training variables and their relationship to marathon race times (n = 126)
| Measures | Result | Pearson r | P |
|---|---|---|---|
| Years as active runner | 10.5 ± 9.4 | −0.08 | |
| Weekly kilometers ran (km) | 44.7 ± 24.7 | −0.30 | 0.0007 |
| Minimal distance ran per week (km) | 22.8 ± 20.8 | −0.22 | |
| Maximal distance ran per week (km) | 63.3 ± 32.9 | −0.32 | 0.0003 |
| Hours ran per week | 4.8 ± 2.4 | −0.20 | |
| Number of training sessions per week | 3.7 ± 1.6 | −0.33 | 0.0002 |
| Distance per training session (km) | 14.2 ± 6.6 | −0.17 | |
| Duration of training sessions (min) | 72.5 ± 20.4 | 0.02 | |
| Running speed of the training sessions (km/hour) | 11.1 ± 1.4 | −0.61 | <0.0001 |
Notes: Results are presented as mean ± standard deviation. The P value is inserted in the event of a significant association after Bonferroni correction (P < 0.0018 for 28 variables).
Figure 1.
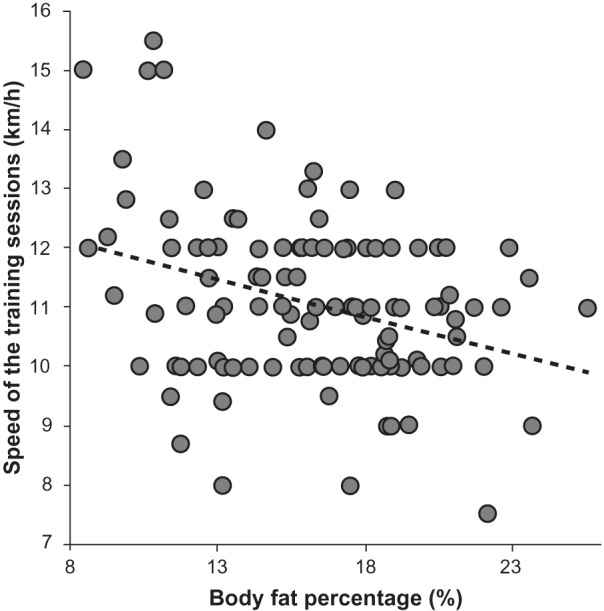
Running speed during training correlated significantly with body fat percentage (n = 126, r = 0.33, P = 0.0002).
Anthropometric variables which were significant after bivariate analysis were included in multivariate regression (Table 3), percent body fat was related to marathon race times. R2 of the model was 23%. The training variables which were significant after bivariate analysis were included in multivariate regression (Table 4), and running speed of the training units was associated with marathon race times. r2 of the model was 40%. When the significant variables of anthropometry and training were inserted in a multivariate regression (Table 5), percent body fat and running speed during training units were significantly associated with race times. r2 of the model was 44%. Race time for recreational male marathoners might be predicted using the equation (r2 = 0.44):
Table 3.
Associations between significant anthropometric characteristics after bivariate analysis and race time using multiple linear regression (n = 126); r = 0.481, r2 = 0.232, adjusted r2 = 0.186, standard error of estimate = 28.56, F(7) = 5.079, P < 0.0001
| Nonstandardized coefficients
|
Standardized coefficients
|
P | |||
|---|---|---|---|---|---|
| B | SE | β | t | ||
| Pectoral skinfold | −1.086 | 1.574 | −0.104 | −0.690 | 0.492 |
| Mid-axilla skinfold | 0.982 | 1.703 | 0.089 | 0.576 | 0.565 |
| Abdominal skinfold | −0.201 | 0.853 | −0.040 | −0.235 | 0.815 |
| Suprailiac skinfold | −0.891 | 0.654 | −0.200 | −1.362 | 0.176 |
| Front thigh skinfold | −0.071 | 0.863 | −0.011 | −0.082 | 0.935 |
| Medial calf skinfold | 2.955 | 1.712 | 0.223 | 1.726 | 0.087 |
| Body fat percentage | 4.475 | 30.13 | 0.504 | 1.485 | 0.014 |
Table 4.
Associations between significant training characteristics after bivariate analysis and race time using multiple linear regression (n = 126); r = 0.635, r2 = 0.403, adjusted r2 = 0.384, standard error of estimate = 24.86, F(4) = 20.44, P < 0.0001
| Nonstandardized coefficients
|
Standardized coefficients
|
P | |||
|---|---|---|---|---|---|
| B | SE | β | t | ||
| Weekly kilometers ran | −0.134 | 0.149 | −0.104 | −0.894 | 0.373 |
| Maximal distance ran per week | 0.082 | 0.115 | 0.085 | 0.712 | 0.478 |
| Number of weekly training sessions | −3.080 | 1.879 | −0.156 | −1.640 | 0.104 |
| Running speed of training sessions | −13.181 | 1.773 | −0.570 | −7.436 | <0.0001 |
Table 5.
Multivariate analysis of significant variables of both anthropometry and training (n = 126); r = 0.661, r2 = 0.437, adjusted r2 = 0.428, standard error of estimate = 23.94, F(2) = 47.76, P < 0.0001
| Nonstandardized coefficients
|
Standardized coefficients
|
P | |||
|---|---|---|---|---|---|
| B | SE | β | t | ||
| Body fat percentage | 2.394 | 0.635 | 0.270 | 3.769 | <0.0001 |
| Speed of the training sessions | −12.061 | 1.655 | −0.522 | −7.286 | <0.0001 |
Predicted race time using this equation was 231.9 ± 20.9 minutes and was associated with effective race time in a highly significant manner (Figure 2). The level of agreement using the Bland-Altman method (bias −46.5 ± 46.5 minutes) between the effective and predicted race time is shown in Figure 3. The intraclass correlation between predicted and effective marathon race time was 0.75.
Figure 2.
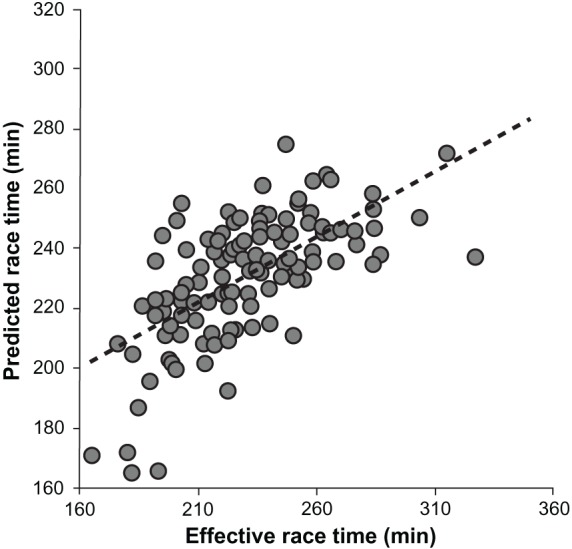
Predicted marathon race time correlated significantly with effective race time (n = 126, r = 0.66, P < 0.0001).
Figure 3.
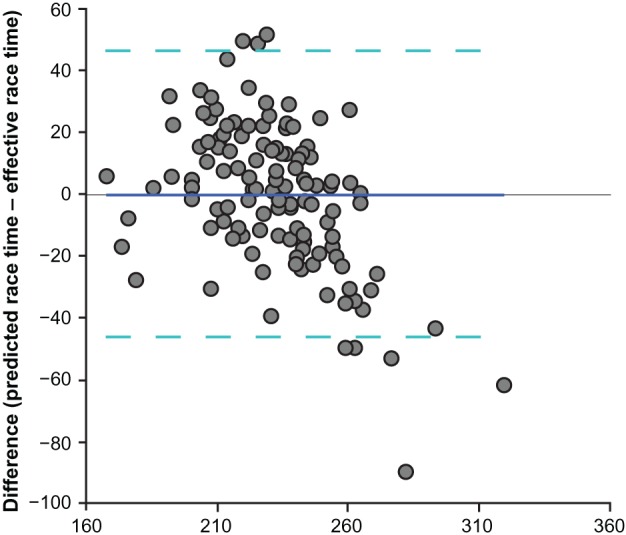
Bland-Altman plots comparing predicted with effective race time.
Discussion
We intended to investigate which training and/or anthropometric variables best determine marathon race time in recreational male marathoners. We hypothesized that training duration and running speed during training units, but not anthropometric characteristics, would determine marathon performance. The most important finding of this study was that running speed during training sessions and body fat percentage remained significantly correlated with marathon race times after multivariate analysis. Both these variables correlated significantly and negatively with each other.
The multivariate model including training variables explained 40% of the variance in marathon race times. Additional inclusion of anthropometric variables increased the percentage of the variance explaining marathon race times to only 44%. These findings corroborate the results found in recreational male half-marathoners where body mass index in addition to running speed during training units, not percent body fat, was related to half-marathon race times.27 This suggests that other factors, such as physiological characteristics (eg, maximum oxygen uptake), nutrition, genetics, and lifestyle, may have an additional influence on performance in both marathoners and half-marathoners.13,27,40,41 The marathon race time in recreational male marathoners can be predicted by only two variables (ie, body fat percentage and running speed during training sessions), and the predicted marathon race times using the equation correlated strongly (r = 0.66, P < 0.0001) with the effective marathon race times. This equation needs to be validated in a separate set of subjects and may only be applicable for a similar study population of the same age, gender, training, and years of experience.
Anthropometric characteristics and association with race time
Percent body fat was the only variable predictive of all the anthropometric characteristics when corrected with all anthropometric covariates. Low amounts of body fat (13%–17%) seem to be advantageous for fast race times in runners.15,16,18,27 Bale et al9,10 described in elite marathon runners a low percentage of body fat and Hetland et al42 demonstrated that regional and total body fat correlated inversely with performance in an incremental treadmill test in long-distance runners. Eston et al confirmed that lower body skinfolds were highly correlated with percent body fat in fit and healthy young men.43 In runners, excess adipose tissue usually requires greater muscular effort to accelerate the legs and, in theory, the energy expenditure at the same velocity is higher.
In contrast with earlier reports, lower limb skinfold thickness was not a predictive variable in our sample of recreational male marathon runners. Furthermore, body mass index was not significantly related to marathon race times. Our data suggest that percent body fat, not body mass index, is relevant to predict race time in marathoners. This finding is in contrast with that of Hoffman and Fogard12 for 161 km ultramarathoners and Rüst et al27 for half-marathoners in whom body mass index was predictive of race performance times.
Relationship between training variables and race time
Another important finding was that running speed during training units was associated with marathon race times after bivariate analysis. This finding corroborated that of Rüst et al for recreational half-marathoners.27 Generally, running speed during training is an important predictive variable for running performances depending upon the running distance. Peak speed in running training was significantly associated with 5 km run times in male and female runners.7 However, for ultramarathon distances, the volume in training seems to be of higher importance. In very long distance races, such as in 24-hour ultrarunning, the longest duration and distance in single training sessions have been shown to be relevant for race performance.17
In contrast with the findings of Tanda, we could not confirm the findings describing an equation based on training duration and training speed.25 The differences between the results reported by Tanda and our findings may be partly explained by the longer period of the training diary used in our study, the difference in weekly running kilometers, greater variability in marathon race time, and the larger sample. In the study reported by Tanda, subjects provided their daily exercise records during their premarathon training, typically over a three-month period, including the distance and time run for each workout.25 In both our study and that by Tanda,25 duration and training speed were self-reported. The difference in the findings is not due to recording or reporting of training data.
According to Billat et al, top-class marathon runners train for more total kilometers per week and at a higher velocity than runners at a lower level.34 The different results reported with respect to training volume compared with our investigation may be explained by the development in training of recreational runners within the last decade. Yeung et al reported for marathoners that the longest mileage covered per training session was the best predictor for successful completion of a marathon.26 However, this does not contradict our findings, because in our sample all competitors successfully finished the race.
Study limitations
From a methodological point of view, a cross-sectional study is limited with respect to conclusions concerning causal relationships. Race performance may be influenced by other issues, such as physiological characteristics, aerobic capacity, and genetics.3,5–8,19,23,31 A limitation of this study was that no physiological parameters were measured to determine the intensity of training sessions, such as percentage of maximum heart rate or percentage of maximum oxygen uptake. Therefore, it is possible that faster runners simply trained and raced at a faster pace, but may actually have done so at an intensity similar to that of someone who is simply slower. Self-reporting of times and distances in training is a limitation because we have no way of establishing the reliability and precision of such reporting. For future research, the reliability of training data might be enhanced by quantifying and validating self-reported training data by use of a global positioning system.
Conclusion
In summary, among training and anthropometric variables, percent body fat (r2 = 0.23) and speed during training sessions (r2 = 0.40) were associated with marathon performance times in recreational male marathoners. This finding supports the hypothesis that both anthropometric measures and training quality influence marathon performance times and can be reliably explained by a simple equation. Nevertheless, speed during training sessions was shown to be of higher relevance (r2 = 0.40), where percent body fat explained only 4% of variance when included in the multivariate model (r2 = 0.44). Low body fat alone may not be sufficient to achieve a fast marathon race time. A recreational male marathoner aiming to achieve a fast marathon race time needs to run during training at a speed close to that of the race (about 11 km/hour).
Footnotes
Disclosure
The authors report no conflicts of interest in this work.
References
- 1.Lepers R, Cattagni T. Do older athletes reach limits in their performance during marathon running? Age (Dordr) 2012;34:773–781. doi: 10.1007/s11357-011-9271-z. [DOI] [PMC free article] [PubMed] [Google Scholar]
- 2.Rapaport BI. Metabolic factors limiting performance in marathon runners. PLoS Comput Biol. 2010;21:e1000960. doi: 10.1371/journal.pcbi.1000960. [DOI] [PMC free article] [PubMed] [Google Scholar]
- 3.Emmet J.The physiology of marathon running: just what does running a marathon do to your body? Available at: http://www.marathonandbeyond.com/choices/emmett.htmAccessed June 11, 2012
- 4.Faude O, Kindermann W, Meyer T. Lactate threshold concepts: how valid are they? Sports Med. 2009;39:469–480. doi: 10.2165/00007256-200939060-00003. [DOI] [PubMed] [Google Scholar]
- 5.Hausswirth C, Le Meur Y. Physiological and nutritional aspects of post-exercise recovery: specific recommendations for female athletes. Sports Med. 2011;41:861–882. doi: 10.2165/11593180-000000000-00000. [DOI] [PubMed] [Google Scholar]
- 6.Joyner MJ, Coyle EF. Endurance exercise performance: the physiology of champions. J Physiol. 2008;586:35–44. doi: 10.1113/jphysiol.2007.143834. [DOI] [PMC free article] [PubMed] [Google Scholar]
- 7.Sjödin B, Svedenhag J. Applied physiology of marathon running. Sports Med. 1985;2:83–99. doi: 10.2165/00007256-198502020-00002. [DOI] [PubMed] [Google Scholar]
- 8.Arrese LA, Izquierdo DM, Serveto Galindo JR. Physiological measures associated with marathon running performance in high-level male and female homogeneous groups. Int J Sports Med. 2005;27:289–295. doi: 10.1055/s-2005-865628. [DOI] [PubMed] [Google Scholar]
- 9.Bale P, Rowell S, Colley E. Anthropometric and training characteristics of female marathon runners as determinants of distance running performance. J Sports Sci. 1985;3:115–126. doi: 10.1080/02640418508729741. [DOI] [PubMed] [Google Scholar]
- 10.Bale P, Bradbury D, Colley E. Anthropometric and training variables related to 10 km running performance. Br J Sports Med. 1986;20:170–173. doi: 10.1136/bjsm.20.4.170. [DOI] [PMC free article] [PubMed] [Google Scholar]
- 11.Hagan RD, Upton SJ, Duncan JJ, Gettman MS, Gettman LR. Marathon performance in relation to maximal aerobic power and training indices in female distance runners. Br J Sports Med. 1987;21:3–7. doi: 10.1136/bjsm.21.1.3. [DOI] [PMC free article] [PubMed] [Google Scholar]
- 12.Hoffman MD, Fogard K. Factors related to successful completion of a 161-km ultramarathon. Int J Sports Physiol Perform. 2011;6:25–37. doi: 10.1123/ijspp.6.1.25. [DOI] [PubMed] [Google Scholar]
- 13.Knechtle B, Knechtle P, Barandun U, Rosemann T, Lepers R. Predictor variables for half marathon race time in recreational female runners. Clinics (Sao Paulo) 2011;66:287–291. doi: 10.1590/S1807-59322011000200018. [DOI] [PMC free article] [PubMed] [Google Scholar]
- 14.Knechtle B, Wirth A, Knechtle P, Zimmermann K, Kohler G. Personal best marathon performance is associated with performance in a 24-h run and not anthropometry or training volume. Br J Sports Med. 2009;43:836–839. doi: 10.1136/bjsm.2007.045716. [DOI] [PubMed] [Google Scholar]
- 15.Knechtle B, Knechtle P, Rosemann T. Race performance in male mountain ultra-marathoners: anthropometry or training? Percept Mot Skills. 2010;110:721–735. doi: 10.2466/PMS.110.3.721-735. [DOI] [PubMed] [Google Scholar]
- 16.Knechtle B, Wirth A, Knechtle P, Rosemann T. Training volume and personal best time in marathon, not anthropometric parameters are associated with performance in male 100-km ultrarunners. J Strength Cond Res. 2010;24:604–609. doi: 10.1519/JSC.0b013e3181c7b406. [DOI] [PubMed] [Google Scholar]
- 17.Knechtle B, Knechtle P, Rosemann T, Lepers R. Personal best marathon time and longest training run, not anthropometry, predict performance in recreational 24-hour ultrarunners. J Strength Cond Res. 2011;25:2212–2218. doi: 10.1519/JSC.0b013e3181f6b0c7. [DOI] [PubMed] [Google Scholar]
- 18.Knechtle B, Knechtle P, Rosemann T, Senn O. What is associated with race performance in male 100-km ultra-marathoners – anthropometry, training or marathon best time? J Sports Sci. 2011;29:571–577. doi: 10.1080/02640414.2010.541272. [DOI] [PubMed] [Google Scholar]
- 19.Morgan DW, Martin PE, Krahenbuhl GS. Factors affecting running economy. Sports Med. 1989;7:310–330. doi: 10.2165/00007256-198907050-00003. [DOI] [PubMed] [Google Scholar]
- 20.Hagan RD, Smith MG, Gettman LR. Marathon performance in relation to maximal aerobic power and training indices. Med Sci Sports Exerc. 1981;13:185–189. [PubMed] [Google Scholar]
- 21.Arrese AL, Ostariz ES. Skin-fold thicknesses associated with distance running performance in highly trained runners. J Sports Sci. 2006;24:69–76. doi: 10.1080/02640410500127751. [DOI] [PubMed] [Google Scholar]
- 22.Knechtle B, Wirth A, Baumann B, Knechtle P, Rosemann T, Senn O. Differential correlation between anthropometry, training volume, and performance in male and female ironman triathletes. J Strength Cond Res. 2010;24:2785–2793. doi: 10.1519/JSC.0b013e3181c643b6. [DOI] [PubMed] [Google Scholar]
- 23.Pate RR, Macera CA, Bailey SP, Bartoli WP, Powell KE. Physiological, anthropometric, and training correlates of training economy. Med Sci Sports Exerc. 1992;24:1128–1133. [PubMed] [Google Scholar]
- 24.Slovic P. Empirical study of training and performance in the marathon. Res Q. 1977;48:769–777. [PubMed] [Google Scholar]
- 25.Tanda G. Prediction of marathon performance time on the basis of training indices. Journal of Human Sport and Exercise. 2011;6:511–520. [Google Scholar]
- 26.Yeung SS, Yeung EW, Wong TW. Marathon finishers and non-finishers characteristics: a preamble to success. J Sports Med Phys Fitness. 2001;41:170–176. [PubMed] [Google Scholar]
- 27.Rüst CA, Knechtle B, Knechtle P, Barandun U, Lepers R, Rosemann T. Predictor variables for a half marathon race time in recreational male runners. Open Access J Sports Med. 2011;2:1–7. doi: 10.2147/OAJSM.S23027. [DOI] [PMC free article] [PubMed] [Google Scholar]
- 28.Knechtle B, Knechtle P, Barandun U, Rosemann T. Anthropometric and training variables related to half-marathon running performance in recreational female runners. Phys Sportsmed. 2011;39:158–166. doi: 10.3810/psm.2011.05.1907. [DOI] [PubMed] [Google Scholar]
- 29.Knechtle B, Knechtle P, Rüst CA, Rosemann T. Leg skinfold thicknesses and race performance in male 24-hour ultra-marathoners. Proc (Bayl Univ Med Cent) 2011;24:110–114. doi: 10.1080/08998280.2011.11928696. [DOI] [PMC free article] [PubMed] [Google Scholar]
- 30.Knechtle B, Rüst CA, Rosemann T, Lepers R. Age-related changes in 100km ultra-marathon running performances. Age (Dordr) 2011 Jul 28; doi: 10.1007/s11357-011-9290-9. [DOI] [PMC free article] [PubMed] [Google Scholar]
- 31.Di Prampero PE, Atchou G, Brückner JC, Moia C. The energetics of endurance running. Eur J Appl Physiol. 1986;55:259–266. doi: 10.1007/BF02343797. [DOI] [PubMed] [Google Scholar]
- 32.Legaz A, Eston R. Changes in performance, skinfold thicknesses, and fat patterning after three years of intense athletic conditioning in high level runners. Br J Sports Med. 2005;39:851–856. doi: 10.1136/bjsm.2005.018960. [DOI] [PMC free article] [PubMed] [Google Scholar]
- 33.Leyk D, Erley O, Gorges W, et al. Performance, training and lifestyle parameters of marathon runners aged 20–80 years: results of the PACE-study. Int J Sports Med. 2009;30:360–365. doi: 10.1055/s-0028-1105935. [DOI] [PubMed] [Google Scholar]
- 34.Billat VL, Demarle A, Slawinski J, Paiva M, Koralsztein JP. Physical and training characteristics of top-class marathon runners. Med Sci Sports Exerc. 2001;33:2089–2097. doi: 10.1097/00005768-200112000-00018. [DOI] [PubMed] [Google Scholar]
- 35.Scott BK, Houmard JA. Peak performance velocity is highly related to distance running performance. Int J Sports Med. 1994;15:504–507. doi: 10.1055/s-2007-1021095. [DOI] [PubMed] [Google Scholar]
- 36.Becque MD, Katch VL, Moffatt RJ. Time course of skin-plus-fat compression in males and females. Hum Biol. 1986;58:33–42. [PubMed] [Google Scholar]
- 37.Knechtle B, Joleska I, Wirth A, Knechtle P, Rosemann T, Senn O. Intra- and inter-judge reliabilities in measuring the skin-fold thicknesses of ultra runners under field conditions. Percept Mot Skills. 2010;111:105–106. doi: 10.2466/03.05.PMS.111.4.105-106. [DOI] [PubMed] [Google Scholar]
- 38.Ball SD, Altena TS, Swan PD. Comparison of anthropometry to DXA: a new prediction equation for men. Eur J Clin Nutr. 2004;58:1525–1531. doi: 10.1038/sj.ejcn.1602003. [DOI] [PubMed] [Google Scholar]
- 39.Lee RC, Wang Z, Heo M, Ross R, Janssen I, Heymsfield SB. Total-body skeletal muscle mass: development and cross-validation of anthropometric prediction models. Am J Clin Nutr. 2000;72:796–803. doi: 10.1093/ajcn/72.3.796. [DOI] [PubMed] [Google Scholar]
- 40.Knechtle B, Knechtle P, Barandun U, Rosemann T. Anthropometric and training variables related to half-marathon running performance in recreational female runners. Phys Sportsmed. 2011;39:158–166. doi: 10.3810/psm.2011.05.1907. [DOI] [PubMed] [Google Scholar]
- 41.Knechtle B, Knechtle P, Rosemann T, Senn O. Sex differences in association of race performance, skin-fold thicknesses, and training variables for recreational half-marathon runners. Percept Mot Skills. 2010;111:653–668. doi: 10.2466/05.25.PMS.111.6.653-668. [DOI] [PubMed] [Google Scholar]
- 42.Hetland ML, Haarbo J, Christiansen C. Regional body composition determined by dual-energy x-ray absorptiometry. Relation to training, sex hormones, and serum lipids in male long-distance runners. Scand J Med Sci Sports. 1998;8:102–108. doi: 10.1111/j.1600-0838.1998.tb00176.x. [DOI] [PubMed] [Google Scholar]
- 43.Eston RG, Rowlands AV, Charlesworth S, Davies A, Hoppitt T. P rediction of DXA-determined whole body fat from skinfolds: importance of including skin folds from the thigh and calf in young, healthy men and women. Eur J Clin Nutr. 2005;59:695–702. doi: 10.1038/sj.ejcn.1602131. [DOI] [PubMed] [Google Scholar]