

Abstract
Background
Improvement in swimming performance involves the dynamic alignment of the body in liquid, technical skill, anthropometric characteristics of athletes, and the ability to develop propulsive force. The aim of this study was to assess the relationships between the propulsive force during swimming and arm muscle area (AMA) and propose an equation to estimate the propulsive force in young swimmers by measuring their AMA.
Methods
Study participants were 28 male swimmers (14 ± 1.28 years) registered in the Brazilian Federation of Aquatic Sports. Their AMA was estimated by anthropometry and skinfold measurement, and the propulsive force of their arm (PFA) was assessed by the tied swimming test. The Durbin-Watson (DW) test was used to verify residual independence between variables (PFA and AMA). A Pearson correlation investigated potential associations between the variables and then a linear regression analysis was established. The Bland-Altman method was used to compare the values found between PFA and propulsive force-estimated (PFE). A paired Student’s t-test was used to analyze the difference in PFE with and without the constant and the coefficient of variation (CV) to estimate the magnitude of a real change between these forces.
Results
There was a significant positive correlation between the variables AMA and PFA (r = 0.68, P < 0.001). The linear regression showed a value of R2 = 0.470. There were no significant differences when comparing PFA and PFE (95% confidence interval: −8.903 to 9.560 kgf). To verify if there was a correlation between these variables, a new linear regression analysis found a value of R2 = 0.668, which confirms an equivalence between PFA and PFE, as CV showed 4% of magnitude.
Conclusion
The results of this study suggest the existence of a relationship between levels of PFA and muscle mass, however, this relationship becomes more evident the longer the AMA, which allows the development of an equation to estimate the propulsive force of young swimmers.
Keywords: anthropometry, muscle strength, swimming
Introduction
The propulsive force generated by the swimmer is, in dynamic equilibrium conditions, proportional to the pulling force provided by the active fluid against the trajectory of body displacement.1 Thus, the resistance in water increases geometrically in proportion to the square of velocity, which means that if the speed of swimming is duplicated the drag offered by water will be quadrupled.2–4 Therefore, a greater ability to generate propulsive force seems to contribute effectively to a better displacement in water.
Initially, the quantification of the contribution of the propulsive force without any mechanical constraints that may cause change in the natural swimming technique was made based on indirect methods.1 These forces are estimated by applying the coefficients of resistance (CR) and hydrodynamic support (HS) obtained in laboratory studies, through analysis of three-dimensional images of underwater video.5 However, there are doubts about the reliability of the calculations of forces generated based on the proposed models and experimental procedures.6
Muscle strength is the degree of tension that can be raised by a specific muscle or muscle groups and is considered an important variable of physical health related to physical performance in different age groups.7 The generation of muscle strength is dependent on neural factors (number of active motor units, firing rate, coactivation of antagonistic muscles) and muscle mass involved characterized by an increased cross-sectional area.89 There is a high rate of activation and the recruitment of motor units is synchronized which means inactive motor units participate in the contraction process and generate significant increases in the levels of force during muscle contraction.
Some studies have demonstrated the existence of a relationship between power and speed and imply that high levels of power are transferred positively to the travel speed.10,11 In this sense, although the factors that influence the drag propulsion of the swimmer are known, the capacity to generate propulsive force from a larger area of muscle is not very clear yet. This is an important aspect, since it identifies the mechanisms involved in force production and thus helps to understand the interrelationship between muscle mass and capacity for strength in swimming.
This study formally tested the hypothesis that increased arm muscle area (AMA) increases the ability to generate propulsive force in the execution of the front crawl in young athletes. Thus, the purpose of this study was to investigate the relationship between the propulsive force from front crawl and AMA, and propose an equation to estimate the propulsive force in young swimmers.
Methodology
Sample
This study was conducted in Recife city in Pernambuco state, northeast Brazil. The sample size was estimated by G*Power software v. 3.0.10 (Franz Faul, University of Kiel, Kiel, Germany)12 given the following conditions: effect size, 0.54; minimum power, 0.95; and error of α = 0.05. Twenty-eight male swimming athletes (14 ± 1.28 years) registered at the Brazilian Federation of Aquatic Sports, who trained on average 2 hours per session, six times a week, were included in the study. None of the volunteers subjected to the measures and tests were excluded from the study. Each subject appeared at the laboratory accompanied by a researcher responsible for the following: (1) analysis and clarifications, (2) anthropometric measurements, and (3) evaluation of the propulsive force. Written consent was signed by the responsible person before the start of the collections. The acceptance by children and adolescents were requirements for participation in this research. This study was approved by the Ethics Committee on Human Research of the institution of affiliation of the authors and followed the rules established by the National Commission on Research and Ethics (NCRE), Resolution No 196/96 on research involving human CEP/UPE: 048/09. All the procedures adhered to the guidelines of the Declaration of Helsinki (www.wma.net/e/policy/b3.htm).
Instruments and procedures
Anthropometric variables
Height was measured to the nearest 1.0 cm using a portable stadiometer (Sanny, São Paulo, Brazil) with the participant’s head positioned in the Frankfurt horizontal plane. Body weight was measured to the nearest 0.1 kg with a digital scale (Filizola, São Paulo, Brazil). Both measurements were performed by following the procedures by Lukaski.13
The relaxed arm circumference was obtained by a single evaluator with a flexible tape measure with precision of 0.1 cm, according to the conventional techniques described by Callaway.14 A triceps skinfold (Lange, Santa Cruz, CA) was used to evaluate the fold of fat with a constant pressure of 10 g/mm2 and precision of 1 mm, and followed the recommendations described previously.15 The AMA was calculated from the equation proposed by Frisancho.16
where AMA is relaxed AMA, AC is arm circumference, TST is triceps skinfold thickness, and π = 3.1416.
Propulsive force of the arm (PFA)
To determine the propulsive force of the arm (PFA), the tied swimming test protocol proposed by Papoti et al was used.17 A cable of mild steel half an inch thick and 3 m long was attached to the waist of the swimmer, which in turn was connected to a dynamometer (Ergometer Globus, Codigné, Italy) that remained fixed to record the swimmer’s strength (Figure 1).
Figure 1.
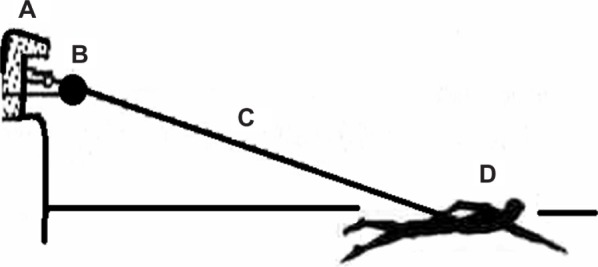
Schematic representation of the system used to determine the propulsive force of swimmer’s arms.
Abbreviations: A, starting block; B, dynamometer; C, mild steel wire; D, swimmer.
Procedures
The swimmer did not exercise during the 24 hours preceding the tests. This precaution was taken so that no acute effect resulting from the training sessions could influence the results. A 10-minute warm-up period of exercise subjectively determined by the swimmer as moderate intensity was performed before the beginning of the tests. After warming up, a pull buoy or leg float was placed between the legs of the swimmer to prevent him from performing movements with his lower limbs.17
The tied swimming test consisted of applying two maximal efforts in front crawl while tied to the measurement apparatus for a duration of 30 seconds. The beginning and end of the test were determined by an audible signal (whistle) and all participants were verbally encouraged to make maximum efforts at a maximum speed.17 Measurements for each athlete was obtained by employment of the dynamometer (Globus Ergometer, Codigné, Italy), comprising a load cell, hardware, and software. The load cell was a force transducer with a traction capacity of 300 kg.
Statistical procedures
The normality and homogeneity of variance were analyzed and the assumptions of parametric statistics were found (Shapiro– Wilk test). The Durbin–Watson (DW) test was used to verify residuals independence between variables (PFA and AMA). Pearson correlation was used to investigate potential associations between the variables and then a linear regression analysis was established. A systematic sample selection (ratio: 2) was used to validate the equation. In a second step, the Bland-Altman method was used to compare the values found between PFA and propulsive force-estimated (PFE), to obtain the equation proposed in this study. A paired Student’s t-test was used to analyze the difference in PFE with and without the constant and the coefficient of variation (CV = standard deviation/average × 100). Considering that this equation was first performed in each student between PFA and PFE, the general average of the CV was obtained, considering 10% as real magnitude.18 Statistical procedures were performed using GraphPad Prism 5 software (GraphPad, La Jolla, CA) and SPSS for Windows (version 10.0; IBM Armonk, NY), with significance set at 5% (P < 0.05).
Results
Descriptive information of the sample characteristics and the variables included in the development of the prediction equation of PFA are shown in Table 1.
Table 1.
Descriptive analysis of anthropometric parameters and propulsive force of arm (PFA)
| Mean ± SD | Min | Max | |
|---|---|---|---|
| Age (years) | 14.3 ± 1.2 | 13.0 | 17.0 |
| Body mass (kg) | 60.4 ± 13.0 | 40.3 | 96.7 |
| Height (cm) | 168.0 ± 10.2 | 144.6 | 183.2 |
| AC (cm) | 25.2 ± 2.9 | 19.5 | 31.0 |
| TS (mm) | 12.0 ± 4.7 | 5.0 | 21.5 |
| AMA (cm2) | 37.0 ± 8.6 | 24.7 | 58.2 |
| PFA (kgf) | 22.6 ± 8.1 | 9.5 | 39.1 |
Note: Results are presented as mean ± SD, minimum, and maximum.
Abbreviations: AC, arm circumference; AMA, arm muscle area; max, maximum; min, minimum; SD, standard deviation; TS, triceps skinfold; PFA, propulsive force of arm.
Development of the equation
Firstly, an exploratory data analysis was performed to identify possible inaccurate information, the presence of outliers, as well as to confirm normality (P = 0.390). Secondly, the independence of residuals was observed by DW statistic and it was found that the variables PFA and AMA were not interdependent (DW = 1.752; P < 0.001). Thus, a correlation analysis was performed to identify the linear relationship between PFA and AMA variables (Figure 2) and a significant positive correlation was observed (r = 0.68; P < 0.001).
Figure 2.
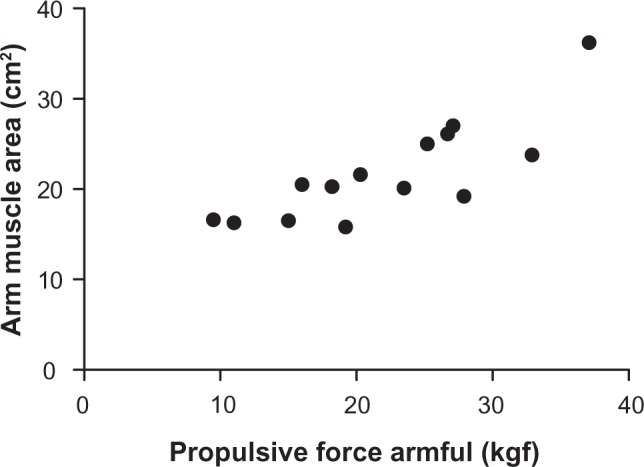
Correlation between the propulsive force arm and arm muscle area.
After the correlation test, a linear regression analysis was performed between the variables PFA and AMA, and a value of R2 = 0.470 (P < 0.001) was obtained. From these results, an equation based on the coefficients that were found was suggested (Table 2).
Table 2.
Unstandardized and standardized coefficients of the linear regression equation of the propulsive force estimated (PFE)
| Model | Coefficients
|
t | P | |||
|---|---|---|---|---|---|---|
| Unstandardized coefficients
|
Standardized coefficients
|
|||||
| B | Standard error | Beta | ||||
| 1 | (Constant) | −1.159 | 5.093 | −0.228 | 0.822 | |
| Area | 0.643 | 0.134 | 0.686 | 4.803 | 0.000 | |
| PFE = 0.643 × (muscle area) − 1.159 | ||||||
To validate the proposed equation, it was decided to do an analysis by performing a systematic selection of the sample (28 individuals) of ratio 2. Thus, 14 individuals were selected for systematic and random analysis, from the values found by the suggested equation (Table 3). The Bland–Altman analysis showed an agreement between the values obtained by both PFA and PFE methods (95% confidence interval [CI]: −8.903 to 9.560 kgf) (Figure 3).
Table 3.
Values of the propulsive force of arm (PFA) and propulsive force estimated (PFE)
| Athlete | PFA | PFE |
|---|---|---|
| 1 | 32.9 | 23.8 |
| 2 | 37.1 | 36.2 |
| 3 | 9.5 | 16.6 |
| 4 | 11.0 | 16.3 |
| 5 | 15.0 | 16.5 |
| 6 | 16.0 | 20.5 |
| 7 | 18.2 | 20.3 |
| 8 | 19.2 | 15.8 |
| 9 | 20.3 | 21.6 |
| 10 | 23.5 | 20.1 |
| 11 | 25.2 | 25.0 |
| 12 | 26.7 | 26.1 |
| 13 | 27.1 | 27.0 |
| 14 | 27.9 | 19.2 |
Figure 3.
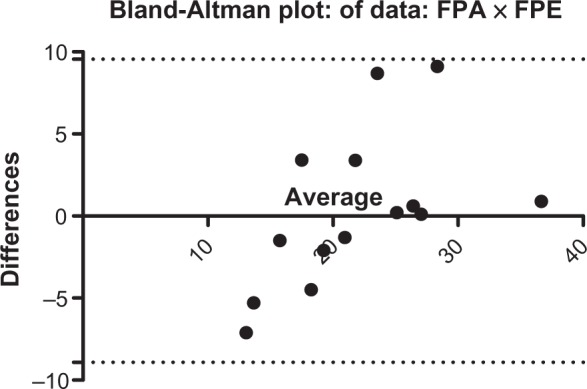
Bland–Altman plot between the propulsive force arm (PFA) and propulsive force estimated (FPE).
Finally, to verify the correlation between variables, a new linear regression analysis was performed, and a value of R2 = 0.668 (P < 0.001) was obtained, thus confirming that PFA and PFE are equivalent. Further analysis was conducted because the P value of the constant in equation was 0.822 (Table 4). By removing the equation constant (−1.159), and thus finding new predictive values for PFE and the real magnitude of the test through CV, a general average of 4% was obtained.
Table 4.
Real magnitude of the values between the propulsive force of the armful and propulsive force estimated (PFE) with and without the constant by coefficient of variation (CV)
| Athlete | Values PFE with the constant | Values PFE without the constant | CV (%) |
|---|---|---|---|
| 1 | 23.8 | 25.0 | 3 |
| 2 | 36.2 | 37.4 | 2 |
| 3 | 16.6 | 17.8 | 5 |
| 4 | 16.3 | 17.5 | 5 |
| 5 | 16.5 | 17.7 | 5 |
| 6 | 20.5 | 21.6 | 4 |
| 7 | 20.3 | 21.4 | 4 |
| 8 | 15.8 | 17.0 | 5 |
| 9 | 21.6 | 22.8 | 4 |
| 10 | 20.1 | 21.3 | 4 |
| 11 | 25.0 | 26.2 | 3 |
| 12 | 26.1 | 27.3 | 3 |
| 13 | 27.0 | 28.3 | 3 |
| 14 | 19.2 | 20.4 | 4 |
A new paired Student’s t-test was performed to compare the mean values between the results of PFE with and without the use of the constant, and there were no significant differences (P = 0.488). No differences were found between the results, which suggests that the equation is:
Discussion
The results of this study indicate the existence of a relationship between PFA and AMA, where the higher the AMA, the greater the PFA, thus enabling the formulation of an equation to estimate the propulsive force of swimmers.
Approximately 75% of total muscle mass is located in the region of the body segments (arms and thighs), therefore the estimated AMA is an important indicator of muscularity.19 The AMA was first proposed by Gurney and Jelliffe20 and presented by Frisancho16 and Forbes et al21 using the measures of arm girth and triceps skinfold thickness (corrected). The correction of the triceps skinfold thickness measure was performed to extract the effect of the subcutaneous fat layer. This method was compared with direct measurements obtained by magnetic resonance imaging, and a correlation (r = 0.97, P < 0.01) was found, which demonstrates the high precision of the method for estimating anthropometric AMA.22
Due to the change in strength training (eg, increased cross-sectional area of the entire muscle or muscle fibers alone), the AMA23,24 provides a performance improvement in swimming.25,26 Moreover, this propulsive efficiency can also be due to a better positioning of the hand, forearm, and arm in different stroke angles in the front crawl as observed by the fluid dynamics computer, associated with reverse engineering software.27–31 Thus, both the rotational movements as a better AMA angle are essential for an efficient implementation of swimming, mainly in moments that require muscle strength and power.5,17,32 A study of young swimmers by Papoti et al17 found that the ratio of the propulsive force and swimming speed showed a high correlation (r = 0.86, P < 0.05), demonstrating that the higher the propulsive force, the greater the swimming speed.
Toussaint et al1 states that the swimmer’s efficiency depends in large part on the body surfaces (upper and lower). Thus, the greater the length of these segments, the more efficient the AMA, which uses fewer motor actions to move the same distance.33 Grimston and Hay34 reported that the dimensions of body segments, such as the length of the upper limbs (UL) or lower limbs (LL), influence the mechanics of swimming technique and muscle power. Because the swimmers have long body segments, they develop a greater force in opposition to the propulsive forces resistant to swimming progress, which are indicators of high-yield segments.34,35
It is widely accepted that swimming speed is determined by a combination of two external forces acting on the swimmer: a propulsive force, obtained through the segmental actions of the swimmer’s limbs, and hydrodynamic drag force, as opposed to its displacement.3 Thus, there are certain limb segments that produce resistive drag force (eg, head and trunk), the area of which should preferably be small, while the area of the propulsive limb segments (eg, lower limbs and upper limbs) should be large.3 These segments should have hydrodynamic buoyancy or the propulsive drag force characteristics depending on the sectional area of the swimmer’s body that are transverse to the direction of travel.36
Despite these considerations, many studies have been dedicated to understanding and correlating this variable anthropometric propulsive force. With these findings in the present study, there was a clear need to establish an equation to estimate the PFA from the AMA, and therefore offer a low-cost, widely used, easily applied instrument without the use of sophisticated equipment to predict performance and evaluate the effects of the training. However, while the literature presents evidence suggesting that the AMA may be adopted as a good morphological indicator, one cannot disregard the limitations of the information generated by this measure when compared to more sophisticated methods that allow more robust analysis, such as muscle biopsy, magnetic resonance imaging, and computed tomography. Therefore it is noteworthy that because the present study has used AMA only as a morphological indicator, researchers should be cautious when trying to generalize these findings since increased AMA tends not to occur uniformly in the different muscle groups or distinct body parts.37 The addition of other variables (such as the size of the arms, biacromial diameter, and scale) and biological maturation. The addition of other variables (such as the size of the arms, biacromial diameter, and scale) as well as biological maturation, could contribute to future studies.35,38,39
Conclusion
The results of this study suggest the existence of a relationship between levels of PFA in front crawl stroke and muscle mass, however, this relationship becomes more evident the longer the AMA. This relationship allows for the development of an equation for estimating the PFA of young swimmers. The PFE will help in guiding swimmers in improving the efficacy of front crawl, whether speed or endurance. This equation also allows the creation of cut points through separation by quartile intervals to classify the PFE of a team of swimmers.
Limitations
From a methodological point of view, a cross-sectional study is limited with respect to conclusions concerning causal relationships. Performance in swimming may be influenced by other issues, such as physiological characteristics, aerobic capacity, and genetics. The present work, as with any other cross-sectional study, only provides suggestive evidence concerning the causal relationship between PFA and AMA. The direction of the cause can be suggested, but is certainly limited by the use of anthropometric techniques and possibly the influence of age, as well as the limitations of the PFA test. However, this study provides the possibility for estimating the PFA of front crawl through the use of an inexpensive instrument.
Footnotes
Disclosure
The authors report no conflicts of interest in this work.
References
- 1.Toussaint HM, Roos PE, Kolmogorov S. The determination of drag in front crawl swimming. J Biomech. 2004;37(11):1655–1663. doi: 10.1016/j.jbiomech.2004.02.020. [DOI] [PubMed] [Google Scholar]
- 2.Fernandes RJ, Billat VL, Cruz AC, Colaco PJ, Cardoso CS, Vilas-Boas JP. Does net energy cost of swimming affect time to exhaustion at the individual’s maximal oxygen consumption velocity? J Sports Med Phys Fitness. 2006;46(3):373–380. [PubMed] [Google Scholar]
- 3.Fernandes RJ, Keskinen KL, Colaco P, et al. Time limit at VO2 max velocity in elite crawl swimmers. Int J Sports Med. 2008;29(2):145–150. doi: 10.1055/s-2007-965113. [DOI] [PubMed] [Google Scholar]
- 4.Neufer PD, Costill DL, Fielding RA, Flynn MG, Kirwan JP. Effect of reduced training on muscular strength and endurance in competitive swimmers. Med Sci Sports Exerc. 1987;19(5):486–490. [PubMed] [Google Scholar]
- 5.Toussaint HM, Van den Berg C, Beek WJ. “Pumped-up propulsion” during front crawl swimming. Med Sci Sports Exerc. 2002;34(2):314–319. doi: 10.1097/00005768-200202000-00020. [DOI] [PubMed] [Google Scholar]
- 6.Sanders RH. Timing in the forward one and one half somersault with one twist 3 m springboard dive. J Sci Med Sport. 1999;2(1):57–66. doi: 10.1016/s1440-2440(99)80184-4. [DOI] [PubMed] [Google Scholar]
- 7.Wilder RP, Greene JA, Winters KL, Long WB, 3rd, Gubler K, Edlich RF. Physical fitness assessment: an update. J Long Term Eff Med Implants. 2006;16(2):193–204. doi: 10.1615/jlongtermeffmedimplants.v16.i2.90. [DOI] [PubMed] [Google Scholar]
- 8.Yao W, Fuglevand RJ, Enoka RM. Motor-unit synchronization increases EMG amplitude and decreases force steadiness of simulated contractions. J Neurophysiol. 2000;83(1):441–452. doi: 10.1152/jn.2000.83.1.441. [DOI] [PubMed] [Google Scholar]
- 9.Gabriel DA, Basford JR, An KN. Neural adaptations to fatigue: implications for muscle strength and training. Med Sci Sports Exerc. 2001;33(8):1354–1360. doi: 10.1097/00005768-200108000-00017. [DOI] [PubMed] [Google Scholar]
- 10.Judge LW, Moreau C, Burke JR. Neural adaptations with sport-specific resistance training in highly skilled athletes. J Sports Sci. 2003;21(5):419–427. doi: 10.1080/0264041031000071173. [DOI] [PubMed] [Google Scholar]
- 11.Swaine IL. Arm and leg power output in swimmers during simulated swimming. Med Sci Sports Exerc. 2000;32(7):1288–1292. doi: 10.1097/00005768-200007000-00016. [DOI] [PubMed] [Google Scholar]
- 12.Faul F, Erdfelder E, Lang A-G, Buchner A. G*Power 3: A flexible statistical power analysis program for the social, behavioral, and biomedical sciences. Behav Res Methods. 2007;39(2):175–191. doi: 10.3758/bf03193146. [DOI] [PubMed] [Google Scholar]
- 13.Lukaski HC. Methods for the assessment of human body composition: traditional and new. Am J Clin Nutr. 1987;46(4):537–556. doi: 10.1093/ajcn/46.4.537. [DOI] [PubMed] [Google Scholar]
- 14.Callaway CW. New weight guidelines for Americans. Am J Clin Nutr. 1991;54(1):171–174. doi: 10.1093/ajcn/54.1.171. [DOI] [PubMed] [Google Scholar]
- 15.Slaughter MH, Lohman TG, Boileau RA, et al. Skinfold equations for estimation of body fatness in children and youth. Hum Biol. 1988;60(5):709–723. [PubMed] [Google Scholar]
- 16.Frisancho AR. New norms of upper limb fat and muscle areas for assessment of nutritional status. Am J Clin Nutr. 1981;34(11):2540–2545. doi: 10.1093/ajcn/34.11.2540. [DOI] [PubMed] [Google Scholar]
- 17.Papoti M, Martins LE, Cunha SA, Zagatto AM, Gobatto CA. Effects of taper on swimming force and swimmer performance after an experimental ten-week training program. J Strength Cond Res. 2007;21(2):538–542. doi: 10.1519/R-14894.1. [DOI] [PubMed] [Google Scholar]
- 18.Atkinson G, Nevill AM. Statistical methods for assessing measurement error (reliability) in variables relevant to sports medicine. Sports Med. 1998;26(4):217–238. doi: 10.2165/00007256-199826040-00002. [DOI] [PubMed] [Google Scholar]
- 19.Kim J, Wang Z, Heymsfield SB, Baumgartner RN, Gallagher D. Total-body skeletal muscle mass: estimation by a new dual-energy X-ray absorptiometry method. Am J Clin Nutr. 2002;76(2):378–383. doi: 10.1093/ajcn/76.2.378. [DOI] [PubMed] [Google Scholar]
- 20.Gurney JM, Jelliffe DB. Arm anthropometry in nutritional assessment: nomogram for rapid calculation of muscle circumference and cross-sectional muscle and fat areas. Am J Clin Nutr. 1973;26(9):912–915. doi: 10.1093/ajcn/26.9.912. [DOI] [PubMed] [Google Scholar]
- 21.Forbes GB, Brown MR, Griffiths HJ. Arm muscle plus bone area: anthropometry and CAT scan compared. Am J Clin Nutr. 1988;47(6):929–931. doi: 10.1093/ajcn/47.6.929. [DOI] [PubMed] [Google Scholar]
- 22.Rolland-Cachera MF, Brambilla P, Manzoni P, et al. Body composition assessed on the basis of arm circumference and triceps skinfold thickness: a new index validated in children by magnetic resonance imaging. Am J Clin Nutr. 1997;65(6):1709–1713. doi: 10.1093/ajcn/65.6.1709. [DOI] [PubMed] [Google Scholar]
- 23.Goldspink G, Scutt A, Loughna PT, Wells DJ, Jaenicke T, Gerlach GF. Gene expression in skeletal muscle in response to stretch and force generation. Am J Physiol. 1992;262(3 Pt 2):R356–R363. doi: 10.1152/ajpregu.1992.262.3.R356. [DOI] [PubMed] [Google Scholar]
- 24.MacDougall JD, Tarnopolsky MA, Chesley A, Atkinson SA. Changes in muscle protein synthesis following heavy resistance exercise in humans: a pilot study. Acta Physiol Scand. 1992;146(3):403–404. doi: 10.1111/j.1748-1716.1992.tb09437.x. [DOI] [PubMed] [Google Scholar]
- 25.Barbosa AC, Andries Júnior O. Effect of strength training on swimming performance. Braz J Phys Educ Sport. 2006;20:141–150. [Google Scholar]
- 26.Tanaka H, Costill DL, Thomas R, Fink WJ, Widrick JJ. Dry-land resistance training for competitive swimming. Med Sci Sports Exerc. 1993;25(8):952–959. [PubMed] [Google Scholar]
- 27.Bixler B, Riewald S. Analysis of a swimmer’s hand and arm in steady flow conditions using computational fluid dynamics. J Biomech. 2002;35(5):713–717. doi: 10.1016/s0021-9290(01)00246-9. [DOI] [PubMed] [Google Scholar]
- 28.Gourgoulis V, Aggeloussis N, Vezos N, Kasimatis P, Antoniou P, Mavromatis G. Estimation of hand forces and propelling efficiency during front crawl swimming with hand paddles. J Biomech. 2008;41(1):208–215. doi: 10.1016/j.jbiomech.2007.06.032. [DOI] [PubMed] [Google Scholar]
- 29.Matsuuchi K, Miwa T, Nomura T, Sakakibara J, Shintani H, Ungerechts BE. Unsteady flow field around a human hand and propulsive force in swimming. J Biomech. 2009;42(1):42–47. doi: 10.1016/j.jbiomech.2008.10.009. [DOI] [PubMed] [Google Scholar]
- 30.Rouboa A, Silva A, Leal L, Rocha J, Alves F. The effect of swimmer’s hand/forearm acceleration on propulsive forces generation using computational fluid dynamics. J Biomech. 2006;39(7):1239–1248. doi: 10.1016/j.jbiomech.2005.03.012. [DOI] [PubMed] [Google Scholar]
- 31.Garrido N, Marinho DA, Reis VM, et al. Does combined dry land strength and aerobic training inhibit performance of young competitive swimmers? J Sports Sci Med. 2010;9:300–310. [PMC free article] [PubMed] [Google Scholar]
- 32.Barbosa AC, Andrade RM, Moreira A, Serrão JC, Andries Júnior O. Reproducibility of force-time curve style “Crawl” protocol in short. Braz J Phys Educ Sport. 2012;26:37–45. [Google Scholar]
- 33.Toussaint HM, Bruinink L, Coster R, et al. Effect of a triathlon wet suit on drag during swimming. Med Sci Sports Exerc. 1989;21(3):325–328. [PubMed] [Google Scholar]
- 34.Grimston SK, Hay JG. Relationships among anthropometric and stroking characteristics of college swimmers. Med Sci Sports Exerc. 1986;18(1):60–68. [PubMed] [Google Scholar]
- 35.Costa AV, Oliveira HB, Dantas PM, Medeiros HJ, Filho JF, KnacKfuss MI. Comparison of anthropometric and muscle power of swimmers between the maturational stages. Motri. 2006;2(4):243–250. [Google Scholar]
- 36.Fernandes RJ, Marinho DA, Barbosa TM, Vilas-Boas JP. Is time limit at the minimum swimming velocity of VO2 max influenced by stroking parameters? Percept Mot Skills. 2006;103(1):67–75. doi: 10.2466/pms.103.1.67-75. [DOI] [PubMed] [Google Scholar]
- 37.Abe T, Kojima K, Kearns CF, Yohena H, Fukuda J. Whole body muscle hypertrophy from resistance training: distribution and total mass. Br J Sports Med. 2003;37(6):543–545. doi: 10.1136/bjsm.37.6.543. [DOI] [PMC free article] [PubMed] [Google Scholar]
- 38.Barbosa TM, Fernandes RJ, Keskinen KL, Vilas-Boas JP. The influence of stroke mechanics into energy cost of elite swimmers. Eur J Appl Physiol. 2008;103(2):139–149. doi: 10.1007/s00421-008-0676-z. [DOI] [PubMed] [Google Scholar]
- 39.Barbosa TM, Bragada JA, Reis VM, Marinho DA, Carvalho C, Silva AJ. Energetics and biomechanics as determining factors of swimming performance: Updating the state of the art. J Sci Med Sport. 2010;13(2):262–269. doi: 10.1016/j.jsams.2009.01.003. [DOI] [PubMed] [Google Scholar]