Abstract
Background
A recent study showed that European triathletes performed faster in Double Iron ultratriathlons than North American athletes. The present study analyzed triathletes participating in Double Iron ultratriathlons to determine the origin of the fastest Double Iron ultratriathletes, focusing on European countries.
Methods
Participation and performance trends of finishers in Double Iron ultratriathlons from 1985–2011 of the different countries were investigated. Additionally, the performance trends of the top three women and men overall from 2001–2011 were analyzed.
Results
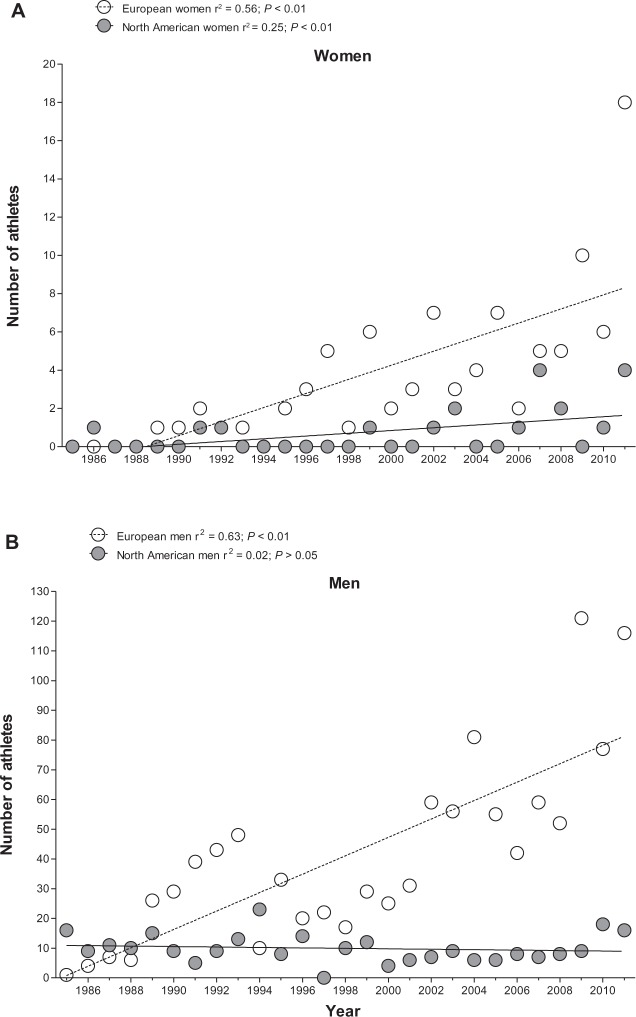
A total of 1490 finishers originated from 24 different European countries and the United States. The number of European triathletes increased for both women (r2 = 0.56; P < 0.01) and men (r2 = 0.63; P < 0.01). The number of the North American triathletes increased for women (r2 = 0.25; P < 0.01), but not for men (r2 = 0.02; P > 0.05). Hungarian triathletes showed a significant improvement in both overall race times and in cycling split times, Swiss triathletes improved both their swim and run times, and French triathletes improved their swim times.
Conclusion
Men and women triathletes from Central European countries such as France, Germany, Switzerland, and Hungary improved Double Iron ultratriathlon overall race times and split times during the 26-year period. The reasons might be the social and economic factors required to be able to participate in such an expensive and lavish race. Also, a favorable climate may provide the ideal conditions for successful training. Future studies need to investigate the motivational aspects of European ultraendurance athletes.
Keywords: triathlon, ultraendurance, swimming, cycling, running
Introduction
Triathlon is an endurance sports competition consisting of three disciplines: swimming, cycling, and running – in this order. In the field of long-distance triathlon, the Ironman triathlon consists of a 3.86-km swim, 180-km cycle, and 42.195-km run.1,2 The first Ironman triathlon was held in 1978 in Honolulu, HI, where twelve male athletes finished.1 Over the years, the Ironman triathlon has gained popularity and the number of participants has grown to up to tens of thousands of triathletes all over the world.1 Longer distances than the Ironman, such as the Double Iron ultratriathlon covering a 7.6-km swim, 360-km cycle, and 84.4-km run and the Double Deca Iron ultratriathlon covering a 76-km swim, 3600-km cycle, and 844-km run, also exist.33–5 The first Double Iron ultratriathlon was held in Huntsville, AL, US in 1985, where 23 males finished.3 Four years later, the first European Double Iron ultratriathlon was held in Colmar, France.5,6 Since this first European event was held, the number of European triathletes participating in a Double Iron ultratriathlon has increased.5,6
The national background of an athlete might be linked to a better endurance performance as has been shown for running. East African runners dominate middle- and longdistance running events.7–10 More than 50% of the all-time top 20 performances for men were achieved by Kenyan runners.8 Kenyan runners belong to the fastest long-distance runners around the world. However, athletes from other East African countries such as Ethiopia or Eritrea have also achieved world top running performances.9,10 Therefore, not only a single country but also a region within a continent might be the origin of excellent athletes. In other endurance disciplines such as swimming, athletes from different nations have dominated.11 North American athletes are among the best swimmers in the world. Trewin et al showed that the United States (US) swimmers in the 2000 Olympic Games were 1.8% faster than swimmers from other nations.11
Previous studies have investigated participation and performance trends worldwide in Double Iron ultratriathlon,4,6 in Triple Iron ultratriathlons,12 and in both Deca and Double Deca ultratriathlon.5 Considering the countries with the most participants competing in the Double Iron through to the Double Deca Iron ultratriathlon, the triathletes originated from European countries such as France, Great Britain, Germany, Austria, Italy, and Switzerland, as well as from non-European countries such as the US and Canada.4,12 European triathletes finished with both faster overall race times and faster split times in each discipline in the Double Iron ultratriathlon compared to North American athletes.6 However, these studies failed to investigate the participation and performance trends of the athletes from individual countries and their development in both overall race times and split times across years.
The aim of the present study was to examine whether the leading triathletes in the Double Iron ultratriathlon originated from a specific region in Europe. To achieve this purpose, the participation and performance trends of ultratriathletes from every single European country in Double Iron ultratriathlons held from 1985–2011 were investigated.
Material and methods
All swimming, cycling, running, and overall race times in Double Iron ultratriathlons of all triathletes originating from the US and each country of Europe were analyzed from 1985–2011. The data set from this study was obtained from the race website of the International Ultratriathlon Association36 and from the race directors. The study was approved by the institutional review board of St Gallen, Switzerland, with a waiver for the requirement of an informed consent, given that the study involved the analysis of publicly available data.
Data analysis
In total, data were available from 1862 athletes, including 146 women (7.8%) and 1716 men (92.2%). Amongst these 1862 athletes, 338 men (18.1%) and 32 women (1.7%) did not finish the race. Additionally, in 2007 and 2011, one man was disqualified. Finally, data from 1490 athletes (1376 men and 114 women) were analyzed. The 1490 athletes originated from 24 different European countries and the US, and participated at least once in a Double Iron ultratriathlon from 1985–2011. For the analysis of the development of race time, the fastest time per discipline (ie, swimming, cycling, and running) as well as the fastest overall race time were analyzed for every year. The annual fastest race times were analyzed in order to get comparable results considering that the annual number of finishers, especially in women, was very low. Since the number of finishers increased rapidly from 2001–2011, the annual race times of the top three men and women overall finishers from 2001–2011 were also analyzed. The number of finishers each year was very low, so only the countries providing at least one finisher in at least six of the races from 2001–2011 were investigated. According to these criteria, female athletes originating from Great Britain, Germany, and the US and male athletes from Austria, France, Great Britain, Germany, Hungary, Italy, Switzerland, and the US were analyzed. For these countries, the fastest athlete per discipline as well as the fastest overall race times for men and women were determined. Since some countries had a large number of male finishers per year, the overall race times of the fastest three men per discipline and the fastest overall race times were also analyzed. Athletes originating from Austria, France, Great Britain, Germany, Hungary, Italy, and the US were included in this analysis.
Statistical analysis
In order to increase the reliability of the data analyses, each set of data was tested for normal distribution as well as for homogeneity of variances prior to statistical analyses. Normal distribution was tested using a D’Agostino–Pearson omnibus normality test, and homogeneity of variances was tested using a Levene’s test in cases of two groups and a Bartlett’s test in cases of more than two groups. To find significant changes in the development of a variable between years, linear regression analysis was used. Statistical analyses were performed using SPSS® version 19 (IBM Corporation, Armonk, NY) and GraphPad Prism® version 5 (GraphPad Software, Inc, La Jolla, CA). Data in the text are given as mean ± standard deviation. For all statistical tests, significance was accepted at P < 0.05 (two-sided for t-tests).
Results
Participation
In total, 1862 athletes, including 1554 men and 146 women, participated in a Double Iron ultratriathlon from 1985–2011. Of these participants, 1376 men (88.5% of all male participants) and 114 women (78.1% of all women participants) finished successfully. The mean annual number of finishers was 4 ± 5 for women and 52 ± 34 for men.
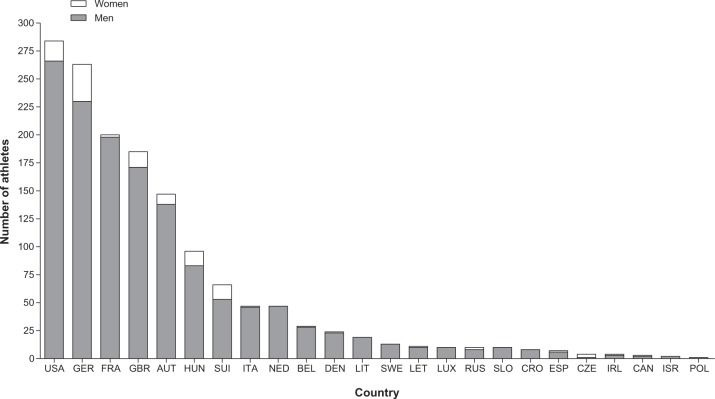
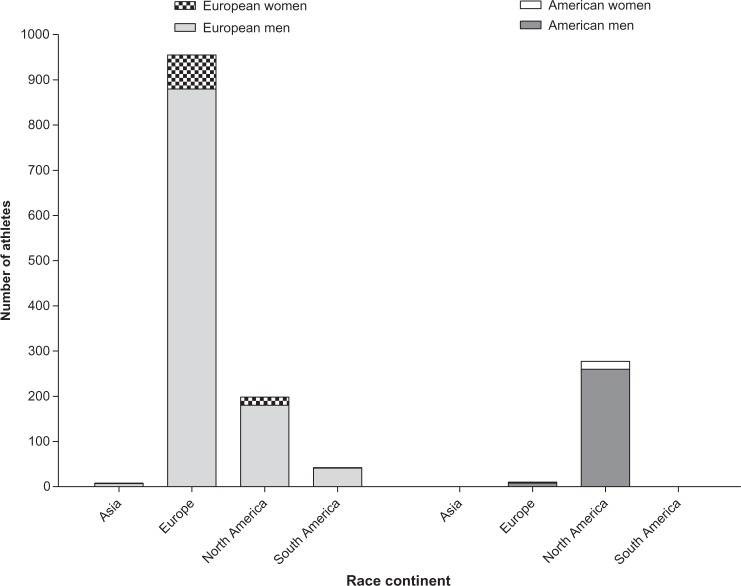
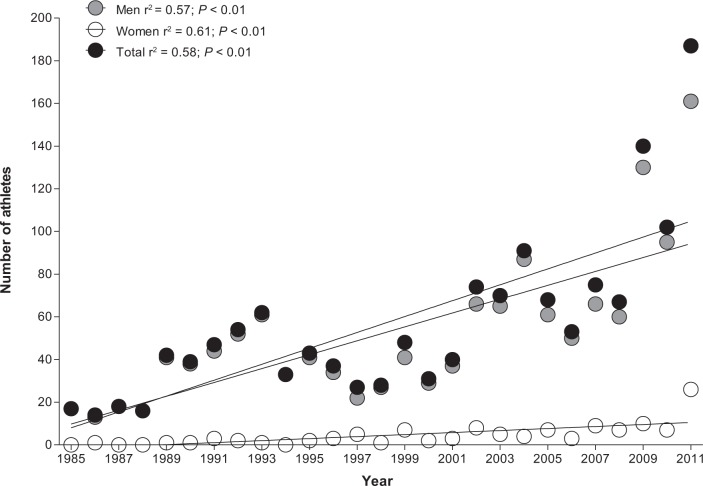
The 1490 athletes originated from 24 different European countries and the US (Figure 1). From 1985–2011, 80.9% of all finishers originated from Europe, whereas only 19.1% were from the US (Figure 2). Most of the European finishers originated from Germany (21.8%), followed by athletes from France (16.6%), Great Britain (15.3%), and Austria (12.2%). Women finishers originated mainly from Germany (28.9%) followed by the US (15.8%), Great Britain (11.4%), Switzerland (11.4%), and Hungary (11.4%). The highest number of male finishers originated from the US (19.3%), followed by Germany (16.7%), France (14.4%), Great Britain (12.4%), and Austria (10.0%). The annual number of finishers increased more in European triathletes (women: r2 = 0.56; P < 0.01, men: r2 = 0.63; P < 0.01) than in North American triathletes (women: r2 = 0.25; P < 0.01, men: r2 = 0.02; P > 0.05) (Figure 3). The annual number of finishers increased significantly (P < 0.01) in both men (r2 = 0.57) and women (r2 = 0.51) (Figure 4).
Figure 1.
Total number of men and women finishers per country sorted by the total number of finishers.
Abbreviations: AUT, Austria; BEL, Belgium; CAN, Canada; CRO, Croatia; CZE, Czech Republic; DEN, Denmark; ESP, Spain; FRA, France; GBR, Great Britain; GER, Germany; HUN, Hungary; IRL, Ireland; ISR, Israel; ITA, Italy; LET, Liechtenstein; LIT, Lithuania; LUX, Luxembourg; NED, Netherlands; POL, Poland; RUS, Russia; SLO, Slovenia; SUI, Switzerland; SWE, Sweden; USA, United States.
Figure 2.
Number of men and women starters from Europe and America as per continent where races were held.
Figure 3.
Annual number of European and North American (A) female and (B) male athletes from 1985–2011.
Figure 4.
Annual number of men, women, and total athletes from 1985–2011.
Performance of the winners
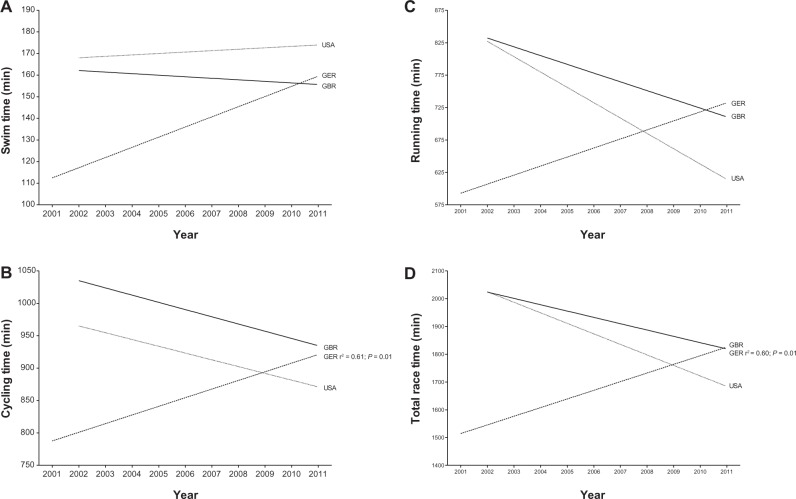
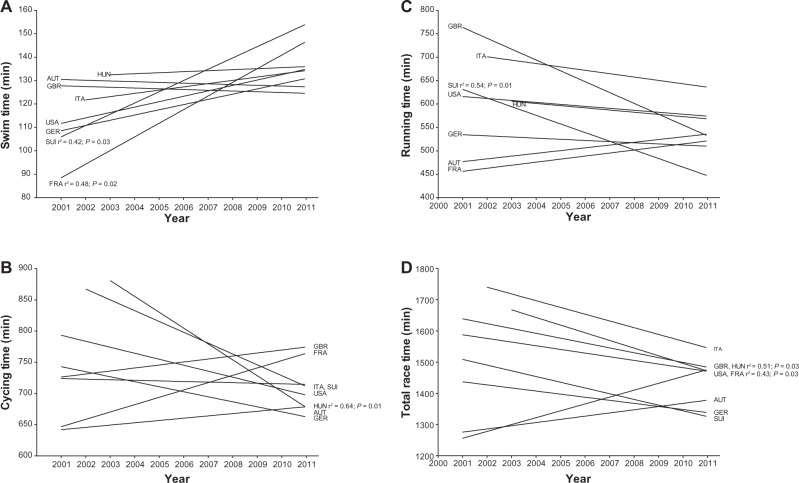
Figure 5A–D shows the development of split times in swimming, cycling, running, and overall race times for female winners. German top women increased their overall race times by 16.7% (r2 = 0.60; P = 0.01) from 1585 minutes in 2001 to 1850 minutes in 2011 (Figure 5D). German top women also increased their cycling split times by 12.9% (r2 = 0.61; P = 0.01) from 827 minutes in 2001 to 934 minutes in 2011 (Figure 5B). Figure 6A–D shows the development of split times in swimming, cycling, running, and overall race times for male winners. Regarding overall race times (Figure 6D), French top men became 6.2% slower from 1333 minutes in 2001 to 1416 minutes in 2011 (r2 = 0.43; P = 0.03), whereas Hungarian top men became 14.4% faster from 1677 minutes in 2003 to 1435 minutes in 2011 (r2 = 0.51; P = 0.03). In swimming, French top men became 45.4% slower (r2 = 0.48; P = 0.02) from 88 minutes in 2001 to 128 minutes in 2011 and Swiss top men became 53.3% slower (r2 = 0.42; P = 0.03) from 106 minutes in 2001 to 131 minutes in 2011 (Figure 6A). In cycling, Hungarian top men improved their split times by 27.8% (r2 = 0.64; P = 0.01) from 894 minutes in 2003 to 645 minutes in 2011 (Figure 6B). In running, Swiss top men became 15.7% faster (r2 = 0.54; P = 0.01) from 625 minutes in 2001 to 527 minutes in 2011 (Figure 6C).
Figure 5.
Performance of the top female athlete per country in (A) swimming, (B) cycling, (C) running, and (D) overall race time from 2001–2011.
Abbreviations: GBR, Great Britain; GER, Germany; USA, United States.
Figure 6.
Performance of the top male athlete per country in (A) swimming, (B) cycling, (C) running, and (D) overall race time from 2001–2011.
Abbreviations: AUT, Austria; FRA, France; GBR, Great Britain; GER, Germany; HUN, Hungary; ITA, Italy; SUI, Switzerland; USA, United States.
Performance of the top three men overall
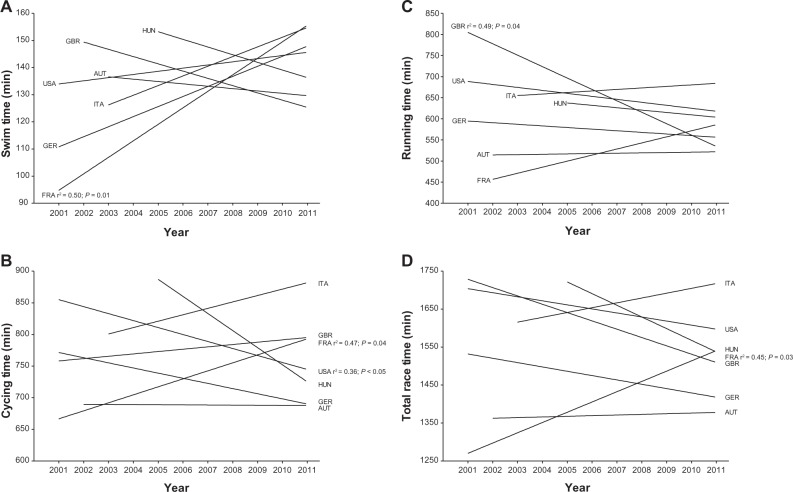
Figure 7A–D shows the development of split times in swimming, cycling, running, and for overall race times for the top three men. In swimming, the top three French men showed a significant increase in race time (r2 = 0.50; P = 0.01) by 9.8% from 119.3 ± 9.3 minutes in 2002 to 131.0 ± 4.9 minutes in 2011 (Figure 7A). In cycling, the top three French men became 8.2% slower (r2 = 0.47; P = 0.04) from 686.0 ± 16.5 minutes in 2001 to 742.0 ± 45.0 minutes in 2011, whereas the top three American men became 5.9% faster (r2 = 0.36; P = 0.05) from 787.3 ± 78.1 minutes in 2001 to 741.0 ± 15.6 minutes in 2011 (Figure 7B). In running, the top three men from Great Britain improved their running split time by 32.9% (r2 = 0.49; P = 0.04) from 843.3 ± 81.4 minutes in 2001 to 566.0 ± 55.4 minutes in 2011 (Figure 7C). The top three French men became 8.3% slower in overall race time (r2 = 0.45; P = 0.03) from 1339.6 ± 10.6 minutes in 2001 to 1451.0 ± 45.0 minutes in 2011 (Figure 7D).
Figure 7.
Performance of the top three male athletes per country in (A) swimming, (B) cycling, (C) running, and (D) overall race time from 2001–2011.
Abbreviations: AUT, Austria; FRA, France; GBR, Great Britain; GER, Germany; HUN, Hungary; ITA, Italy; SUI, Switzerland; USA, United States.
Discussion
The aim of this study was to investigate the leading triathletes from individual European countries and the US regarding their participation and performance trends in Double Iron ultratriathlons. The main results were (1) an increase in European participation across the years with 80.9% of all finishers originating from Europe, and (2) an improvement in winner performances for German and French women, Swiss and Hungarian men, and for the male top three overall finishers, and a faster race time for French, American, and Great Britain triathletes. The Central European countries seem to be the origin of the fastest triathletes competing in Double Iron ultratriathlons.
Increase in European participation
The results show an increase in European participants over the years. From 1985–2011, 80.9% of all finishers originated from Europe, whereas only 19.1% of the finishers were from the US. Women finishers originated mainly from Germany and men finishers from the US, followed by Germany. Similar results have been reported for Triple Iron ultratriathletes competing from 1988–2011.12 From 1988–2011, 85.6% of the 1258 participants in a Triple Iron ultratriathlon originated from Europe, most of them (61.5%) from Germany.12
When Double Iron ultratriathlons first began, most of the annual participants originated from the North American continent.6 The number of North American triathletes has shown no increase, whereas the annual number of European athletes has grown rapidly.6 Since 1989, the same year when the first European Double Iron ultratriathlon was held in Colmar, France, the number of European participants has been increasing.6 It reached its maximum number of triathletes in 2009.6 An increase in participation in other ultraendurance races has also been observed. In the 161-km ultramarathons in North America, Hoffman et al showed an exponential growth in the number of participants from 1977–2008.13 The rapidly rising number of starters in the Western States 100-Mile Endurance Run has remained about the same since 1986.14 In Triple Iron ultratriathlons, only the participation of men has increased during the last 24 years – in both European and North American athletes. The number of female triathletes in Triple Iron ultratriathlons from 1988–2011 remained about the same, at approximately 8%.12 The rising number of participants especially from Europe and the US might be due to the good financial situation and socioeconomic status of these continents.
The best triathletes in Double Iron ultratriathlon originated from Central Europe
In regard to the fastest men and women race times, athletes from Austria, France, and Germany led in overall race times and any split times. As Onywera et al determined a certain region in Kenya as the origin of the elite Kenyan runners,8 the current results show Central Europe as the region where the leading triathletes in Double Iron ultratriathlons originated. However, the dominance of other countries in other sport disciplines, such as North Americans in swimming, has been reported.11 In the 2000 Olympic Games, swimmers from the US were 0.9% faster than Australian swimmers and 1.8% faster than swimmers from other nations. There were no great differences in mean progression between sexes or nations.11 However, no domination of one single nation in Double Iron ultratriathlons was found, neither in overall race time nor in any split time. Rather, there seems to be a region of the fastest athletes within the European continent.
In regard to the race times of the top three male triathletes overall, France, Great Britain, and the US were the leading countries. The race times of the top three triathletes changed less than those of the top athletes during the study period. Only in the running split time did the top three athletes from Great Britain and Switzerland improve (32.9% and 15.7%, respectively) compared to the best athletes (1985–2011). Interestingly, considering overall race times, French top athletes became slower (6.2%) and the French top three triathletes improved their race time by 8.3%. This difference can be explained by the different duration of the study period. The results of the winners were for the years 1985–2011. In the top three athletes, the results were for the years 2001–2011. An improvement in performance has also been seen in Triple Iron ultratriathlons. Male European ultratriathletes became faster in overall race time from 1988–2011.12
Why do European athletes dominate Double Iron ultratriathlon performances?
A possible explanation for the different performances in ultratriathletes originating from different countries could be climate,15,16 equipment,17 physical characteristics,18 and probably the socioeconomic status and financial status of a nation (Eurostat, 2010, http://epp.eurostat.ec/europe.eu, 22.04.2012).19 Some environmental or social factors in Central Europe might be favorable in contrast to the northern or southern part of the European continent. Triathlon is an expensive sport because of the different equipment a triathlete uses for each discipline. The population in Northern or Central Europe earns more money than the population in Southern Europe. The annual salary in Northern and Central European countries such as Germany, Austria, and Switzerland (24,000–28,000 Euros) is higher than in Southern European countries such as Spain, Italy (16,000–18,000 Euros), or Greece (13,000 Euros) (Eurostat, 2010, http://epp.eurostat.ec/europe.eu, 22.04.2012).20 However, in Southern European countries, the weather is more suited for outdoor endurance training with a shorter winter, but temperatures in the summer are too high for good ultraendurance conditions (Euro Meteo 2012, http://www.eurometeo.com).21 The countries in Northern Europe experience about 16°C (Norway, Oslo) in summer and very low temperatures in winter. These countries do not have a lot of sunlight during the winter, making outdoor activities difficult. Countries in Central Europe such as Switzerland or Austria show moderate temperatures, with about −1°C in winter and around 18°C–20°C during summer. Together with a more equal number of sunlight hours across the seasons, Central Europe may be the leading region for ideal training conditions.
The dominance of Central European athletes has also been shown in races held in Central Europe, including the Powerman Zofingen and Ironman Switzerland.22,23 The distance to the location of the event might be an important factor in regard to participation. For the English Channel Swim, most athletes (38%) originated from Great Britain, followed by swimmers from the US.24 However, there has also been an increase in the participation of European ultratriathletes in races held outside of Europe.5,25 European athletes, especially Central European athletes, also dominate other ultraendurance races, such as the Race Across America, held outside Europe. While the Race Across America was dominated in the beginning by American cyclists (Table 1), Central European athletes have started to dominate in recent years. For the top three male ultracyclists in the Race Across America from 1982–1997 (16 years), 42 cyclists (87.5%) originated from the US, four finishers (8.3%) were from Austria, and two cyclists (4.2%) were from Australia. From 1998–2012 (15 years), only twelve finishers (26.7%) were American cyclists, whereas 30 finishers (66.7%) originated from Europe. Among the European athletes, they originated from Austria, Slovenia, Switzerland, Germany, Italy, and Liechtenstein – mainly countries in Central Europe. Reasons for the increased participation and improved performance in Central European ultratriathletes might also be motivation and education in ultraendurance athletes.26–28
Table 1.
Top three finishers in the Race Across America from 1982–2012
| Year | Men
|
Women
|
||||
|---|---|---|---|---|---|---|
| 1st | 2nd | 3rd | 1st | 2nd | 3rd | |
| 2012 | Switzerland | Austria | Austria | Switzerland | Canada | |
| 2011 | Austria | United States | Slovenia | United States | ||
| 2010 | Slovenia | Austria | Australia | France | Italy | South Africa |
| 2009 | Switzerland | Austria | Slovenia | Brazil | United States | |
| 2008 | Slovenia | Great Britain | United States | |||
| 2007 | Slovenia | Austria | Austria | |||
| 2006 | Switzerland | Italy | Italy | United States | ||
| 2005 | Slovenia | Germany | Italy | United States | ||
| 2004 | Slovenia | United States | Austria | |||
| 2003 | United States | Slovenia | United States | |||
| 2002 | Austria | United States | United States | |||
| 2001 | Liechtenstein | United States | United States | Australia | ||
| 2000 | Austria | United States | Italy | Australia | ||
| 1999 | United States | Austria | Australia | |||
| 1998 | Australia | Austria | United States | United States | ||
| 1997 | Austria | United States | United States | United States | United States | |
| 1996 | United States | United States | Austria | |||
| 1995 | United States | United States | Australia | United States | United States | |
| 1994 | United States | United States | United States | United States | United States | United States |
| 1993 | Australia | United States | United States | United States | United States | |
| 1992 | United States | United States | United States | United States | United States | United States |
| 1991 | United States | United States | Australia | United States | United States | United States |
| 1990 | United States | United States | United States | United States | United States | United States |
| 1989 | United States | United States | United States | United States | ||
| 1988 | Austria | United States | United States | United States | United States | United States |
| 1987 | United States | United States | Austria | United States | United States | United States |
| 1986 | United States | United States | United States | United States | United States | |
| 1985 | United States | United States | United States | United States | United States | United States |
| 1984 | United States | United States | United States | United States | United States | United States |
| 1983 | United States | United States | United States | |||
| 1982 | United States | United States | United States | |||
Limitations and implications for future research
This cross-sectional data analysis has some limitations. Variables such as anthropometry,18,29,30 physiology,31–33 pre-race experience,30 training volume,33 and material and equipment17 have been shown to have an influence on athletic performance. Environmental factors during the race such as weather, humidity, and climate were not considered.15,16,34,35 While motivational aspects have been investigated for American female ultramarathoners and both female and male Master athletes from New Zealand,26,27 data on motivation of ultraendurance athletes from Europe are lacking.
Conclusion
From 1985–2011, 80.9% of all finishers in Double Iron ultratriathlons were Europeans. The number of participants increased, especially in European triathletes, during this period. No individual country dominated in Double Iron ultratriathlons. However, it appears that the best Double Iron ultratriathletes originated from Central European countries such as Germany, France, Hungary, and Switzerland. The reason might be the social and economic factors required to be able to participate in such an expensive and lavish race. Also, a favorable climate may provide the ideal conditions for successful training. Future studies need to investigate the motivational aspects of European ultraendurance athletes.
Footnotes
Disclosure
The authors report no conflicts of interest in this work.
References
- 1.Lepers R. Analysis of Hawaii Ironman performances in elite triathletes from 1981 to 2007. Med Sci Sports Exerc. 2008;40(10):1828–1834. doi: 10.1249/MSS.0b013e31817e91a4. [DOI] [PubMed] [Google Scholar]
- 2.Lepers R, Maffiuletti NA. Age and gender interactions in ultraendurance performance: insight from the triathlon. Med Sci Sports Exerc. 2011;43(1):134–139. doi: 10.1249/MSS.0b013e3181e57997. [DOI] [PubMed] [Google Scholar]
- 3.Knechtle B, Knechtle P, Lepers R. Participation and performance trends in ultra-triathlons from 1985 to 2009. Scand J Med Sci Sports. 2011;21(6):e82–e90. doi: 10.1111/j.1600-0838.2010.01160.x. [DOI] [PubMed] [Google Scholar]
- 4.Lepers R, Knechtle B, Knechtle P, Rosemann T. Analysis of ultratriathlon performances. Open Access J Sports Med. 2011;2:131–136. doi: 10.2147/OAJSM.S22956. [DOI] [PMC free article] [PubMed] [Google Scholar]
- 5.Lenherr R, Knechtle B, Rüst CA, Rosemann T, Lepers R. From Double Iron to Double Deca Iron ultra-triathlon – a retrospective data analysis from 1985 to 2011. Phys Cult Sport Stud Res. 2012;54:55–67. [Google Scholar]
- 6.Rüst CA, Knechtle B, Knechtle P, Lepers R, Rosemann T, Onywera V. European athletes dominate performance in Double Iron ultra-triathlons – A retrospective data analysis from 1985 to 2010. Eur J Sport Sci. 2012 doi: 10.1080/17461391.2011.641033. [DOI] [PubMed] [Google Scholar]
- 7.Onywera VO. East African runners: their genetics, lifestyle and athletic prowess. Med Sport Sci. 2009;54:102–109. doi: 10.1159/000235699. [DOI] [PubMed] [Google Scholar]
- 8.Onywera VO, Scott RA, Boit MK, Pitsiladis YP. Demographic characteristics of elite Kenyan endurance runners. J Sports Sci. 2006;24(4):415–422. doi: 10.1080/02640410500189033. [DOI] [PubMed] [Google Scholar]
- 9.Scott RA, Georgiades E, Wilson RH, Goodwin WH, Wolde B, Pitsiladis YP. Demographic characteristics of elite Ethiopian endurance runners. Med Sci Sports Exerc. 2003;35(10):1727–1732. doi: 10.1249/01.MSS.0000089335.85254.89. [DOI] [PubMed] [Google Scholar]
- 10.Lucia A, Esteve-Lanao J, Olivan J, et al. Physiological characteristics of the best Eritrean runners-exceptional running economy. Appl Physiol Nutr Metab. 2006;31(5):530–540. doi: 10.1139/h06-029. [DOI] [PubMed] [Google Scholar]
- 11.Trewin CB, Hopkins WG, Pyne DB. Relationship between world-ranking and Olympic performance of swimmers. J Sports Sci. 2004;22(4):339–345. doi: 10.1080/02640410310001641610. [DOI] [PubMed] [Google Scholar]
- 12.Jeffery S, Knechtle B, Rüst CA, Knechtle P, Rosemann T, Lepers R. European dominance in Triple Iron ultra-triathlons from 1988 to 2011. J Sci Cycling. 2012;1(1):30–38. [Google Scholar]
- 13.Hoffman MD, Ong JC, Wang G. Historical analysis of participation in 161 km ultramarathons in North America. Int J Hist Sport. 2010;27(11):1877–1891. doi: 10.1080/09523367.2010.494385. [DOI] [PubMed] [Google Scholar]
- 14.Hoffman MD, Wegelin JA. The Western States 100-Mile Endurance Run: participation and performance trends. Med Sci Sports Exerc. 2009;41(12):2191–2198. doi: 10.1249/MSS.0b013e3181a8d553. [DOI] [PMC free article] [PubMed] [Google Scholar]
- 15.Trapasso LM, Cooper JD. Record performances at the Boston Marathon: biometeorological factors. Int J Biometeorol. 1989;33(4):233–237. doi: 10.1007/BF01051083. [DOI] [PubMed] [Google Scholar]
- 16.Cheuvront SN, Haymes EM. Thermoregulation and marathon running: biological and environmental influences. Sports Med. 2001;31(10):743–762. doi: 10.2165/00007256-200131100-00004. [DOI] [PubMed] [Google Scholar]
- 17.O’Connor LM, Vozenilek JA. Is it the athlete or the equipment? An analysis of the top swim performances from 1990 to 2010. J Strength Cond Res. 2001;25(12):3239–3241. doi: 10.1519/JSC.0b013e3182392c5f. [DOI] [PubMed] [Google Scholar]
- 18.Hoffman MD. Anthropometric characteristics of ultramarathoners. Int J Sports Med. 2008;29(10):808–811. doi: 10.1055/s-2008-1038434. [DOI] [PubMed] [Google Scholar]
- 19.http://appsso.eurostat.ec.europa.eu/nui/show.do?dataset=earn_nt_net&lang=deaccessed April 24, 2012
- 20.Annual net earings http://appsso.eurostat.ec.europa.eu/nui/show.do?dataset=earn_nt_net&lang=deAccessed April 24, 2012
- 21.http://www.eurometeo.com/english/climateaccessed April 24, 2012
- 22.Rüst CA, Knechtle B, Knechtle P, Rosemann T, Lepers R. The aspect of nationality in participation and performance at the Powerman Duathlon World Championship – the “Powerman Zofingen” from 2002 to 2011. J Sci Cycling. http://www.jsc-journal.com/ojs/index.php?journal=JSC&page=article&op=view&path[]=13 [Google Scholar]
- 23.Jurgens D, Knechtle B, Rüst CA, Knechtle P, Rosemann T, Lepers R. An analysis of participation and performance by nationality at Ironman Switzerland from 1995 to 2011. J Sci Cycling. http://www.jsc-journal.com/ojs/index.php?journal=JSC&page=article&op=view&path[]=11 [Google Scholar]
- 24.Eichenberger E, Knechtle B, Knechtle P, Rüst CA, Rosemann T, Lepers R. Best performances by men and women open-water swimmers during the “English Channel Swim” from 1900 to 2010. J Sports Sci. 2012;30(12):1295–1301. doi: 10.1080/02640414.2012.709264. [DOI] [PubMed] [Google Scholar]
- 25.Rüst CA, Knechtle B, Knechtle P, Rosemann T, Lepers R. Participation and performance in Triple Iron ultra-triathlon – a cross-sectional and longitudinal data analysis. Asian J Sports Med. 2012;3(3):145–151. doi: 10.5812/asjsm.34605. [DOI] [PMC free article] [PubMed] [Google Scholar]
- 26.Krouse RZ, Ransdell LB, Lucas SM, Pritchard ME. Motivation, goal orientation, coaching, and training habits of women ultrarunners. J Strength Cond Res. 2011;25(10):2835–2842. doi: 10.1519/JSC.0b013e318204caa0. [DOI] [PubMed] [Google Scholar]
- 27.Hodge K, Allen JB, Smellie L. Motivation in Masters sport: achievement and social goals. Psychol Sport Exerc. 2008;9(2):157–176. [Google Scholar]
- 28.Hoffman MD, Fogard K. Demographic characteristics of 161-km ultramarathon runners. Res Sports Med. 2012;20(1):59–69. doi: 10.1080/15438627.2012.634707. [DOI] [PubMed] [Google Scholar]
- 29.Knechtle B, Knechtle P, Rüst CA, Rosemann T. A comparison of anthropometric and training characteristics of Ironman triathletes and Triple Iron ultra-triathletes. J Sports Sci. 2011;29(13):1373–1380. doi: 10.1080/02640414.2011.587442. [DOI] [PubMed] [Google Scholar]
- 30.Knechtle B, Knechtle P, Rosemann T, Senn O. Personal best time, not anthropometry or training volume, is associated with total race time in a Triple Iron triathlon. J Strength Cond Res. 2011;25(4):1142–1150. doi: 10.1519/JSC.0b013e3181d09f0f. [DOI] [PubMed] [Google Scholar]
- 31.Knechtle B, Christinger N, Kohler G, Knechtle P, Rosemann T. Swimming in ice cold water. Ir J Med Sci. 2009;178(4):507–511. doi: 10.1007/s11845-009-0427-0. [DOI] [PubMed] [Google Scholar]
- 32.Laursen PB, Rhodes EC. Factors affecting performance in an ultraendurance triathlon. Sports Med. 2001;31(3):195–209. doi: 10.2165/00007256-200131030-00004. [DOI] [PubMed] [Google Scholar]
- 33.Scrimgeour AG, Noakes TD, Adams B, Myburgh K. The influence of weekly training distance on fractional utilization of maximum aerobic capacity in marathon and ultramarathon runners. Eur J Appl Physiol Occup Physiol. 1986;55(2):202–209. doi: 10.1007/BF00715006. [DOI] [PubMed] [Google Scholar]
- 34.Parise CA, Hoffman MD. Influence of temperature and performance level on pacing a 161 km trail ultramarathon. Int J Sports Physiol Perform. 2011;6(2):243–251. doi: 10.1123/ijspp.6.2.243. [DOI] [PubMed] [Google Scholar]
- 35.Montain SJ, Ely MR, Cheuvront SN. Marathon performance in thermally stressing conditions. Sports Med. 2007;37(4–5):320–323. doi: 10.2165/00007256-200737040-00012. [DOI] [PubMed] [Google Scholar]
- 36.International Ultratriathlon Association Available at http://www.iutasport.com/?page=races.


