Abstract
For immobilization of proteins onto surfaces in a specific and controlled manner it is important to start with a well-defined surface that contains specific binding sites surrounded by a nonfouling background. For immobilizing histidine-tagged (his-tagged) proteins, surfaces containing nitrilotriacetic acid (NTA) headgroups and oligo(ethylene glycol) (OEG) moieties are a widely used model system. The surface composition, structure and reactivity of mixed NTA/OEG self-assembled monolayers (SAMs) on Au substrates were characterized in detail using x-ray photoelectron spectroscopy (XPS), near-edge x-ray absorption fine structure spectroscopy (NEXAFS), time-of-flight secondary ion mass spectrometry (ToF-SIMS) and surface plasmon resonance (SPR) biosensoring. XPS results for sequential adsorption of NTA thiols followed by OEG thiols showed that OEG molecules were incorporated into an incompletely formed NTA monolayer until a complete mixed SAM was formed. The surface concentration of NTA headgroups was estimated to be 0.9–1.3 molecule/nm2 in the mixed NTA/OEG monolayers, compared to 1.9 molecule/nm2 in pure NTA monolayers. Angle-dependent XPS indicated NTA headgroups were slightly reoriented toward an upright position after OEG incorporation and polarization-dependent NEXAFS results indicated increased ordering of the alkane chains of the molecules. Nitrogen-containing and OEG-related secondary ion fragments from the ToF-SIMS experiments confirmed the presence of NTA headgroups and OEG moieties in the monolayers. A multivariate peak intensity ratio was developed for estimating the relative NTA concentration in the outermost (10 Ǻ) of the monolayers. SPR measurements of a his-tagged, humanized anti-lysozyme variable fragment (HuLys Fv) immobilized onto Ni(II)-treated mixed NTA/OEG and pure NTA monolayers demonstrated the reversible, site-specific immobilization of his-tagged HuLys Fv (108 – 205 ng/cm2) with dissociation rates (koff) between 1.0x10⁻⁴ and 2.1x10⁻⁵ s−1, both depending on the NTA surface concentration and orientation. The monolayers without Ni(II) treatment exhibited low nonspecific adsorption of his-tagged HuLys Fv ( < 2ng/cm2).
Introduction
Controlled orientation, site-specific immobilization of protein has received considerable attention in many biological fields, such as biomaterials1–3, biosensors4–8 and protein arrays9–12, as well as the study of structure-function relationships.13,14 An essential step for protein immobilization is to construct a well-defined surface exhibiting selective affinity for the desired protein while resisting nonspecific protein adsorption. One attractive way to anchor proteins involves preparing a surface of dispersed bioactive ligands (e.g. biotin15,16) in a protein resistant background (e.g. oligo(ethylene glycol) 17–19).
Self-assembly of functionalized alkanethiols on metal surfaces (e.g. Au and Ag) is a convenient way to manipulate the surface composition, packing density and molecular orientation for biomolecule immobilization.20–22 A mixed self-assembled monolayer (SAM) containing nitrilotriacetic acid (NTA) headgroups and oligo(ethylene glycol) (OEG) moieties provides a practical model system to orient recombinant proteins fused with a hexa(histidine) tag. This method takes advantage of the fact that the imidazole rings in a string of six histidines produce strong and specific binding to the free coordination sites of the surface bound NTA-metal complex.
Traditional surface characterization techniques, such as Attenuated Total Reflection FTIR (ATR-IR)23,24, Surface Enhanced Infrared Absorption (SEIRA)25,26 and X-ray Photoelectron Spectroscopy (XPS)27–31, have been used to obtain chemical information about NTA surfaces. Examples include the quality of a pure NTA SAM27, conjugation chemistry for grafting NTA headgroups onto substrate surfaces29 and the sequential surface activation step28. When combined with additional results from immunoassay24,27 and molecular recognition experiments32, the bioactivity and orientation of proteins at solid/liquid interfaces can be deduced. Surface structural information and NTA headgroup surface concentrations have not been addressed and related to protein specific immobilization and dissociation in flow assay conditions.
In this study, the complementary surface analytical techniques XPS, Angle-dependent XPS (ADXPS), Time-of-Flight Secondary Ion Mass Spectrometry (ToF-SIMS), and Near Edge X-ray Absorption Fine Structure (NEXAFS) were used to develop a more detailed understanding of the molecular structure of NTA monolayers. Quantitative atomic compositions of pure NTA and mixed NTA/OEG monolayers were determined with XPS. The NTA distribution and molecular order in pure NTA and mixed NTA/OEG monolayers were examined by ADXPS and NEXAFS. NTA surface concentration in the monolayer was calculated from the XPS and ToF-SIMS results. Surface Plasma Resonance (SPR) biosensing was used to demonstrate the specific and reversible adsorption of a histine-tagged (his-tagged) protein (humanized anti-lysozyme Fv) to the pure NTA and mixed NTA/OEG monolayers.
Experimental Section
Materials
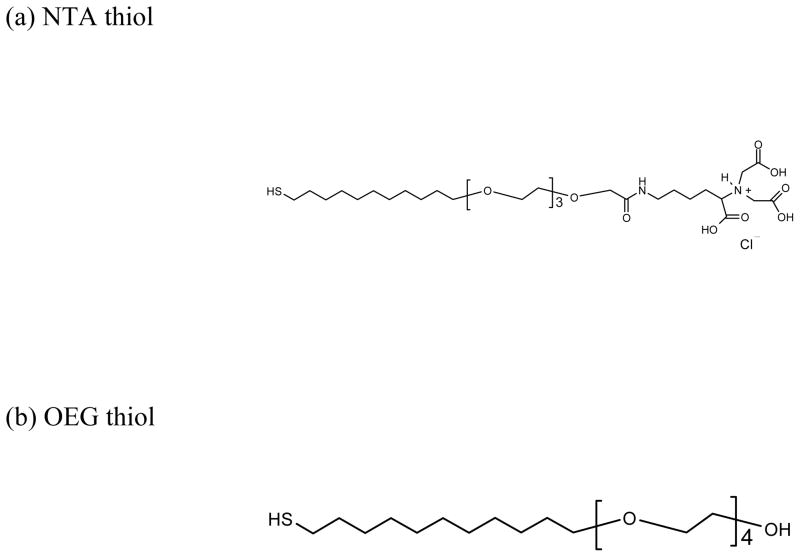
Nitrilotriacetic acid - terminated tetra(ethylene glycol) undecythiol (NTA thiol) and hydroxyl – terminated tetra(ethylene glycol) undecythiol (OEG thiol) were purchased from Prochimia and Asemblon, respectively. Both were used as received. The chemical structures of the NTA thiol and OEG thiols are shown in Figure 1. NiSO4 hexahydrate and imidazole were purchased from Sigma-Aldrich (St. Louis, MO). Ethanol (200-proof) was purchased from the Aaper Alcohol and Chemical Company (Shelbyville, Kentucky). All water used in the experiment was purified by treating in a reverse osmosis unit followed by a Millipore unit (18 m resistivity). The phosphate buffered saline (PBS), purchased from Boston BioProducts, contained 137mM NaCl, 2.7mM KCl and 10mM phosphate salts at pH 7.4.
Figure 1.
The chemical structures of the NTA thiol (a) and OEG thiol (b) used for SAM formation.
His-tagged Protein
The gene encoding humanized anti-lysozyme Fragment variable (HuLys Fv) (25,574 Da) was generously provided by the Jefferson Foote Lab (Fred Hutchinson Cancer Research Center, Seattle, WA). The gene was presented as an insertion in the vector plasmid pAK19; permission for use was obtained from Genentech, Inc. (South San Francisco, CA). Details of the plasmid structure and his-tagged HuLys Fv expression procedure have been published elsewhere.33,34 His-tagged HuLys Fv solutions were prepared in PBS buffer (0.15M, pH 7.4). His-tagged HuLys Fv concentration was calculated based on extinction coefficients of 51,300M−1cm−1.
Pure NTA, NTA/OEG and pure OEG monolayers
Silicon wafers (Silicon Valley Microelectronics, Inc., San Jose), coated with 10 nm Cr and 80 nm Au (99.99%) by electron beam evaporation at pressures below 1 x 10⁻⁶ Torr, were used as substrates. Mixed NTA/OEG monolayers were assembled by a sequential two-step process. First, NTA monolayers were prepared by immersing freshly Au-coated substrates in 0.1 mM NTA thiol ethanolic solutions for 5 minutes. After the NTA thiol assembly, samples were rinsed thoroughly with ethanol for 2 minutes to remove loosely bound NTA thiol. These NTA-covered samples were then immersed in 0.1 mM OEG thiol solutions for exposure times of 0.5, 24 and 48 hours. After the specified OEG backfill-time, samples were removed from the solution and rinsed sequentially with ethanol, ethanol with 2% (v/v) acetic acid and water twice for 2 minutes for each rinse step. Pure NTA monolayers were prepared by immersing freshly Au-coated substrates in 0.1 mM NTA thiol ethanolic solutions for 5 minutes or 24 hours. The pure NTA samples were removed from the solution and rinsed sequentially with ethanol, ethanol with 2% (v/v) acetic acid and water twice for 2 minutes for each rinse step. Pure OEG monolayers were prepared by immersing freshly Au-coated substrates in 0.1 mM OEG thiol ethanolic solutions 24 hours. The pure OEG samples were removed from the solution and rinsed twice with ethanol for 2 minutes. After rinsing, all monolayers (pure NTA, mixed NTA/OEG and pure OEG) were blown dry with N2 and stored under N2 until analysis.
XPS Analysis
XPS composition data and high resolution spectra were acquired on a Kratos AXIS Ultra DLD instrument equipped with a monochromatic Al-Kα X-ray source. Compositional survey and detailed scans (N 1s, O 1s, S 2p, Cl 2p and Ni 2p) were acquired using a pass energy of 80 eV. High-resolution spectra (C 1s, S 2p and Au 4f) were acquired using a pass energy of 20 eV. For the high-resolution spectra, peak binding energies were referenced to the Au 4f 7/2 peak at 84.0 eV. The above data were taken at 0° take-off angle in the hybrid mode. The take-off angle is defined as the angle between the sample surface normal and the axis of the XPS analyzer lens. Angle-dependent compositional data were acquired at photoelectron take-off angles of 0°, 55° and 75° in the electrostatic mode using a pass energy of 160 eV. The number of scans taken at different angles was adjusted to optimize the signal-to-noise ratio. Three spots on two or more replicates of each sample were analyzed. Data analysis was performed with Vision Processing data reduction software (Kratos Analytical Ltd.) for composition and CasaXPS software (Casa Software Ltd) for high resolution spectra.
ToF-SIMS Analysis
ToF-SIMS is a powerful tool to analyze complex surfaces due to its high surface sensitivity, high mass resolution, and molecular specificity.35 Positive and negative ion ToF-SIMS data were acquired with a Physical Electronics PHI 7200 reflectron time-of-flight secondary ion mass spectrometer using an 8 keV Cs+ primary ion source in the pulsed mode. The area of analysis for each spectrum was 100 μm x 100 μm, and the total ion dose was maintained below 1012 ions/cm2. Mass resolution (m/Δm) was typically above 5000 and 6000 for the (m/z) 27 and 25 peaks in the positive and negative ion spectra, respectively. Three spots on two replicates of each sample were examined. Positive ion spectra were mass calibrated using the CH3+, C2H5+, and AuC2H4+ fragments, and negative ion spectra were mass calibrated using the CH−, C2H−, and AuS− fragments. Calibration errors were kept below 10 ppm.
Principal Component Analysis
PCA applications to ToF-SIMS spectral analysis has been described extensively elsewhere.36,37 By applying PCA, a ToF-SIMS data set can be reduced to two cross-product matrices: scores and loadings. Scores plots can be used to visualize the quantitative relationship among samples. Loadings plots can be used to visualize the relationship between original variables (spectral peaks) and new variables (principal components). All of the peaks at least 3 times above background in the 12 – 300 m/z region of the positive and negative ion mass spectra were selected for principal component analysis. Positive and negative spectra were analyzed separately throughout this study. Before PCA, each raw spectrum was normalized to the sum of the intensity of the selected peaks and then mean-centered. PCA was performed using the PLS Toolbox v. 2.0 (Eigenvector Research, Manson, WA) for MATLAB v. 6.5 (MathWorks, Inc., Natick, WA).
NEXAFS Analysis
NEXAFS spectra were taken at the National Synchrotron Light Source (NSLS) U7A beamline at Brookhaven National Laboratory using an ~85% polarized, high intensity beam. Details of the instrumentation and data processing procedure have been previously reported.38,39 For the NEXAFS spectra the angle is defined as the angle between the incident X-ray beam and the sample surface. The incident beam normal to the surface is defined as 90° while a glancing incident beam is 20° from the surface plane. All spectra were normalized to an edge step height of unity.
SPR Measurements
SPR biosensoring is an important in situ method for monitoring the adsorption of biomolecules from liquid solutions onto functionalized metal surfaces.40–44 The calculation of the protein surface coverage from the SPR response is described elsewhere. 15,16
The home-built SPR liquid biosensing system used in this study has been described and characterized in more detail elsewhere.45,46 A dual-channel Teflon flow cell with two independent, low volume parallel flow channels was used. A peristaltic pump (Ismatec) was utilized to deliver solution to the two chambers of the flow cell at a rate of 50 μL/min. To minimize environmental effects on the SPR signals, one channel was used as a buffer control. All buffers (0.15 M PBS, pH 7.4) and solutions used in this study were degassed, except as noted.
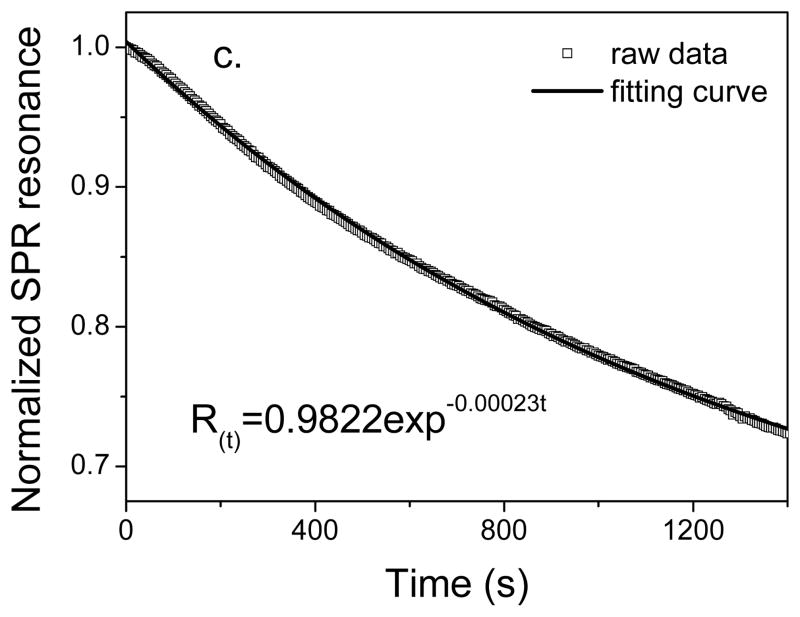
SPR sensorgrams were acquired in triplicate, and in each data set, resonance units (RU) were normalized and dissociation curves analyzed. Kinetic dissociation rate constants were obtained from an exponential fitting function using Excel (Microsoft). Dissociation phases of the sensorgrams were fit to the exponential function
where R(t) is the SPR response at time t, Ro is the SPR response at t0, corresponding to the beginning of the dissociation process, and Rb is the baseline SPR response prior to the injection of his-tagged protein.
Results and Discussion
A. XPS Analysis of Pure NTA and mixed NTA/OEG monolayers
Monolayer composition
XPS was used to determine the surface elemental compositions of pure and mixed NTA/OEG monolayers. XPS survey scans detected the elements expected from NTA thiol (C, O, N, S), OEG thiol (C, O, S) as well as the substrate (Au). No other elemental signals, including the NTA counter ion Cl, were observed. The Cl counter ions were likely washed away by the thorough rinsing after the self assembly. The resulting elemental composition analysis shown in Table 1 indicates that for both pure NTA monolayers on Au substrate (i.e. NTA a and NTA b) the experimentally measured N/O ratio is close to 0.20, consistent with the 0.18 stoichiometric N/O ratio expected for the NTA thiol. The XPS determined elemental compositions for both NTA a and NTA b are consistent with the theoretical value, except higher carbon and lower sulfur concentrations. The higher carbon concentrations are attributed to the presence of some adventitious hydrocarbon contamination. Since the thiol groups are located at the gold-monolayer interface, the lower sulfur concentrations are due to the attenuation of sulfur photoelectrons by overlying organic layers.15,18,47
Table 1.
XPS-determined elemental compositions for pure NTA and mixed NTA/OEG Monolayers.a
| molecules | theoretical atomic percentage | NTA surface concentration (NTA headgroups/nm2) | ||||||
|---|---|---|---|---|---|---|---|---|
| C 1s | O 1s | N 1s | S 2p | Au 4f | ||||
|
| ||||||||
| NTA thiol b | 67.4 | 25.6 | 4.7 | 2.4 | 0.0 | |||
| OEG thiol | 76.0 | 20.0 | 0.0 | 4.0 | 0.0 | |||
|
| ||||||||
| monolayers | Time in NTA thiol | Time in OEG thiol | experimental atomic percentagec(std dev) | |||||
| NTA a | 24hr | -- | 73.0 (0.3) | 21.4 (0.3) | 3.8 (0.1) | 1.8 (0.1) | 24.3 (0.6) | 1.9 |
| NTA b | 5min | -- | 77.0 (3.1) | 17.5 (2.4) | 4.2 (1.1) | 1.3 (0.3) | 30.8 (1.5) | 1.5 |
| OEG 1 | 5min | 0.5hr | 75.8 (3.9) | 20.0 (2.7) | 2.6 (1.2) | 1.6 (0.4) | 29.2 (0.6) | 1.3 |
| OEG 2 | 5min | 24hr | 78.9 (1.9) | 17.4 (1.5) | 1.8 (0.6) | 1.9 (0.1) | 25.7 (0.7) | 0.9 |
| OEG 3 | 5min | 48hr | 79.0 (0.7) | 17.2 (0.4) | 1.9 (0.3) | 1.9 (0.3) | 25.6 (0.4) | 0.9 |
| Pure OEG | -- | 24hr | 80.1 (1.7) | 16.8 (1.8) | nd | 3.1 (0.1) | 31.1 (0.7) | 0.0 |
All the data were taken at 0° take-off angle in the hybrid mode. The take-off angle is defined as the angle between the sample surface normal and the axis of the XPS analyzer lens
Chlorine Cl 2p was excluded to compare to the experimental values.
The gold atomic percent was calculated from all detected peaks (organic monolayer plus gold substrate). For the organic monolayer the gold substrate Au 4f signal was excluded to better show the elemental composition of the organic overlayers. The remaining signals from the organic monolayers were re-normalized to 100%.
nd: not detected
NTA a and NTA b were exposed to OEG diluent thiol for 0.5 hr to 48 hr. Composition trends observed suggests that the OEG thiol diluent produced different results for NTA a and NTA b. After exposure of NTA a to the OEG thiol, the elemental composition (data not shown), within experimental error, is unchanged suggesting that the OEG diluent thiol is not incorporated into the NTA a surface. After exposure of NTA b to OEG thiol for 0.5 hr (OEG 1) and 24 hr (OEG 2) the C and O concentrations were unchanged, within experimental error, while the N and Au concentrations decreased (see Table 1). Since N is unique to NTA molecules and attenuation of Au signal is related to monolayer thickness and density, the decease in both N and Au concentrations suggest that OEG thiols are incorporated into the NTA b surface. A similar trend was also observed in the short-term exposure of a DNA monolayer to a diluent thiol.39,48 However, further exposure of NTA b (e.g., 48hr) to the OEG diluent thiol does not result in additional changes to the monolayer composition. Based on the OEG backfill results and initial composition of the NTA a and NTA b monolayers, the NTA b monolayers appears to be more loosely packed, allowing the OEG thiol backfilling.
Pure NTA and mixed NTA/OEG monolayer structure determined by angle-dependent XPS
AD XPS was performed to determine the structure of the pure NTA and mixed NTA/OEG monolayers. The data acquired at three different take-off angles (0°, 55° and 75°) are summarized in Table 2. (Note: 0° take-off angle is normal to the detected surfaces and has the deepest sampling depth.) Nitrogen from the NTA headgroup, oxygen mainly from OEG chains, and sulfur from thiol anchors represent signals that can be used to determine the orientation of the NTA and OEG thiols in the pure and mixed monolayers. For pure OEG, the similar oxygen concentrations at all take-off angles indicate the OEG chains had a random and disordered distribution in the monolayer. NTA a and NTA b also show little variation in carbon, oxygen and nitrogen compositions with take-off angle, suggesting both the NTA headgroups and OEG chains have no preferred distributions in those monolayers. After OEG thiol backfilling into the NTA b both OEG 1 and OEG 2 exhibit increasing nitrogen concentrations with increasing take-off angle. This indicates the OEG thiol backfill aligned the NTA headgroups preferentially at the outermost surface of the monolayer. Compared to NTA b, a smaller decrease in sulfur concentration with increasing take-off angle was observed for the OEG 1 and OEG 2 monolayers. This suggests that in the mixed monolayers the sulfur atoms on the some of the OEG diluent thiols do not reach Au substrate.
Table 2.
Quantitative XPS analysis of pure NTA and NTA/OEG monolayers: elemental compositions for different take-off angles.a,b
| monolayer | take-off angle | time in NTA thiol | time in OEG thiol | atomic percentage (std dev) | |||
|---|---|---|---|---|---|---|---|
| C 1s | O 1s | N 1s | S 2p | ||||
| NTA a | 0° | 24hr | -- | 68.7 (0.7) | 25.5 (1.6) | 4.5 (0.7) | 1.3 (0.8) |
| 55° | 68.9 (1.0) | 25.0 (0.2) | 4.9 (0.7) | 1.2 (0.5) | |||
| 75° | 73.0 (1.4) | 22.0 (0.9) | 4.7 (0.7) | 0.3 (0.3) | |||
|
| |||||||
| NTA b | 0° | 5min | -- | 76.5 (3.5) | 19.9 (3.2) | 2.5 (0.8) | 1.1 (0.5) |
| 55° | 75.5 (3.1) | 21.1 (2.7) | 2.7 (0.7) | 0.7 (0.3) | |||
| 75° | 75.5 (3.1) | 20.7 (3.6) | 3.2 (0.1) | 0.6 (0.5) | |||
|
| |||||||
| OEG 1 | 0° | 5min | 0.5hr | 75.0 (1.7) | 23.0 (2.0) | 0.5 (0.3) | 1.5 (0.3) |
| 55° | 72.6 (1.3) | 24.0 (0.8) | 2.1 (0.4) | 1.3 (0.3) | |||
| 75° | 73.7 (1.9) | 23.1 (1.1) | 2.2 (0.3) | 1.0 (0.5) | |||
|
| |||||||
| OEG 2 | 0° | 5min | 24hr | 75.1 (1.3) | 22.1 (1.0) | 1.2 (0.3) | 1.6 (0.3) |
| 55° | 72.6 (2.0) | 24.2 (1.9) | 1.9 (0.7) | 1.3 (0.5) | |||
| 75° | 73.9 (0.3) | 22.2 (0.7) | 2.6 (0.5) | 1.3 (0.2) | |||
|
| |||||||
| Pure OEG | 0° | 0 | 24hr | 77.6 (1.4) | 20.2 (1.4) | nd | 2.1 (0.1) |
| 55° | 75.7 (1.2) | 22.5 (1.0) | nd | 1.8 (0.3) | |||
| 75° | 75.7 (0.4) | 22.8 (0.4) | nd | 1.6 (0.1) | |||
All the data were taken at 0°, 55° and 75° take-off angles in the electrostatic mode. The take-off angle is defined as the angle between the sample surface normal and the axis of the XPS analyzer lens
The gold substrate Au 4f signal was excluded to better show the elemental composition of the organic overlayers. The remaining signals from the organic SAM were re-normalized to 100%.
nd: not detected
Chemical environment of carbon and sulfur
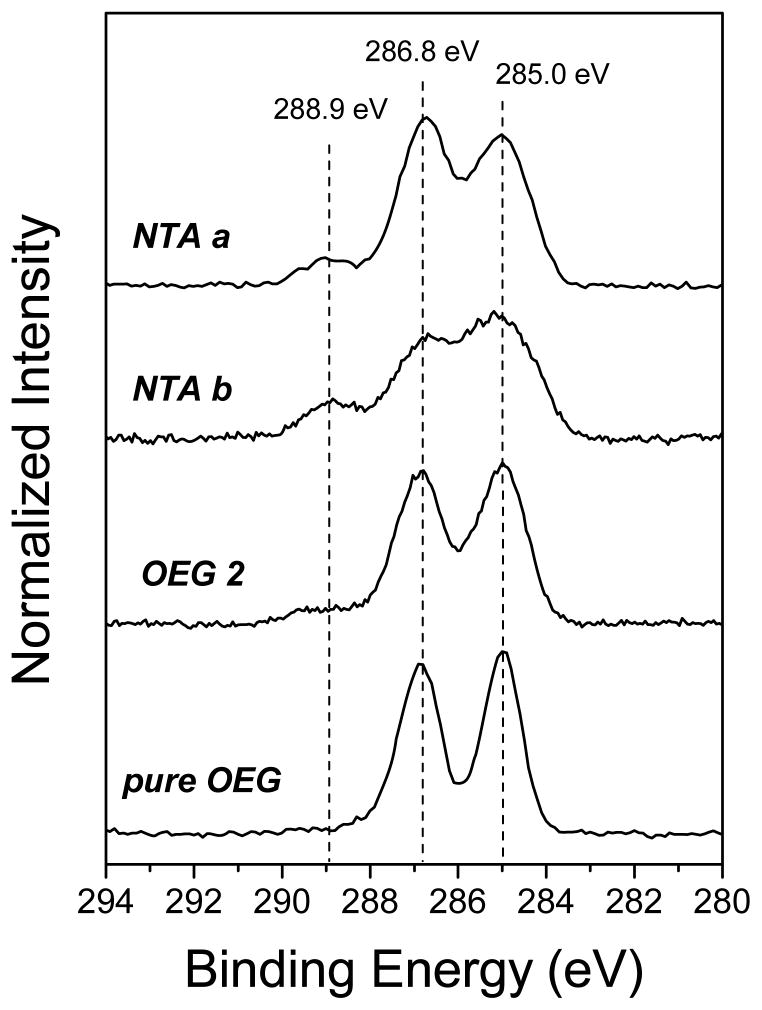
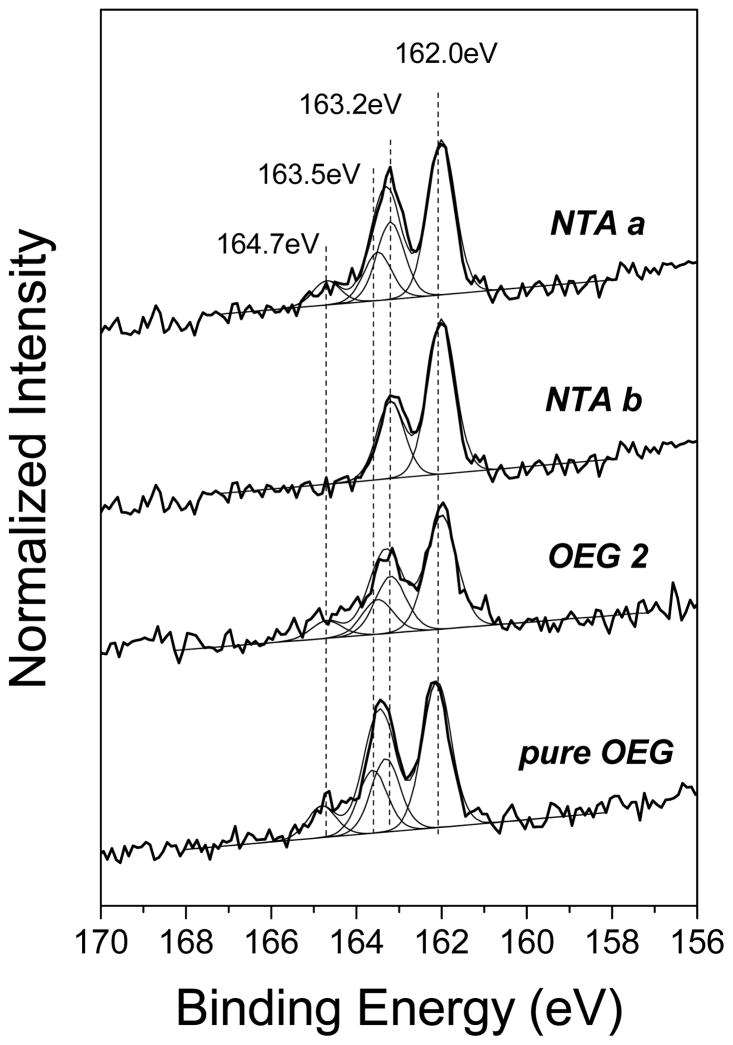
The typical high-resolution XPS C 1s spectra for pure NTA and mixed NTA/OEG monolayers at 0° take-off angle are shown in Figure 2 (a). The C 1s spectra of the pure NTA monolayers are fit with three peaks: 285 eV for C-C and C-H; 286.8 eV for C-O, C-N, C-S and the β-shifted carbons adjacent to carboxylate and amide; and 288.9 eV for N-(C=O) and C-(C=O) NTA species. (Note: since the number of C-O carbons is significantly greater than the C-N, C-S and β-shifted carbons in the pure and mixed NTA monolayers, a BE of 286.8 eV was observed for the this peak in all spectra.) The relative concentrations of the three carbon species are summarized in Table 3. The experimental C-C concentration is higher than the theoretical value, consistent with the excess carbon observed in Table 1. After the exposure of NTA b to the OEG diluent thiols, XPS C 1s spectra exhibit an increase in ether carbon and a decrease in NTA carbon species, indicating backfill of OEG thiol into the NTA b monolayer. As shown in Figure 2 (b), the high-resolution S 2p spectrum for NTA b exhibits a doublet with a S 2p3/2 at 162 eV, indicating NTA thiols were bound to Au substrate.49 After the addition of OEG diluent thiol, spectra show the presence of unbound sulfur in the 163 to 165 eV range, possibly due to incomplete rinsing of the sample surface or retention of physically adsorbed thiols.15,49
Figure 2.
High-resolution XPS C 1s (a) and S 2p (b) spectra for pure NTA (NTA a and NTA b) and mixed NTA/OEG monolayers on Au.
Table 3.
XPS high-resolution C 1s and S 2p chemical species for pure NTA and mixed NTA/OEG Monolayers on Au.a
| monolayer | time in NTA thiol | time in OEG thiol | carbon species percentage (std dev) | ||
|---|---|---|---|---|---|
| C-C, C-H | C-O,C-N, C-S, and β-shifted carbonsb | N-(C=O) and C-(C=O) | |||
| (285.0 eV) | (286.8 eV) | (288.9 eV) | |||
| theoretical carbon species percentages | |||||
| NTA thiol | 41.4 | 44.8 | 13.8 | ||
| OEG thiol | 50.0 | 50.0 | 0.0 | ||
|
| |||||
| experimental carbon species percentages | |||||
| NTA a | 24 hrs | -- | 47.9 (1.1) | 38.4 (0.9) | 13.7 (0.6) |
| NTA b | 5min | -- | 51.1 (0.7) | 36.4 (0.9) | 12.5 (1.1) |
| OEG 1 | 5min | 0.5 hr | 50.1 (0.7) | 42.0 (0.6) | 7.9 (0.9) |
| OEG 2 | 5min | 24 hrs | 48.3 (0.8) | 45.8 (0.3) | 5.9 (0.9) |
| Pure OEG | -- | 24 hrs | 48.6 (0.9) | 51.4 (0.9) | ndc |
All the data were taken at 0° take-off angle in the hybrid mode. The take-off angle is defined as the angle between the sample surface normal and the axis of the XPS analyzer lens
β-shifted carbon is C-(C=O)-N
nd: not detected
Surface concentration of NTA headgroups in pure NTA and mixed NTA/OEG monolayers
The surface concentration of the NTA thiol is estimated using the method published by Nelson et al.15 and the results are summarized in Table 1. Applying this method to the measured XPS compositions, we assume the molecular volume for NTA and OEG in the mixed monolayers was the same as the values in their respective pure monolayers. The density and molecular volume for the NTA and OEG molecules are calculated to be 0.019 molecules/Å2 (995 Å3/molecule) and 0.027 molecules/Å2 (523 Å3/molecule) in NTA a and pure OEG monolayers, respectively. This parameter for the OEG molecules is consistent with the previously reported values.15 Since nitrogen is unique to the NTA thiol, the nitrogen content is used to calculate surface concentration of NTA headgroups in the mixed NTA/OEG monolayers. The NTA concentration in the NTA b monolayer is calculated by the degree of attenuation of the substrate Au 4f XPS signal.18,29
Surface NTA concentrations were significantly affected by the self-assembly conditions of the NTA and OEG thiols. Maximum NTA concentration was observed to be 1.9 headgroup/nm2 in NTA a assembled for 24 hr, while a lower concentration was observed in NTA b assembled for 5 min. Surface NTA concentrations in the mixed NTA/OEG monolayers were a function of OEG thiol exposure time. As shown in the right column of Table 1, exposure in OEG thiol solution displaced NTA molecules with increasing backfill time, eventually reaching 0.9 headgroup/nm2 after 24 hrs.
B. ToF-SIMS Analysis of pure NTA and Mixed NTA/OEG Monolayers
PCA results
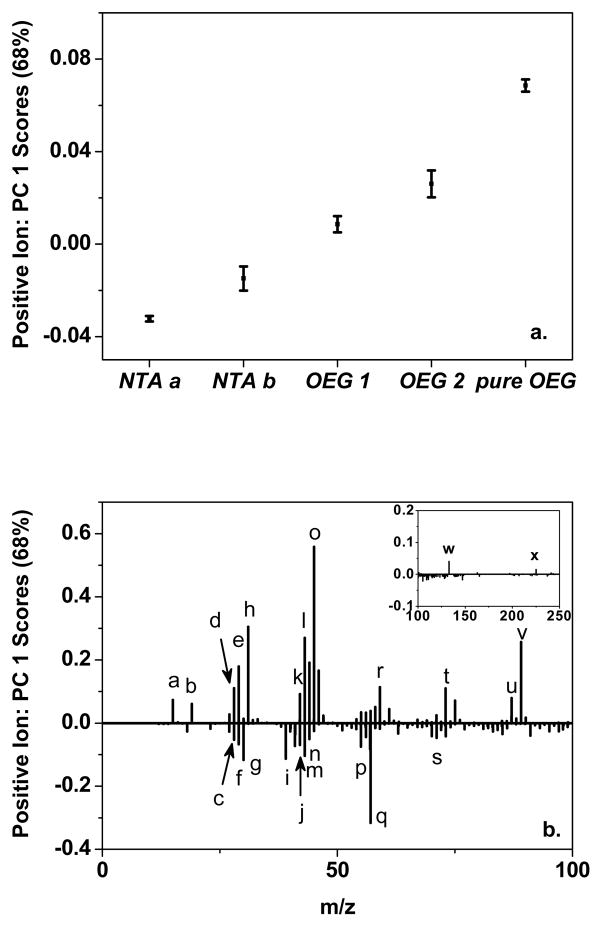
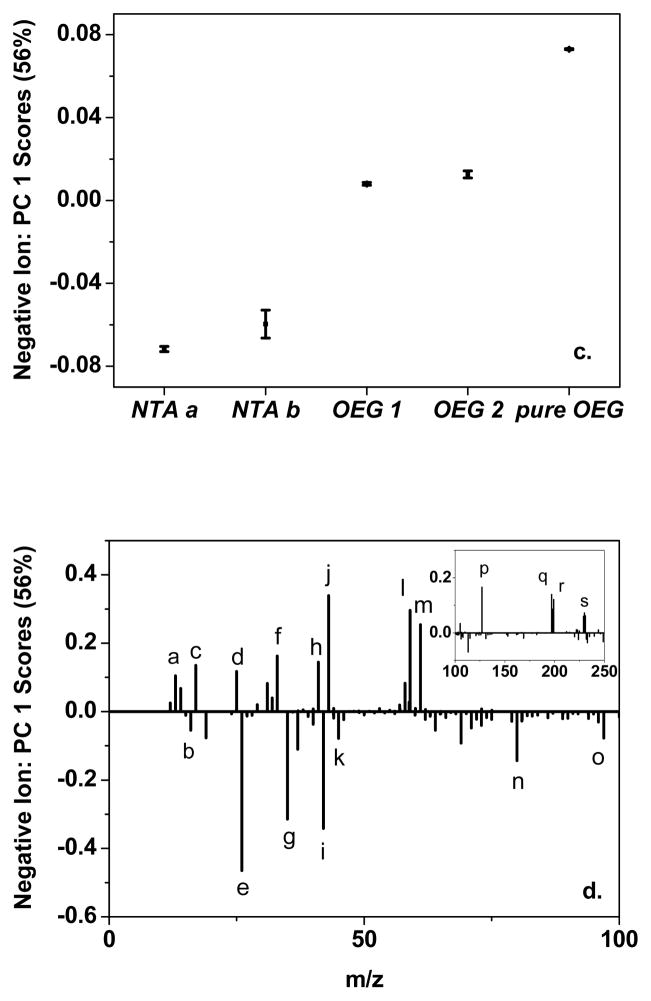
Pure NTA and mixed NTA/OEG monolayers were investigated with positive and negative ion ToF-SIMS. By applying PCA to the ToF-SIMS data, the spectral differences resulting from various self-assembly conditions can be determined. Figure 3 shows the Principal Component (PC) 1 (a) scores and (b) loadings for the positive ion spectra, and (c) scores and (d) loadings for the negative ion spectra. Table 4 summarizes the significant loadings from PCA for both positive ion and negative ion ToF-SIMS data for pure NTA and mixed NTA/OEG monolayers.
Figure 3.
PCA of the ToF-SIMS data. PC 1 (a) scores and (b) loadings from PCA of the positive ion spectra, and PC 1 (c) scores and (d) loadings from PCA of the negative ion spectra for pure NTA (NTA a and NTA b), 0.5-h backfilled NTA/OEG (OEG 1), 24-h backfill NTA/OEG (OEG 2), and pure OEG (pure OEG) self-assembled monolayers.
The labeled peaks were assigned in Table 4 for positive ion and negative ion spectra.
Table 4.
Significant loadings from PCA for both positive ion and negative ion ToF-SIMS data from pure NTA and mixed NTA/OEG monolayers.
| PC 1 (60%) positive ion ToF-SIMS data
| |
|---|---|
| Positively loaded peaks | 15: CH3+ (a); 19: H3O+ (b); 28: C2H4+ (d); |
| 29: CHO+ (e); 31: CH3O+ (h); 42: C3H6+ (k); | |
| 43: C2H3O+ (l); 45: C2H5O+ (o); | |
| 59: C3H7O+ (r); 73: C3H5O2+ (t); | |
| 87: C4H7O2+ (u); 89: C4H9O2+ (v); | |
| 133: Cs (w); 225: AuC2H4+ (x). | |
| Negatively loaded peaks | 28: CH2N+ (c); 29: C2H5+ (f); 30: CH4N+ (g); |
| 39: C3H3+ (i); 42: C2H4N+ (j); | |
| 43: C2H5N+ (m); 44: C2H6N+ (n); | |
| 55: C3H3O+ (p); 57: C4H9+ (q); | |
| 73: C4H11N+ (s). | |
|
| |
| PC 1 (70%) negative ion ToF-SIMS data | |
|
| |
| Positively loaded peaks | 13: CH− (a); 17: OH− (c); 25: C2H− (d); |
| 33: SH− (f); 41: C2HO− (h); 43: C2H3O− (j); | |
| 59: C2H3O2− (l); 61: C2H5O2− (m); 127: I− (p); | |
| 197: Au− (q); 199: AuH2− (r) | |
| Negatively loaded peaks | 16: O− (b); 26: CN− (e); 35: Cl− (g); |
| 42: CNO− (i); 45: CHO2− (k); 80: SO3− (n); | |
| 97: HSO4− (O); 230: AuSH− (s) | |
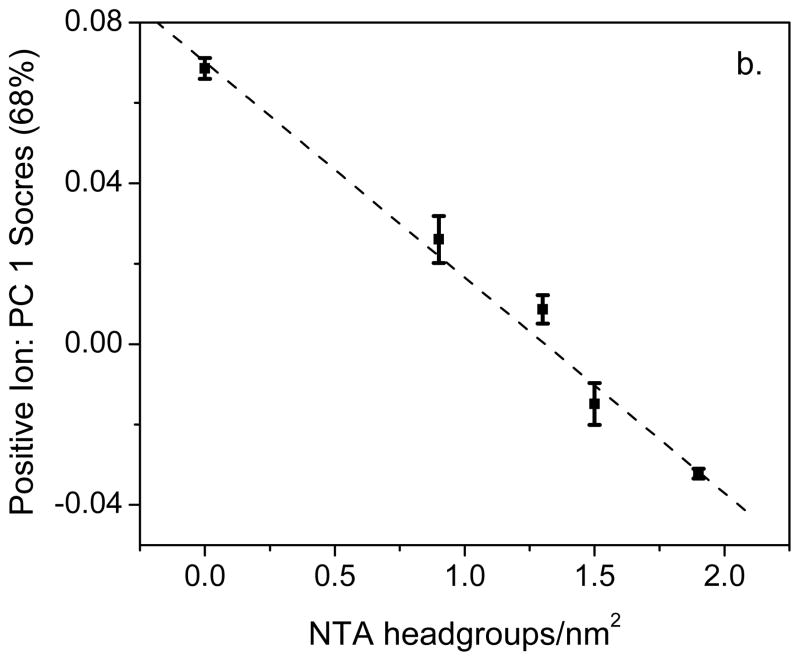
PC 1 captured 68% and 56% of total variance in the positive ion and negative ion spectra, respectively. Score trends observed in the plots suggest the various self-assembly conditions had significantly affected the surface structure. First, NTA b samples had higher positive ion PC 1 scores than NTA a, indicating spectra from pure NTA monolayer self-assembled for a short time are different from those self-assembled for a long time. Second, NTA monolayers after exposure to the OEG thiol for a half hour to one day had higher positive ion PC 1 scores than pure NTA monolayers, indicating OEG backfilling also affected the surface structure. The positive ion PC 1 scores continued to increase for the pure OEG samples, consistent with the trend of OEG backfilling. The negative ion PC 1 scores exhibited similar overall trends to the positive ion PC 1 scores, with the PC 1 score increasing with longer OEG exposure times.
Characteristic peaks analysis
For pure OEG, the characteristic OEG fragments (CH3O+ m/z 31, C2H3O+ m/z 43, C2H5O+ m/z 45, C3H7O+ m/z 59, C4H7O2+ m/z 87 and C4H9O2+ m/z 89) were present in positive ion spectra, consistent with previous ToF-SIMS studies for oligo(ethylene glycol) films.36,47,50–52 Compared to these studies, higher signals from several hydrocarbon fragments (e.g. CH3+ m/z 15, C2H5+ m/z 29, C3H7+ m/z 43, and C4H9+ m/z 57.) were observed. The alkane chain in the OEG thiol as well as adventitious hydrocarbon species probably account for the enhanced hydrocarbon fragments from the pure OEG monolayers. Because OEG and NTA thiols have a similar base chemical structure, i.e. OEG plus alkane chain, it is anticipated that the spectra for NTA-containing monolayer would exhibit many features observed in the pure OEG spectra. The OEG and hydrocarbon fragments were present in the NTA-containing monolayers. However, two major differences in both pure NTA and NTA/OEG monolayer from the pure OEG monolayers were observed. First, the positive spectra had a series of nitrogen-containing fragments (e.g. NH4+ m/z 18, CH2N+ m/z 28, CH4N+ m/z 30, C2H4N+ m/z 42, C3H6N+ m/z 56, C4H8N + m/z 70, and C5H8N+ m/z 82). This is due to the presence of nitrogen in NTA headgroups. In the negative spectra, several strong nitrogen-related fragments were also observed (CN−, CH2N− and CNO−). Second, some metal ions (e.g. K+, Fe+, Cu+) and anions (e.g. F−, Cl−, Br− and I−) were detected in the secondary ion spectra. These species probably originate from the synthesis and purification steps used to prepare the NTA and OEG thiols.6,27,53
Multivariate peak intensity ratio
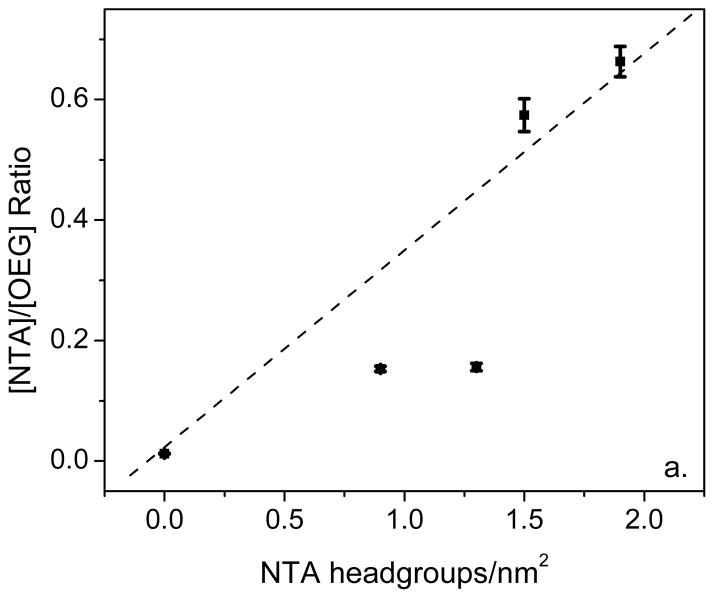
Using the positive ion PCA results, a multi-variate peak intensity ratio was developed to track the NTA concentration ([NTA]/[OEG] ratio). The NTA/OEG ratio represents the relative concentration of NTA headgroups in the film and is defined as:
where,
INTA–related+ = INH4+ + ICH2N+ + ICH4N+ + IC3H6N+ + IC4H8N+ + IC5H8N+
IOEG+= ICH3O+ + IC2H3O+ + IC2H5O+ + IC3H7O+ + IC4H7O2+ + IC4H9O2+
All intensities (Ix) were obtained from the secondary ion spectra.
The ToF-SIMS [NTA/OEG] ratios for pure NTA, mixed NTA/OEG and pure OEG monolayers are plotted versus the XPS-determined NTA headgroup concentration in Figure 4a. For comparison the positive secondary ion PC1 scores are plotted versus the XPS-determined NTA headgroup concentration in Figure 4b. Although the ToF-SIMS sampling depth is 1–2 nm, compared XPS sampling depth of 8–10 nm, when all peaks in the positive secondary ion spectra are used there is a linear relationship between the PC1 scores and XPS-determined NTA headgroup concentration. This is not case for the ToF-SIMS [NTA]/[OEG] ratio versus the XPS-determined NTA headgroup concentration, where the two NTA/OEG mixed monolayers have [NTA]/[OEG] ratios significantly below the linear relationship expected from the pure monolayer samples. There are two possible reasons why the [NTA]/[OEG] ratios for the NTA/OEG mixed monolayers do not follow a linear trend. First, hydrocarbon peaks that have strong negative PC1 loadings are not included in the [NTA]/[OEG] ratio since they are not unique to either the NTA or OEG thiols. However, they do account for some of the variation among the samples. Second, the emission of OEG-related fragments is not identical for the NTA and OEG thiols. For OEG thiols, many OEG fragments can be emitted by breaking just one bond in the OEG chain. In contrast, all OEG fragments emitted from the NTA thiol require breaking at least two bonds. Although there are situations where a multivariate peak ratio can properly track the surface concentration of a particular species (e.g., see reference 22), the results of the current study show it is always a good idea to examine the contributions of all peaks in the secondary ion spectra.
Figure 4.
(a) ToF-SIMS multivariate ratio ([NTA]/[OEG]) and (b) PC1 scores from the positive secondary ion spectra plotted versus the XPS-determined NTA headgroup concentrations for pure NTA (NTA a and NTA b), 0.5-h backfilled NTA/OEG (OEG 1), 24-h backfill NTA/OEG (OEG 2), and pure OEG (pure OEG) surfaces. Dotted lines representing a linear relationship between the ToF-SIMS and XPS results are included in both plots. See Table 1 for a listing of the NTA headgroup concentration for each surface.
C. NEXAFS Studies of pure NTA and Mixed NTA/OEG Monolayers
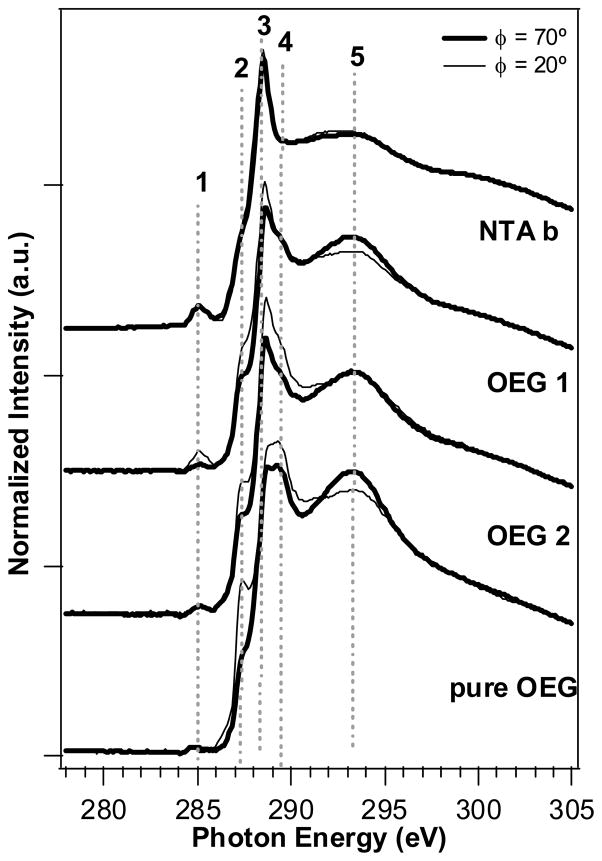
In this study, Carbon K-edge NEXAFS spectra of pure NTA, mixed NTA/OEG and pure OEG monolayers were collected at near normal (70°) and glancing angles (20°) to examine the effects of OEG backfill on the orientation and order of NTA surfaces. NEXAFS spectra for NTA b, OEG 1, OEG 2 and pure OEG are shown in Figure 5. A series of features are present in these C K-edge spectra. The small peak around 285.3 eV (labeled 1) appears to increase with increasing NTA on the surface. While there has been no reported NEXAFS of NTA, the NTA headgroup is a highly conjugated system and it is possible that the peak at 285.3 eV may be due to a transition into the C=C π* orbitals of this headgroup. However, a peak at this energy has also been reported as due to X-ray beam damage of carbon-containing organics.19 It is possible that the NTA group is more easily damaged by the incident X-ray beam and this peak is evidence of more damage seen due to the presence of more NTA groups on the surface. A shoulder peak at 287.6 eV (labeled 2) is associated with the transition to the C-H* orbital of the alkane chains.15,19 The polarization dependence of this peak is gradually enhanced with the prolonged exposure to OEG thiol and reaches a maximum in the pure OEG monolayers. This suggests the C-H bonds are oriented nominally parallel to the surface (i.e, the alkane chains are oriented on average upright on the surface). The peaks between ~288.5 – 290 eV (between labels 3 and 4) are likely due to a combination features including a broad step due to the ionization potentials of the different carbon atoms54, transition into C-H* bonds found in the NTA and OEG groups, as well as a small contribution from the C1s → π*C=O transition.55 The feature at 293 eV (labeled 5) can be assigned to a transition into the C-C σ* or C-O σ* orbitals.19,55 This feature is enhanced at glancing angle with OEG thiol backfill, indicating the C-C bond is on average at a nominal upright orientation on the surface with increasing exposure time to the OEG thiol. The polarization dependence of the alkane C-H orbitals (labeled 2) and σ*C-C (labeled 5) is consistent with an increase in the ordering of the hydrocarbon portion of the OEG and NTA thiols with increasing incorporation of the OEG thiol and are similar to results reported by Zwahlen et al.19 for a similar ethylene glycol SAM on gold.
Figure 5.
Carbon K-edge NEXAFS spectra from pure NTA (NTA b), mixed NTA/OEG (OEG 1 and OEG 2) and pure OEG (pure OEG) monolayers on gold at near normal (70°) and glancing (20°) incident X-ray angles. The polarization dependence seen for peak 2 of the pure OEG is consistent with ordering of the hydrocarbon chain of the OEG molecule.
D. SPR Measurement of his-tagged HuLys Fv adsorption onto of pure NTA and Mixed NTA/OEG Monolayers
The NTA-containing monolayers, when complexed with Ni (II), specifically immobilize a his-tagged protein while resisting nonspecific adsorption. SPR biosensing was used to measure in situ the site-specific and reversible immobilization of the his-tagged HuLys Fv. This protein was genetically fused with a hexahistidine at the C-terminus of the heavy chain.34
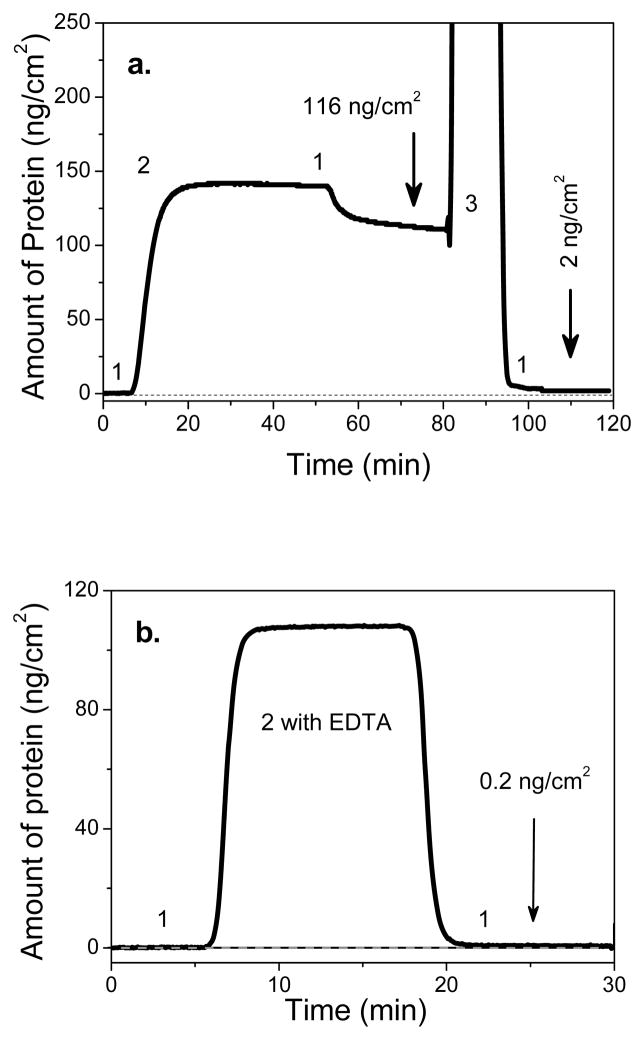
Figure 6 (a) shows a SPR sensogram demonstrating the specific and reversible adsorption for his-tagged HuLys Fv to the OEG 2 monolayer. For the Ni-pretreated surfaces, his-tagged HuLys Fv adsorption produced a significant SPR response, corresponding on average to 108 ± 11 ng/cm2 of adsorbed protein. When the imidazole solution was exposed to the protein film, the SPR signal dropped back close to the original buffer baseline. This shows his-tagged HuLys Fv was almost completely removed from the NTA/OEG surface. The amount of specifically bound protein was determined by subtracting the amount of protein remaining following imidazole injection from the amount bound just prior imidazole injection. The amount of nonspecifically bound protein is the amount remaining after the imidazole injection.
Figure 6.
SPR measurement of his-tagged HuLys (200nM in PBS buffer) adsorption onto (a) nickel-treated OEG 2 and (b) OEG 2 without nickel treatment in presence of 20mM EDTA. 1. PBS; 2. his-tagged HuLys Fv (200nM) and 3. imidazole (1M). Data indicate that the adsorption of his-tagged HuLys on nickel-treated NTA/OEG monolayer is site-specific and reversible. (c) The experimental and calculated dissociation curves for removal of the specifically-bound, his-tagged HuLys Fv protein from the nickel-treated OEG 2 surface.
As a control experiment, the nonspecific adsorption of his-tagged HuLys Fv to OEG 2 without nickel activation was studied in the presence of EDTA. The SPR sensogram in Figure 6 (b) demonstrates that OEG 2 effectively resist the nonspecific adsorption of his-tagged HuLys if potential metal ion impurities in the protein solution are scavenged by EDTA. (Note: metal ions are easily trapped during protein purification since the hexahistidine can chelate them.) In contrast to the Ni-treated surface, there was no detectable binding between his-tagged HuLys Fv (200 nM) and the non Ni-treated surface (SPR detection limits are approximately 0.2 ng/cm2). Additionally, pure OEG monolayers resist protein nonspecific adsorption (<2ng/cm2) as expected. Taken together, SPR results indicate that the adsorption of his-tagged HuLys Fv onto the NTA/OEG monolayer is due to the affinity of the histag to the Ni-NTA complex.
Table 5 compares the amount of specifically bound, nonspecifically bound protein and dissociation rates for his-tagged HuLys Fv on pure NTA and mixed NTA/OEG monolayers. It indicates NTA a monolayers exhibit the highest specific protein binding capacity and nonspecific protein binding capacities comparable to the mixed NTA/OEG monolayers. Both pure NTA monolayers had slower dissociation rates than the mixed NTA/OEG monolayers. NTA b monolayers exhibit the largest amount of nonspecific bound protein adsorption. Since NTA b monolayers are more loosely packed than the NTA a monolayers and have lower OEG concentrations than both mixed NTA/OEG monolayers, it is not surprising that the NTA b monolayers have the largest amount of nonspecifically bound protein.
Table 5.
Quantities of specific and nonspecific adsorption along with dissociation rates for his-tagged HuLys Fv bound to pure NTA and mixed NTA/OEG monolayers.
| monolayers | specific bound* ng/cm2 (std dev) | nonspecific bound ng/cm2 (std dev) | dissociation rate s−1 (std dev) |
|---|---|---|---|
| NTA a | 205 (10) | 6 (1) | 2.1x10⁻⁵ (7.9x10⁻⁶) |
| NTA b | 76 (26) | 64 (18) | 2.3x10⁻⁵ (8.0x10⁻⁶) |
| OEG 1 | 122 (12) | 3 (2) | 1.0x10⁻⁴ (8.5x10⁻⁶) |
| OEG 2 | 108 (11) | 4 (3) | 1.8x10⁻⁴ (4.1x10⁻⁵) |
The amount of specifically bound protein was determined by subtracting the amount of protein remaining following imidazole injection from the amount bound just prior imidazole injection. The remainder is the amount that absorbed nonspecifically.
How a biomolecule is presented at a surface and its reactivity are often correlated with the surface concentration of self-assembled molecules. For example, both Gong et al. and Lee et al. 39,48,56 observed that DNA hybridization and target capture efficiency was significantly affected by the density of the immobilized DNA probe molecules. In our studies, the reversible and specific adsorption of his-tagged HuLys is correlated with the surface concentration of NTA headgroups. The NTA concentrations in NTA a, OEG 1 and OEG 2 monolayers, as determined by XPS, were approximately 1.9, 1.3 and 0.9 molecule/nm2, respectively. Taking into account the protein molecular dimensions57 (4.8 nm x 3.0 nm) in the “lysozyme-binding-domain up” orientation, the pure and mixed NTA/OEG monolayers bind one his-tagged HuLys Fv for approximately every 27, 19 and 13 NTA molecules, respectively. The amount of bound his-tagged protein was approximately 2 times higher on the pure NTA a monolayers, while the dissociation rate was an order of magnitude slower, compared to the mixed NTA/OEG monolayers. Schmid et al.58 showed surfaces that had an NTA surface density similar to the size of a his-tagged Green Fluorescent protein (i.e., close to 1:1 ratio of NTA to his-tagged protein) had a dissociation rate (10−3 s−1) that was an order of magnitude faster than the mixed NTA/OEG monolayers in this study. This suggests that the dissociation rate is strongly dependent upon the number of NTA groups available per his-tagged protein.
NTA headgroups are widely used as metal-affinity ligands to anchor his-tagged proteins onto surfaces in academic and commercial applications.27,40,53 The addition of NTA headgroups onto surfaces (e.g. Biacore Chip NTA) has been done by grafting (1S)-N-(5-amino-1-carboxypentyl)iminodiacetic acid (NTA-NH2) via amine-reactive chemistry. A drawback for these NTA-incorporated surfaces is the fast dissociation of the his-tagged proteins under the flow assay condition.40,58 One possible explanation is these surfaces have a low NTA surface concentration. If so, one way to improve the protein binding stability would be to increase the local NTA surface concentration. The coupling of multivalent NTA heads on the surface, as done by Piehler et al.,59–61 and Huang et al.,41 significant stabilized the his-tagged protein binding.
Conclusions
The composition, structure, and order of self-assembled monolayers designed for the controllable immobilization of his-tagged proteins have been characterized with XPS, ToF-SIMS, NEXAFS and SPR. At short assembly times, the NTA thiols did not form complete, ordered monolayers as demonstrated by the ADXPS and NEXAFS experiments. Exposing this surface to OEG thiols resulted in the incorporation of the OEG into the loosely packed NTA monolayer forming a mixed NTA/OEG monolayer. The backfill of the OEG diluent thiol into the NTA films improved the orientation of NTA headgroup and increased the order within the hydrocarbon region of the monolayer. SPR showed that the maximum specific binding with slow dissociation rate of his-tagged protein was achieved on the highly packed pure NTA monolayer, after which the amount of specific binding decreased due to significant OEG dilution of the NTA headgroups. Both specific binding and dissociation rate for his-tagged protein are dependent on the NTA surface concentration. Our study clarifies the relationship between the specificity of his-tagged protein binding and the surface structure and properties. The results from this study provide detailed information and characterization methods that can be used to design novel bioactive films for controllable immobilization of proteins.
Acknowledgments
This research was supported by the National ESCA and Surface Analysis Center for Biomedical Problems (NIH grant EB-002027). Drs. Richard To, Chi-Ying Lee, Nan Xia and Jim Hull are thanked for helpful discussions on protein expression, SPR biosensing, ToF-SIMS analysis and PCA. Dr. Daniel Fischer is thanked for his technical assistant with the NEXAFS experiments. The NEXAFS studies were performed at the NSLS, Brookhaven National Laboratory, which is supported by the U.S. Department of Energy, Division of Materials Science and Division of Chemical Sciences.
References
- 1.Ratner BD, Bryant SJ. Annu Rev Biomed Eng. 2004;6:41–75. doi: 10.1146/annurev.bioeng.6.040803.140027. [DOI] [PubMed] [Google Scholar]
- 2.Castner DG, Ratner BD. Surf Sci. 2002;500:28–60. [Google Scholar]
- 3.Mrksich M, Whitesides GM. Annu Rev Biophys Biomol Struct. 1996;25:55–78. doi: 10.1146/annurev.bb.25.060196.000415. [DOI] [PubMed] [Google Scholar]
- 4.Boozer C, Ladd J, Chen SF, Jiang S. Anal Chem. 2006;78:1515–1519. doi: 10.1021/ac051923l. [DOI] [PubMed] [Google Scholar]
- 5.Boozer C, Ladd J, Chen SF, Yu Q, Homola J, Jiang S. Anal Chem. 2004;76:6967–6972. doi: 10.1021/ac048908l. [DOI] [PubMed] [Google Scholar]
- 6.Luk YY, Tingey ML, Hall DJ, Israel BA, Murphy CJ, Bertics PJ, Abbott NL. Langmuir. 2003;19:1671–1680. [Google Scholar]
- 7.Lee JE, Saavedra SS. Langmuir. 1996;12:4025–4032. [Google Scholar]
- 8.Edmiston PL, Wambolt CL, Smith MK, Saavedra SS. J Colloid Interface Sci. 1994;163:395–406. [Google Scholar]
- 9.Soellner MB, Dickson KA, Nilsson BL, Raines RT. J Am Chem Soc. 2003;125:11790–11791. doi: 10.1021/ja036712h. [DOI] [PubMed] [Google Scholar]
- 10.Huang W, Wang JQ, Bhattacharyya D, Bachas LG. Anal Chem. 1997;69:4601–4607. doi: 10.1021/ac970390g. [DOI] [PubMed] [Google Scholar]
- 11.Nam JM, Han SW, Lee KB, Liu XG, Ratner MA, Mirkin CA. Angew Chem Int Ed. 2004;43:1246–1249. doi: 10.1002/anie.200353203. [DOI] [PubMed] [Google Scholar]
- 12.Wegner GJ, Lee NJ, Marriott G, Corn RM. Anal Chem. 2003;75:4740–4746. doi: 10.1021/ac0344438. [DOI] [PubMed] [Google Scholar]
- 13.Kim HD, Nienhaus GU, Ha T, Orr JW, Williamson JR, Chu S. Proc Nat Acad Sci USA. 2002;99:4284–4289. doi: 10.1073/pnas.032077799. [DOI] [PMC free article] [PubMed] [Google Scholar]
- 14.Turkova J. J Chromatogr B. 1999;722:11–31. doi: 10.1016/s0378-4347(98)00434-4. [DOI] [PubMed] [Google Scholar]
- 15.Nelson KE, Gamble L, Jung LS, Boeckl MS, Naeemi E, Golledge SL, Sasaki T, Castner DG, Campbell CT, Stayton PS. Langmuir. 2001;17:2807–2816. [Google Scholar]
- 16.Jung LS, Nelson KE, Stayton PS, Campbell CT. Langmuir. 2000;16:9421–9432. [Google Scholar]
- 17.Herrwerth S, Eck W, Reinhardt S, Grunze M. J Am Chem Soc. 2003;125:9359–9366. doi: 10.1021/ja034820y. [DOI] [PubMed] [Google Scholar]
- 18.Harder P, Grunze M, Dahint R, Whitesides GM, Laibinis PE. J Phys Chem B. 1998;102:426–436. [Google Scholar]
- 19.Zwahlen M, Herrwerth S, Eck W, Grunze M, Hahner G. Langmuir. 2003;19:9305–9310. [Google Scholar]
- 20.Love JC, Estroff LA, Kriebel JK, Nuzzo RG, Whitesides GM. Chem Rev. 2005;105:1103–1169. doi: 10.1021/cr0300789. [DOI] [PubMed] [Google Scholar]
- 21.Ferretti S, Paynter S, Russell DA, Sapsford KE, Richardson DJ. Trac-Trends In Analytical Chemistry. 2000;19:530–540. [Google Scholar]
- 22.Cheng F, Gamble LJ, Grainger DW, Castner DG. Anal Chem. 2007;79:8781–8788. doi: 10.1021/ac0715423. [DOI] [PMC free article] [PubMed] [Google Scholar]
- 23.Rigler P, Ulrich WP, Hoffmann P, Mayer M, Vogel H. Chem phys chem. 2003;4:268–275. doi: 10.1002/cphc.200390043. [DOI] [PubMed] [Google Scholar]
- 24.Kroger D, Liley M, Schiweck W, Skerra A, Vogel H. Biosens Bioelectron. 1999;14:155–161. doi: 10.1016/s0956-5663(98)00116-x. [DOI] [PubMed] [Google Scholar]
- 25.Ataka K, Richter B, Heberle J. J Phys Chem B. 2006;110:9339–9347. doi: 10.1021/jp0534131. [DOI] [PubMed] [Google Scholar]
- 26.Ataka K, Giess F, Knoll W, Naumann R, Haber-Pohlmeier S, Richter B, Heberle J. J Am Chem Soc. 2004;126:16199–16206. doi: 10.1021/ja045951h. [DOI] [PubMed] [Google Scholar]
- 27.Sigal GB, Bamdad C, Barberis A, Strominger J, Whitesides GM. Anal Chem. 1996;68:490–497. doi: 10.1021/ac9504023. [DOI] [PubMed] [Google Scholar]
- 28.Du Roure O, Debiemme-Chouvy C, Malthete J, Silberzan P. Langmuir. 2003;19:4138–4143. [Google Scholar]
- 29.Lee JK, Kim YG, Chi YS, Yun WS, Choi IS. J Phys Chem B. 2004;108:7665–7673. [Google Scholar]
- 30.Chen HM, Wang WC, Chen SH. Biotechnol Progr. 2004;20:1237–1244. doi: 10.1021/bp049968f. [DOI] [PubMed] [Google Scholar]
- 31.Blankespoor R, Limoges B, Schollhorn B, Syssa-Magale JL, Yazidi D. Langmuir. 2005;21:3362–3375. doi: 10.1021/la047139y. [DOI] [PubMed] [Google Scholar]
- 32.Berquand A, Xia N, Castner DG, Clare BH, Abbott NL, Dupres V, Adriaensen Y, Dufrene YF. Langmuir. 2005;21:5517–5523. doi: 10.1021/la050162e. [DOI] [PubMed] [Google Scholar]
- 33.Holmes MA, Foote J. J Immunol. 1997;158:2192–2201. [PubMed] [Google Scholar]
- 34.Fong RB, Ding ZL, Hoffman AS, Stayton PS. Biotechnol Bioeng. 2002;79:271–276. doi: 10.1002/bit.10315. [DOI] [PubMed] [Google Scholar]
- 35.Belu AM, Graham DJ, Castner DG. Biomaterials. 2003;24:3635–3653. doi: 10.1016/s0142-9612(03)00159-5. [DOI] [PubMed] [Google Scholar]
- 36.Wagner MS, Pasche S, Castner DG, Textor M. Anal Chem. 2004;76:1483–1492. doi: 10.1021/ac034873y. [DOI] [PubMed] [Google Scholar]
- 37.Wagner MS, Castner DG. Langmuir. 2001;17:4649–4660. [Google Scholar]
- 38.Samuel NT, Lee CY, Gamble LJ, Fischer DA, Castner DG. J Electron Spectrosc Relat Phenom. 2006;152:134–142. [Google Scholar]
- 39.Lee CY, Gong P, Harbers GM, Grainger DW, Castner DG, Gamble LJ. Anal Chem. 2006;78:3316–3325. doi: 10.1021/ac052137j. [DOI] [PubMed] [Google Scholar]
- 40.Nieba L, NiebaAxmann SE, Persson A, Hamalainen M, Edebratt F, Hansson A, Lidholm J, Magnusson K, Karlsson AF, Pluckthun A. Anal Biochem. 1997;252:217–228. doi: 10.1006/abio.1997.2326. [DOI] [PubMed] [Google Scholar]
- 41.Huang ZH, Park JI, Watson DS, Hwang P, Szoka FC. Bioconjugate Chem. 2006;17:1592–1600. doi: 10.1021/bc0602228. [DOI] [PubMed] [Google Scholar]
- 42.Schuck P. Curr Opin Biotechnol. 1997;8:498–502. doi: 10.1016/s0958-1669(97)80074-2. [DOI] [PubMed] [Google Scholar]
- 43.Jung LS, Campbell CT, Chinowsky TM, Mar MN, Yee SS. Langmuir. 1998;14:5636–5648. [Google Scholar]
- 44.Jung LS, Shumaker-Parry JS, Campbell CT, Yee SS, Gelb MH. J Am Chem Soc. 2000;122:4177–4184. [Google Scholar]
- 45.Homola J, Yee SS, Gauglitz G. Sens Actuators, B. 1999;54:3–15. [Google Scholar]
- 46.Homola J. Sens Actuators, B. 1997;41:207–211. [Google Scholar]
- 47.Xia N, Hu YH, Grainger DW, Castner DG. Langmuir. 2002;18:3255–3262. [Google Scholar]
- 48.Lee CH, Gamble L, Grainger DW, Castner DG. Biointerphases J (USA) 2006;1:82–92. doi: 10.1116/1.2219110. [DOI] [PubMed] [Google Scholar]
- 49.Castner DG, Hinds K, Grainger DW. Langmuir. 1996;12:5083–5086. [Google Scholar]
- 50.Lu HB, Campbell CT, Castner DG. Langmuir. 2000;16:1711–1718. [Google Scholar]
- 51.Shen MC, Martinson L, Wagner MS, Castner DG, Ratner BD, Horbett TA. J Biomater Sci, Polym Ed. 2002;13:367–390. doi: 10.1163/156856202320253910. [DOI] [PubMed] [Google Scholar]
- 52.Shen MC, Wagner MS, Castner DG, Ratner BD, Horbett TA. Langmuir. 2003;19:1692–1699. [Google Scholar]
- 53.Hochuli E, Dobeli H, Schacher A. J Chromatogr. 1987;411:177–184. doi: 10.1016/s0021-9673(00)93969-4. [DOI] [PubMed] [Google Scholar]
- 54.Stohr J. NEXAFS Spectroscopy. Vol. 25 Springer; New York: 1992. [Google Scholar]
- 55.Urquhart SG, Hitchcock AP, Priester RD, Rightor EG. J Polym Sci, Polym Phys. 1995;33:1603–1620. [Google Scholar]
- 56.Gong P, Lee CY, Gamble LJ, Castner DG, Grainger DW. Anal Chem. 2006;78:3326–3334. doi: 10.1021/ac052137j. [DOI] [PMC free article] [PubMed] [Google Scholar]
- 57.Protein Data Bank-ID:1BVL http://www.rcsb.org/pdb.
- 58.Schmid EL, Keller TA, Dienes Z, Vogel H. Anal Chem. 1997;69:1979–1985. doi: 10.1021/ac9700033. [DOI] [PubMed] [Google Scholar]
- 59.Lata S, Reichel A, Brock R, Tampe R, Piehler J. J Am Chem Soc. 2005;127:10205–10215. doi: 10.1021/ja050690c. [DOI] [PubMed] [Google Scholar]
- 60.Tinazli A, Tang JL, Valiokas R, Picuric S, Lata S, Piehler J, Liedberg B, Tampe R. Chem Eur J. 2005;11:5249–5259. doi: 10.1002/chem.200500154. [DOI] [PubMed] [Google Scholar]
- 61.Lata S, Piehler J. Anal Chem. 2005;77:1096–1105. doi: 10.1021/ac048813j. [DOI] [PubMed] [Google Scholar]


