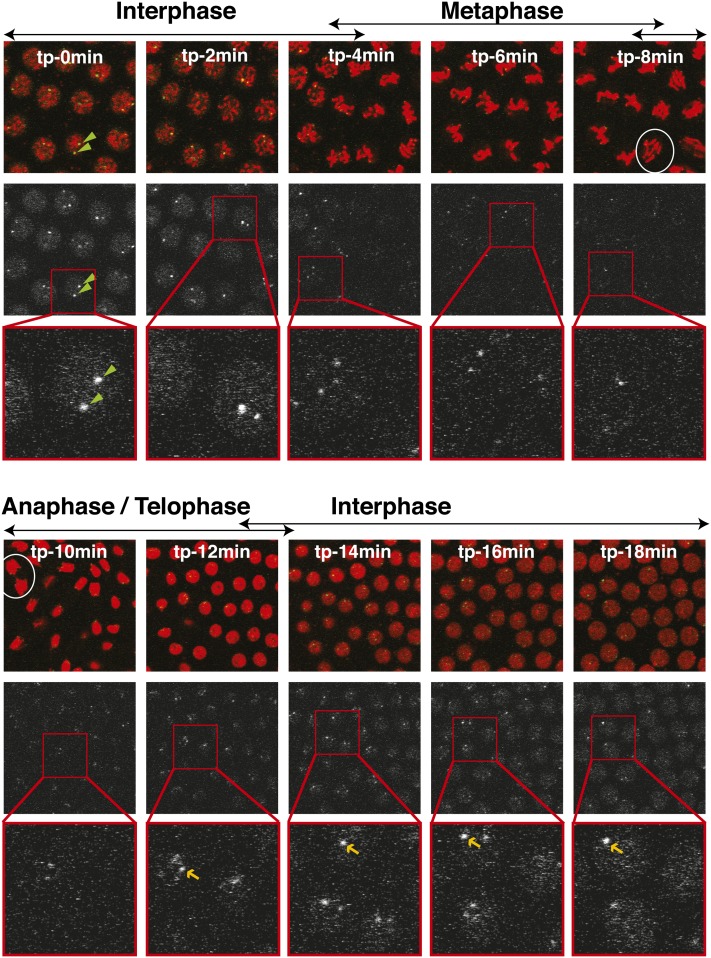
Figure 2.
Telomere signal throughout the cell cycle. Panels represent a time-lapse series in a syncytial blastoderm embryo. Each time point, labeled with its corresponding time (from tp-0min to tp-18min), shows three panels: top, merged image of EGFP-HOAP (green) and H2Av-mRFP (red); middle, EGFP-HOAP signal alone (white); and bottom, zoom-in of the EGFP signal from the area in the red square from the middle panel. Cell cycle stages deduced from chromatin characteristics are shown above the merged image. Green arrowheads within panels for tp-0min point to two telomeric foci. White ovals label two anaphase figures (tp-8min and tp-10min). Yellow arrows point out the telomeric foci that allow one to observe the increase of telomeric signal over time (from tp-12min to tp-18min).

