

Abstract
The gene encoding EWS (EWSR1) is involved in various chromosomal translocations that cause the production of oncoproteins responsible for multiple cancers including Ewing sarcoma, myxoid liposarcoma, soft tissue clear cell sarcoma, and desmoplastic small round cell sarcoma. It is well known that EWS fuses to FLI to create EWS/FLI, which is the abnormal transcription factor that drives tumor development in Ewing sarcoma. However, the role of wild-type EWS in Ewing sarcoma pathogenesis remains unclear. In the current study, we identified EWS-regulated genes and cellular processes through RNA interference combined with RNA sequencing and functional annotation analyses. Interestingly, we found that EWS and EWS/FLI co-regulate a significant cluster of genes, indicating an interplay between the 2 proteins in regulating cellular functions. We found that among the EWS–down-regulated genes are a subset of neuronal genes that contain binding sites for the RE1-silencing transcription factor (REST or neuron-restrictive silencer factor [NRSF]), neuron-restrictive silencer element (NRSE), suggesting a cooperative interaction between REST and EWS in gene regulation. Co-immunoprecipitation analysis demonstrated that EWS interacts directly with REST. Genome-wide binding analysis showed that EWS binds chromatin at or near NRSE. Furthermore, functional studies revealed that both EWS and REST inhibit neuronal phenotype development and oncogenic transformation in Ewing sarcoma cells. Our data implicate an important role of EWS in the development of Ewing sarcoma phenotype and highlight a potential value in modulating EWS function in the treatment of Ewing sarcoma and other EWS translocation–based cancers.
Keywords: EWS, REST, oncogenic transformation, neuronal phenotype, Ewing sarcoma
Introduction
Ewing sarcoma is a translocation-based pediatric bone and soft tissue tumor. In most Ewing sarcoma cases, translocation causes a fusion between the EWSR1 gene (encoding EWS) and the FLI1 gene (encoding FLI) and gives rise to the fusion protein EWS/FLI. It is well known that EWS/FLI functions as an aberrant transcription factor to deregulate the expression of target genes and promote tumor development.1-3 In addition to the gain of function of EWS/FLI, translocation also results in the loss of 1 EWSR1 allele. In fact, a case of Ewing sarcoma with both copies of EWSR1 translocated, and therefore no wild-type EWS expression, has been reported,4 suggesting that EWS is dispensable for tumor growth. However, EWS function is disrupted or insufficient in several EWS translocation–based cancers, indicating that EWS may contribute to the suppression of cancer-related phenotypes. So far, little is known about the role of EWS, if any, in regulating cancer-related phenotypes.
In general, EWS is an RNA-binding protein and has been implicated in transcription regulation and RNA processing.5 EWS interacts with RNA polymerase II and the TFIID transcription preinitiation complex. EWS co-transcriptionally binds to its target mRNA and regulates the alternative splicing or exon skipping of genes involved in DNA repair and related signaling upon cellular stress.6,7 In addition, EWS binds to noncoding RNA and inhibits the histone acetyltransferase (HAT) activity of CBP/p300 on a repressed gene target, CCND1, upon radiation.8 Recently, EWS was found to be associated with RNA granules under genotoxic stress.9,10 Most of the above known EWS functions are characterized under conditions of cellular stress in non–Ewing sarcoma settings. Notably in Ewing sarcoma, EWS co-exists with EWS/FLI, which has been shown to bind EWS and interfere with EWS-mediated transcription regulation and splicing in a dominant-negative manner.11-13 However, neither the function of EWS nor the relationship between EWS and EWS/FLI in Ewing sarcoma is well defined.
Interesting neuronal features have been identified in Ewing sarcoma cells and tumors, such as the presence of Homer-Wright rosettes, neural processes, neurosecretory granules, and neural immunohistochemical markers.14,15 It has been suggested that the neural phenotype of Ewing sarcoma may be a consequence of the translocation and resultant expression of EWS/FLI because the introduction of EWS/FLI into NIH3T3 or rhabdomyosarcoma RD cells induces the features of neural differentiation.16,17 However, Ewing sarcoma and peripheral primitive neuroectodermal tumor (pPNET), which contain the same t(11;22)(q24;q12) translocation18-20 and represent the same disease, exhibit varying levels of neural differentiation. This suggests that other modulators may exist to regulate the neuronal phenotype in Ewing sarcoma.
RE1-silencing transcription factor (REST or neuron-restrictive silencer factor [NRSF]) is a transcription repressor that has diverse functions in a context-dependent manner through interactions with distinct co-factors.21-23 REST was originally found to repress neuronal gene expression in nonneuronal cells.21 It is now widely recognized that REST also plays a role in tumorigenesis.24-27 REST was identified as a tumor suppressor in an RNA interference (RNAi)–based genetic screen in epithelial cells using an in vitro breast cancer precursor model.24 Later studies revealed that REST is frequently deleted in colon and small cell lung cancers,24,25 supporting a role for this transcription repressor as a tumor suppressor. In breast cancer, a nonfunctional, truncated splice variant of REST was identified in some tumor subtypes, and expression of this truncated variant of REST was shown to correlate with poor prognosis.28 Interestingly, these REST-deficient tumors acquire certain neuronal phenotypes such as the expression of neuronal genes that are normally not expressed outside the nervous system.24,25
In this article, we sought to characterize the function of EWS in Ewing sarcoma and found that EWS contributes to cancer phenotypes in that EWS cooperates with REST to repress neuronal phenotype development and EWS and REST inhibit oncogenic transformation in Ewing sarcoma cells.
Results
Identification of EWS-regulated genes and cellular processes in Ewing sarcoma
To characterize the function of EWS in Ewing sarcoma, we silenced EWS in A673 Ewing sarcoma cells (Fig. 1A) and performed high-throughput sequencing of RNA (RNA-seq) from control (luciferase) or EWS knockdown cells to identify EWS-regulated genes. Sequencing reads were mapped to Ensembl annotations (www.ensembl.org), and expression levels of genes based on the Ensembl annotation are shown in Supplementary File S1. Genes were ranked by the mean ± standard deviation of log-transformed FPKM (fragments per kilobase per million mapped reads) and shown as a heat map in Figure 1B. To gain insight into the functional significance of the differentially expressed genes, we performed DAVID functional annotation analysis (david.abcc.ncifcrf.gov) of 99 genes that pass the filter of a 5% false discovery rate (FDR) and log2 ratio >1 or <–1. We found that these genes are associated with diverse functions, including those that have previously been indicated for EWS in non–Ewing sarcoma cells, such as a response to various cellular stresses, as well as previously unidentified functions including cell signaling, secretion, blood vessel development, and neuronal-related processes (Fig. 1C and Suppl. File S2). A subset of EWS–up-regulated and –down-regulated genes was randomly selected and validated by qRT-PCR) (Fig. 1D and 1E).
Figure 1.

Identification of EWS-regulated genes and functions in Ewing sarcoma. (A) EWS knockdown by shRNA. qRT-PCR analysis shows that the EWS transcript level decreased about 80% by EWS knockdown. Normalized fold change was calculated by determining the fold change of the EWS-RNAi condition relative to the control Luc-RNAi condition, with the data in each condition normalized to an internal housekeeping control gene GAPDH. Columns indicate the mean of 3 independent replicate experiments, error bars indicate the standard deviation, and asterisks indicate P < 0.05. EWS and tubulin (loading control) protein levels after control or EWS shRNA treatment are shown in the bottom panel. (B) Expression profiles for all detected and rank-ordered Ensembl genes are represented as a heat map. The FPKM values were mean-centered and normalized, with each row representing a different gene. The top 20 genes that either increase (left) or decrease (right) with increased EWS are shown. (C) Top 10 categories identified by DAVID functional annotation analysis of EWS-regulated genes. (D, E) RT-PCR validation of randomly selected EWS–up-regulated (D) or –down-regulated (E) genes. Normalized fold change was calculated by determining the fold change of the EWS-RNAi condition relative to the control Luc-RNAi condition, with the data in each condition normalized to an internal housekeeping control gene GAPDH. Columns indicate the mean of 3 independent replicate experiments, error bars indicate the standard deviation, and asterisks indicate P < 0.05.
EWS-regulated genes are differentially regulated by EWS/FLI
Because EWS/FLI has previously been shown to interfere with EWS functions,12,13 we next sought to determine the relationship between EWS and EWS/FLI in regulating cellular processes in Ewing sarcoma. We performed RNA-seq following EWS/FLI silencing and compared the EWS/FLI-regulated transcriptional profile (Suppl. File S3) with that of EWS. We used VennMaster analysis (informatik.uni-ulm.de/ni/staff/HKestler/vennm) to identify genes commonly regulated by EWS and EWS/FLI. Fifty-three of the 99 EWS-regulated genes were found to also be regulated by EWS/FLI (P = 3.86345E-30) (Fig. 2A). Of these 53 EWS and EWS/FLI commonly regulated genes, 14 genes were up-regulated by EWS and down-regulated by EWS/FLI (P = 4.30758E-9), and 13 genes were down-regulated by EWS and up-regulated by EWS/FLI (P = 4.62419E-8), suggesting that the 2 proteins inversely regulate a significant subset of target genes (Fig. 2B). Interestingly, we also identified 7 genes that were up-regulated (P = 0.00897) and 19 genes that were down-regulated (P = 4.19203E-14) by both EWS and EWS/FLI (Fig. 2B), indicating that the 2 proteins also regulate a significant subset of genes in the same manner. We next performed Gene Set Enrichment Analysis (GSEA) using the EWS/FLI-regulated genes as the ranked list and the EWS–up-regulated or –down-regulated targets as the gene sets and applied a χ2 test29 to establish enrichment of the EWS-regulated genes for both the EWS/FLI–up-regulated and –down-regulated genes. We found that the EWS–up-regulated genes cluster significantly (P ≤ 0.001) with both the EWS/FLI–up-regulated and –down-regulated genes and vice versa (Fig. 2C), suggesting a correlated regulation of genes by EWS and EWS/FLI in either the same or opposite directions. Notably, the correlation seemed to be stronger for the EWS–down-regulated genes as compared to the EWS–up-regulated genes. These results suggest that EWS and EWS/FLI differentially regulate genes and cellular processes in Ewing sarcoma.
Figure 2.

EWS/FLI differentially regulates EWS-regulated genes. (A) Venn diagram shows a significant overlap of the EWS- and EWS/FLI-regulated gene sets. (B) Venn diagrams showing significant overlapping gene sets between the EWS–up-regulated or –down-regulated and the EWS/FLI–up-regulated or –down-regulated gene sets. The P value was calculated by χ2 analysis. (C) GSEA using EWS/FLI-regulated genes in A673 Ewing sarcoma cells as the rank-ordered data set and the EWS–up-regulated or –down-regulated targets as the gene set. The χ2 test–derived enrichment scores and P values are shown for each end of the GSEA curve.
EWS inhibits a subset of REST target neuronal genes in Ewing sarcoma cells
Because Ewing sarcoma was found to display some neuronal features, we focused our study on the EWS-regulated genes in the category of neuronal-related processes. We noted a set of neuronal genes including chromogranin A (CHGA), cholinergic receptor nicotinic beta 2 (CHRNB2), pleckstrin and Sec7 domain containing (PSD), secretogranin III (SCG3), synaptotagmin IV (SYT4), and VGF nerve growth factor inducible (VGF). These 6 genes are involved in different aspects of neuronal functions30-35 and are all down-regulated by EWS. Interestingly, elevated CHGA is an indicator for pancreas and prostate cancers.36 Detection of SCG3 and VGF transcripts is a prognostic biomarker for small cell lung cancer and large cell neuroendocrine carcinoma,37,38 respectively. More importantly, a putative REST response element (neuron-restrictive silencer element [NRSE]) is found in the regulatory regions such as the promoter or 5′ untranslated region (5′-UTR) of each of these genes (Suppl. File S4). Most of these genes are known to be repressed by REST as well.39-41
To test if REST is involved in the repression of these neuronal genes in Ewing sarcoma, and to validate the RNA-seq data that EWS down-regulates the same subset of neuronal genes, we performed shRNA- and siRNA-mediated silencing of EWS or REST and analyzed the expression of these genes by qRT-PCR (Fig. 3A and Suppl. Fig. S1). Stable knockdown of EWS or REST by shRNA significantly increased the expression of each of these neuronal genes in both A673 and TC71 cells (Fig. 3A and Suppl. Fig. S1A). Transient knockdown of EWS or REST using siRNA (Suppl. Fig. S1B) generated the same pattern of increased expression for each of these neuronal genes (Suppl. Fig. S1C). These findings demonstrate the repression of a subset of neuronal genes by REST in Ewing sarcoma, confirm the EWS RNA-seq results, and suggest a direct connection between EWS and REST in the regulation of neuronal gene expression.
Figure 3.
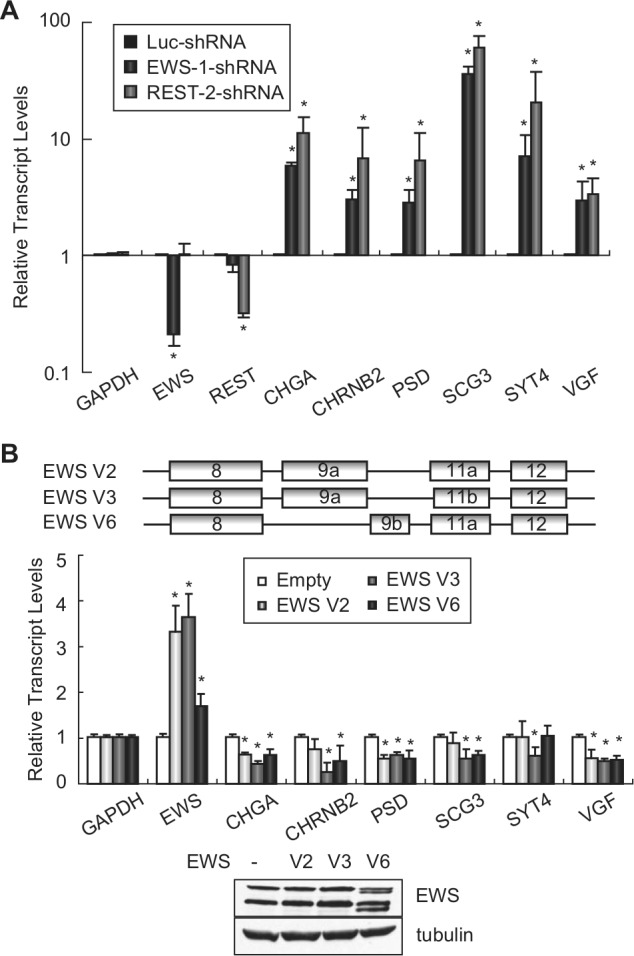
EWS and REST repress neural gene expression in Ewing sarcoma cells. (A) qRT-PCR analysis showing that EWS and REST down-regulate the transcription of all 6 neural genes. Normalized fold enrichment was calculated by determining the fold change of each condition relative to the control Luc-RNAi condition, with the data in each condition normalized to GAPDH. Columns indicate the mean of the 3 independent replicate experiments, error bars indicate the standard deviation, and asterisks indicate P < 0.05. (B) Overexpression of EWS represses the neuronal genes of interest. Schematic representation of 3 EWS splice variants found in Ewing sarcoma (upper panel). Expression of indicated neuronal genes with the overexpression of each EWS variant was investigated by RT-PCR. Normalized fold enrichment was calculated by determining the fold change of each condition relative to the empty vector condition, with the data in each condition normalized to GAPDH. Columns indicate the mean of 3 independent replicate experiments, error bars indicate the standard deviation, and asterisks indicate P < .05. EWS protein expression was examined by Western blotting, shown in the lower panel.
Since knockdown of EWS increased the expression of the neuronal genes of interest, we next asked whether the overexpression of EWS would decrease the expression of these genes. There are 5 known alternative splice variants for EWS. We identified at least 3 variants during the process of cloning the EWS cDNA from A673 cells. Two variants, V2 and V3 (NM_005243.3 and NM_001163285.1), have previously been reported, and they differ only by 3 nucleotides in exon 11. The third variant, V6 (BankIt1574452 EWS JX977847), has not been identified previously. Variant V6 contains an alternative exon 9 (9b), which is 105 bases shorter than exon 9 (9a) that is found in V2 and V3 (Fig. 3B, upper panel). Following the enforced expression of each EWS isoform in A673 cells, we observed an overall repression of the neuronal genes tested to various extents (Fig. 3B, lower panel). It should be noted that the shRNA used to knock down EWS targets all 3 EWS variants and that EWS knockdown consistently increased the expression of the neuronal genes of interest (Fig. 3A). Taken together, these findings demonstrate that EWS indeed represses the set of neuronal genes tested in Ewing sarcoma cells.
EWS physically interacts with REST and binds to NRSE sites in the genome
Next, we examined the mechanism by which EWS and REST co-regulate these neuronal genes. One possibility is that EWS and REST regulate one another. However, knockdown of REST failed to change EWS levels and vice versa (Fig. 3A). EWS has previouisly been shown to regulate transcription by binding to proteins in the transcriptional machinery or to other transcription factors.42,43 REST has also been shown to require co-factor interactions to mediate the repression of its target genes.8,44 Therefore, we hypothesized that EWS and REST interact with each other to regulate the subset of neuronal genes. To test this hypothesis, we first asked whether EWS and REST physically interact in Ewing sarcoma cells. We immunoprecipitated endogenous EWS proteins from A673 cell lysates and tested for the presence of REST in the immunoprecipitates and vice versa. We found that EWS and REST co-immunoprecipitate in the reciprocal pull-downs (Fig. 4A). Domain mapping was then carried out by overexpressing flag-tagged full-length EWS, full-length EWS/FLI, which contains only the N-terminal portion of EWS, or Δ22 (a deletion mutant of EWS/FLI in which almost the entire EWS portion is deleted) (Fig. 4B) in HEK293 cells. After performing co-immunoprecipitation (co-IP), we found that full-length EWS and EWS/FLI, but not Δ22, were able to interact with REST (Fig. 4B). This indicates that the N-terminal domain of EWS is required for REST binding.
Figure 4.

EWS physically interacts with REST and binds to chromatin regions at or near NRSE sites. (A) Reciprocal co-IP of EWS and REST. (B) The N-terminus of EWS or EWS/FLI is responsible for binding to REST. Schematic representation of constructs used in the analysis is shown in the top panel. The number equals the numerical value of amino acid residues of the EWS protein. HEK293 cells were transfected with flag-tagged full-length EWS, full-length EWS/FLI, or EWS/FLI Δ22. Cell lysates were subject to immunoprecipitation with anti-REST antibody for endogenous REST. Normal mouse IgG was used as a negative control. Co-immunoprecipitates of flag-tagged proteins were detected by the anti-flag antibody. All co-IP experiments were performed 3 times. (C) EWS binds to the REST-repressed neural genes at or near their NRSE sites. ChIP-seq analyses were carried out as described previously.45 UCSC Genome Browser screenshots of the EWS ChIP-seq signal at indicated genes are shown. NRSE sites are indicated by arrows. (D) Mean EWS ChIP signal across all NRSE elements ±1 kb (left panel) and EWS-bound NRSE elements ±1 kb (right panel). Tags have been normalized for sequencing depth. (E) Overlap of EWS-binding sites across NRSE, SOX2, PAX6, and CTCF sites (dark gray bars). For comparison, overlap was also performed using randomly permuted EWS peaks (light gray bars). Asterisks indicate P < 0.001.
We next reasoned that if EWS and REST regulate these neuronal genes by mutual interaction, they would closely bind to chromatin at the set of neuronal genes. To examine whether EWS contacts chromatin at the NRSE sites present in the set of neuronal genes or at NRSE sites in the genome in general, we expressed epitope-tagged EWS in Ewing sarcoma EWS502 cells in which endogenous EWS/FLI had been silenced. We performed ChIP-seq analysis45 and observed EWS signals at regions 100 to 200 bp from the predicted NRSE sites at the neuronal genes of interest (Fig. 4C). We also observed EWS signals at other regions of some genes, which is consistent with previous findings that EWS regulates transcription and RNA splicing. We then examined EWS signals at computationally predicted NRSE sites (TTCAGCACCA/T/GC/ANGGACAGC /AG/AC/GC, N = 3-9).40 We found that the EWS signal was enriched and centered around NRSE sites (Fig. 4D, left panel) and that the signal intensity was even greater (Fig. 4D, right panel) when the analysis was limited to algorithmically selected EWS peaks (Zero-Inflated Negative Binomial Algorithm [ZINBA]46). As a validation of the signal-based enrichment of EWS at NRSE, we performed a permutation analysis of EWS binding at NRSE sites (Fig. 4E) and observed a significant association between EWS and NRSE. We also observed this relationship with the highly conserved insulator element CTCF but not the binding sites of 2 neuronal transcription factors SOX2 or PAX6 (Fig. 4E). These results suggest that EWS preferentially binds chromatin at or near NRSE sites in Ewing sarcoma cells. Taken together, our data indicate that EWS and REST interact with each other and bind chromatin at or near NRSE sites to repress the expression of the target neuronal genes.
EWS and REST inhibit the neuronal phenotype and tumorigenesis in Ewing sarcoma cells
Next, we sought to determine the biological function of the co-regulation of neuronal genes by EWS and REST. Because the depletion of EWS increases expression of the neuronal genes, we reasoned that EWS knockdown may induce a neuronal phenotype in Ewing sarcoma cells. We therefore examined the protein levels of 3 neuronal markers, β-III tubulin (TUBB3), neurofilament heavy polypeptide (NEFH), and microtubule- associated protein 2 (MAP2), following the knockdown of EWS. These 3 proteins have been previously used to assess neural differentiation in Ewing sarcoma cells.17,47 We found that silencing of EWS in both A673 and TC71 cells resulted in an increased expression level of all 3 neuronal markers (Fig. 5A). REST knockdown also caused an increase in expression of the 3 neuronal markers, which is consistent with its role in inhibiting neural differentiation. Furthermore, we observed a significant morphological change of EWS or REST knockdown cells, as demonstrated by the increase in neurite outgrowth when the cells were exposed to low-serum medium and/or nerve growth factor (20 ng/mL) (Fig. 5B). In contrast, the control knockdown cells displayed only minor morphological changes when maintained under the same conditions of neuronal differentiation. These results suggest that both EWS and REST mediate repression of the neuronal phenotype in Ewing sarcoma.
Figure 5.

EWS and REST repress the neuronal phenotype and oncogenic transformation in Ewing sarcoma cells. (A) EWS or REST knockdown increases the expression of neuronal markers TUBB3, NEFH, and MAP2 in A673 and TC71 cells. (B) EWS or REST but not control knockdown cells display a neuronal phenotype when grown in media with 1% FBS and/or 20 ng/mL of nerve growth factor. (C) Growth curves of A673 cells with the overexpression of EWS V2, V3, or V6 or REST. (D) Soft agar assay with A673 cells overexpressing each of the 3 EWS splice isoforms or REST. Asterisks indicate P < 0.05.
Given that EWS is translocated in multiple cancers, and that REST has been implicated as a tumor suppressor in lung, breast, and colon cancers, we next tested whether EWS and REST inhibit tumorigenesis in Ewing sarcoma. We silenced EWS or REST by shRNA in A673 and TC71 cells and found that the cells grew similar in tissue culture and formed a similar number of colonies in soft agar as the control knockdown cells (Suppl. Fig. S2A-D). Because Ewing sarcoma cells are highly transformed at baseline, we reasoned that a decrease of the EWS or REST expression level may not result in a significant increase in colony formation. Therefore, we next enforced the expression of each of the 3 EWS isoforms or REST in A673 and TC71 cells. We also observed a similar growth rate of these cells in tissue culture compared to control cells (Fig. 5C and Suppl. Fig. S2E). However, expression of EWS V2 or V3 isoforms or REST resulted in a significant reduction in oncogenic transformation, as shown by diminished anchorage-independent growth in soft agar (Fig. 5D and Suppl. Fig. S2F). Interestingly, EWS V6 overexpression failed to inhibit colony formation in soft agar, suggesting that exon 9 in the V2 and V3 isoforms is necessary for EWS-mediated inhibition of anchorage-independent growth. These results indicate that EWS and REST inhibit the maintanence of oncogenic transformation in Ewing sarcoma.
Discussion
In the current study, we identified EWS-regulated genes and cellular processes in Ewing sarcoma by combining RNAi with RNA-seq and DAVID functional annotation analysis (Fig. 1). Interestingly, we found that the wild-type EWS and the fusion oncoprotein EWS/FLI have significantly overlapping profiles of transcriptional regulation and that they have opposite effects on some genes and similar effects on others (Fig. 2). Several previous reports have shown that EWS/FLI interferes with EWS functions in splicing, transcription, and maintanence of genomic stability12,48 via its interaction with EWS. However, functional regulation in the same manner by EWS and EWS/FLI has not previously been reported. Given the domain structure of the 2 proteins (Fig. 4B), it is tempting to speculate that the similar regulation of genes by EWS and EWS/FLI may be mediated by their identical N-terminal domains, which has been shown to display transcriptional activation as well as repression activity49 and is able to bind to proteins in the transcriptional initiation complex.5
We focused on a subset of EWS-regulated neuronal genes in this report and found that EWS cooperates with REST to repress the neuronal phenotype (Figs. 3 -5). Interestingly, in addition to Ewing sarcoma, 2 other EWS translocation–based tumors, desmoplastic small round cell tumor and extraskeletal myxoid chondrosarcoma, also show neuronal features such as the expression of neuron-specific enolase.50,51 This supports the notion that EWS represses the neuronal phenotype, and therefore, loss of EWS leads to acquiring neuronal features in these cancers. Further studies are required to fully understand the mechanism by which EWS and REST cooperatively regulate these neuronal genes. One candidate mechanism is epigenetic regulation of these genes by EWS and REST. EWS has previously been shown to inhibit the HAT activity of CBP/p300 via its interaction with noncoding RNA.8 Interestingly, REST/coREST/LSD1 and the PRC2 complex (Polycomb Repressive Complex 2), 2 histone-modifying complexes, were found to simultaneously tether to the long, noncoding RNA, HOTAIR, to mediate coupled histone H3K27 methylation and K4 demethylation.52
In addition to EWS and REST, EWS/FLI was also found to regulate the neuronal phenotype development in Ewing sarcoma. A previous report suggested that EWS/FLI induces neuronal features by up-regulation of an array of genes important for neural crest development, such as EGR2, MSX1, CITED2, c-Myc, ID2, Cadherin 11, RUNX3, and Rho family members.17 Although EWS and EWS/FLI may regulate the neuronal phenotype via different pathways, their opposite effects may explain how Ewing sarcoma family tumors exhibit varying levels of neural differentiation. Increased relative EWS/FLI levels would result in tumors with a more neuronal phenotype such as pPNET, whereas higher EWS expression would cause a reduced neuronal phenotype as observed for Ewing sarcoma.
Another important finding of this article is that both EWS and REST inhibit oncogenic transformation in Ewing sarcoma. EWS has not previously been implicated in tumor suppression except that it has been shown to control cell proliferation via posttranscriptional regulation of the Akt substrate PRAS40.53 Dysfunction of REST is evident in several cancers and is achieved through diverse mechanisms. In prostate cancer, loss of REST results in the derepression of IB1/JIP1 (Islet-Brain1/c-Jun amino-terminal kinase interacting protein 1) to prevent JNK activation and apoptosis.54 Impaired REST function in the breast cancer model stimulates the phosphorylation of Akt and leads to increased PI3-kinase signaling.24 REST activity has also been shown to be affected by the changes in the availability of REST/co-factor complexes.55 Based on our data, it is possible that the haploinsufficency of EWS in Ewing sarcoma decreases the abundance of the REST/EWS complex and abolishes REST activity on downstream effectors, leading eventually to tumorigenesis. Since EWS and EWS/FLI have been shown to interact, it is possible that EWS exerts a dominant-negative effect on EWS/FLI and therefore decreases colony formation in soft agar. The underlying mechanism of EWS- and/or REST-mediated inhibition of oncogenic transformation is under investigation.
Our findings that EWS and REST play roles in both repressing neuronal differentiation and inhibiting oncogenic transformation raise an interesting question of whether it is rational to see a neuronal phenotype in rapidly proliferating cancer cells. Indeed, both colon and breast cancers with REST deletion can display some neuroendocrine features.26 Also, it is well documented that many neuroendocrine genes are aberrantly expressed in small cell lung cancer.25 It has been postulated that when REST activity is lost in the precursor cells of these tumors, some neuronal genes are expressed outside their normal context. If the loss of REST activity is incomplete, such as the decrease in REST/co-factor abundance due to the haploinsufficiency of the co-factor, cancer cells may more closely resemble poised neural progenitor cells than mature neurons, remaining in the cell cycle but allowing the expression of some REST target genes. This transdifferentiation phase is very close to what we observe in Ewing sarcoma in which a highly undifferentiated phenotype coexists with neuronal features.
As indicated in our functional annotation analysis, EWS is also involved in the regulation of genes in other aspects of tumor development, such as angiogenesis and invasion. This suggests a more complex and broader impact of EWS on cancer development. A thorough study on EWS and its downstream effectors will benefit patients with Ewing sarcoma and other EWS translocation–based cancers.
Materials and Methods
Cell lines
Ewing sarcoma cell lines A673, TC71, and EWS502 were purchased from American Type Culture Collection (ATCC, Manassas, VA) and grown as previously described.56 Growth curve and soft agar colony formation assays were performed as previously described.2
Constructs
To clone the 3xFlag EWS construct, full-length EWS was amplified by PCR using the cDNA library from A673 cells. EWS was then fused in-frame with the 3xFlag tag and cloned into the pQCXIN vector. Constructs for the 3 EWS isoforms were generated by the amplification of individual EWS cDNA for each isoform, followed by ligation into the pMSCV-neo vector. The pMSCV-hygro 3xFlag EWS/FLI and mutant Δ22 have been previously described.57
RNAi
A human EWS-specific 19-mer oligonucleotide, 5′-gactctgacaacagtgcaa-3′, that maps to nucleotides 1083 to 1102 of the EWS gene was inserted into the pMKO.1-puro vector for stable knockdown of EWS. The nucleotide for REST knockdown is 5′-gaaactttgaacaaggttt-3′. Vectors for control (Luc-RNAi) knockdown and production of retrovirus-expressing shRNA have previously been described.1 siRNA for transient knockdown of EWS or REST was purchased from Dharmacon (Thermo Scientific, Rockford, IL).
RT-PCR
RT-PCR was performed using the iScript SYBR green RT-PCR kit (Bio-Rad, Hercules, CA) according to the manufacturer’s instructions. Primer sequences are available in Supplementary File S5.
RNA-seq and data analysis
Total RNA was extracted from Ewing sarcoma cells and treated with DNase using the Qiagen RNeasy kit (Germantown, MD). mRNA was enriched by oligo-dT magnetic beads and was used to construct Illumina (San Diego, CA) sequencing libraries. The libraries were single-end sequenced on Illumina Genome Analyzer IIx for 36 cycles (EWS) or HiSeq 2000 for 50 cycles (EWS/FLI). Reads were mapped to the hg19 genome build with Casava (Illumina) for EWS or Novoalign (Novocraft, Petaling Jaya, Malaysia) for EWS/FLI. The RNA-seq analysis was carried out using USeq (useq.sourceforge.net) versions 8.1.5 for EWS and 8.3.9 for EWS/FLI. Sorted, mapped files were converted to PointData representation with the USeq Eland Parser application for EWS and SAM Parser for EWS/FLI (useq.sourceforge.net). The knockdowns were compared with control using either Defined Region Scan Seqs (EWS) or Overdispersed Region Scan Seqs (EWS/FLI) applications with default parameters and a gene reference file derived from a merger of Ensembl and RefSeq (using a USeq Merge UCSC Gene table). Differential expression was defined as EWS: FDR ≤ 0.05 and |log2 fold change| ≥ 1.3 and EWS/FLI: FDR ≤ 1e-20 and |log2 fold change| ≥ 2.
GSEA and χ2 testing
EWS gene sets, both the up- regulated and down-regulated, were divided according to their corresponding log fold change in the EWS/FLI RNA-seq experiment. Gene set enrichment was determined using GSEA.58 To quantitatively establish enrichment of the EWS-regulated genes in the EWS/FLI–up-regulated and –down-regulated genes, we applied a χ2 test as described previously29 and calculated the enrichment score separately for EWS/FLI–up-regulated and –down-regulated genes.
ChIP-seq and data analysis
ChIP-seq analysis was performed as described previously.45 NRSE, SOX2, PAX6, and CTCF motif locations were derived from MotifMap (motifmap.ics.uci.edu).59 EWS peaks were permuted 1,000 times over the mappable genome (hg19) and assayed for overlap with the NRSE, SOX2, PAX6, and CTCF sites.
Immunoprecipitation and immunoblotting
Immunoprecipitation and immunoblotting were carried out as described previously.2 Anti-TUBB3 (MAB1195) and anti-NEFH (AF3108) were from R&D Systems (Minneapolis, MN), anti-MAP2 (Ab32454) was from Abcam (Cambridge, MA), and anti-REST (sc-374611), anti-EWS (sc-48404), and normal mouse IgG (sc-2025) were from Santa Cruz Biotechnology (Santa Cruz, CA).
Supplementary Material
Acknowledgments
The authors thank Brian Dalley and the microarray core facility for help in performing the RNA-seq, Brett Milash for suggestions in data presentation, Ken Boucher for help in statistical analysis, Lessnick laboratory members for helpful discussions, and Drs. Michael Engel and Michael Monument for critical reading of the article and helpful suggestions.
The EWS and EWS/FLI RNA-seq raw data can be accessed from the Sequence Read Archive (SRA) database (accession numbers PRJNA174537 and SAMN01163407 for EWS and SRA059239 for EWS/FLI). The EWS V6 sequence is deposited in GenBank (BankIt1574452 EWS JX977847).
Footnotes
Supplementary material for this article is available on the Genes & Cancer website at http://ganc.sagepub.com/supplemental.
Declaration of Conflicting Interests: The author(s) declared no potential conflicts of interest with respect to the research, authorship, and/or publication of this article.
Funding: The author(s) received the following financial support for the research, authorship, and/or publication of this article: This work was supported by NIH/NCI grants R01 CA140394 (to S.L.L.) and P30 CA042014 (to Huntsman Cancer Institute). S.S. acknowledges support from the Howard Hughes Medical Institute’s Med into Grad program at the University of Utah (U2M2G). I.J.D. gratefully acknowledges support from the NCI/NIH (K08CA100400), the V Foundation for Cancer Research, the Rita Allen Foundation, and the Corn-Hammond Fund for Pediatric Oncology.
References
- 1. Smith R, Owen LA, Trem DJ, et al. Expression profiling of EWS/FLI identifies NKX2.2 as a critical target gene in Ewing’s sarcoma. Cancer Cell. 2006;9:405-16 [DOI] [PubMed] [Google Scholar]
- 2. Kinsey M, Smith R, Lessnick SL. NR0B1 is required for the oncogenic phenotype mediated by EWS/FLI in Ewing’s sarcoma. Mol Cancer Res. 2006;4:851-9 [DOI] [PubMed] [Google Scholar]
- 3. Luo W, Gangwal K, Sankar S, Boucher KM, Thomas D, Lessnick SL. GSTM4 is a microsatellite-containing EWS/FLI target involved in Ewing’s sarcoma oncogenesis and therapeutic resistance. Oncogene. 2009;28:4126-32 [DOI] [PubMed] [Google Scholar]
- 4. Kovar H, Jug G, Hattinger C, et al. The EWS protein is dispensable for Ewing tumor growth. Cancer Res. 2001;61:5992-7 [PubMed] [Google Scholar]
- 5. Law WJ, Cann KL, Hicks GG. TLS, EWS and TAF15: a model for transcriptional integration of gene expression. Brief Funct Genomic Proteomic. 2006;5:8-14 [DOI] [PubMed] [Google Scholar]
- 6. Paronetto MP, Minana B, Valcarcel J. The Ewing sarcoma protein regulates DNA damage-induced alternative splicing. Mol Cell. 2011;43:353-68 [DOI] [PubMed] [Google Scholar]
- 7. Dutertre M, Sanchez G, De Cian MC, et al. Cotranscriptional exon skipping in the genotoxic stress response. Nat Struct Mol Biol. 2010;17:1358-66 [DOI] [PubMed] [Google Scholar]
- 8. Wang X, Arai S, Song X, et al. Induced ncRNAs allosterically modify RNA-binding proteins in cis to inhibit transcription. Nature. 2008;454:126-30 [DOI] [PMC free article] [PubMed] [Google Scholar]
- 9. Kato M, Han TW, Xie S, et al. Cell-free formation of RNA granules: low complexity sequence domains form dynamic fibers within hydrogels. Cell. 2012;149:753-67 [DOI] [PMC free article] [PubMed] [Google Scholar]
- 10. Blechingberg J, Luo Y, Bolund L, Damgaard CK, Nielsen AL. Gene expression responses to FUS, EWS, and TAF15 reduction and stress granule sequestration analyses identifies FET-protein non-redundant functions. PLoS One. 2012;7:e46251. [DOI] [PMC free article] [PubMed] [Google Scholar]
- 11. Spahn L, Siligan C, Bachmaier R, Schmid JA, Aryee DN, Kovar H. Homotypic and heterotypic interactions of EWS, FLI1 and their oncogenic fusion protein. Oncogene. 2003;22:6819-29 [DOI] [PubMed] [Google Scholar]
- 12. Embree LJ, Azuma M, Hickstein DD. Ewing sarcoma fusion protein EWSR1/FLI1 interacts with EWSR1 leading to mitotic defects in Zebrafish embryos and human cell lines. Cancer Res. 2009;69:4363-71 [DOI] [PMC free article] [PubMed] [Google Scholar]
- 13. Yang L, Chansky HA, Hickstein DD. EWS.Fli-1 fusion protein interacts with hyperphosphorylated RNA polymerase II and interferes with serine-arginine protein-mediated RNA splicing. J Biol Chem. 2000;275:37612-8 [DOI] [PubMed] [Google Scholar]
- 14. Lipinski M, Hirsch MR, Deagostini-Bazin H, Yamada O, Tursz J, Goridis C. Characterization of neural cell adhesion molecules (NCAM) expressed by Ewing and neuroblastoma cell lines. Int J Cancer. 1987;40:81-6 [DOI] [PubMed] [Google Scholar]
- 15. Cavazzana AO, Miser JS, Jefferson J, Triche TJ. Experimental evidence for a neural origin of Ewing’s sarcoma of bone. Am J Pathol. 1987;127:507-18 [PMC free article] [PubMed] [Google Scholar]
- 16. Teitell MA, Thompson AD, Sorensen PH, Shimada H, Triche TJ, Denny CT. EWS/ETS fusion genes induce epithelial and neuroectodermal differentiation in NIH 3T3 fibroblasts. Lab Invest. 1999;79:1535-43 [PubMed] [Google Scholar]
- 17. Hu-Lieskovan S, Zhang J, Wu L, Shimada H, Schofield DE, Triche TJ. EWS-FLI1 fusion protein up-regulates critical genes in neural crest development and is responsible for the observed phenotype of Ewing’s family of tumors. Cancer Res. 2005;65:4633-44 [DOI] [PubMed] [Google Scholar]
- 18. Turc-Carel C, Philip I, Berger MP, Philip T, Lenoir GM. Chromosome study of Ewing’s sarcoma (ES) cell lines: consistency of a reciprocal translocation t(11;22)(q24;q12). Cancer Genet Cytogenet. 1984;12: 1-19 [DOI] [PubMed] [Google Scholar]
- 19. Aurias A, Rimbaut C, Buffe D, Zucker JM, Mazabraud A. Translocation involving chromosome 22 in Ewing’s sarcoma: a cytogenetic study of four fresh tumors. Cancer Genet Cytogenet. 1984;12:21-5 [DOI] [PubMed] [Google Scholar]
- 20. Whang-Peng J, Triche TJ, Knutsen T, Miser J, Douglass EC, Israel MA. Chromosome translocation in peripheral neuroepithelioma. N Engl J Med. 1984;311:584-5 [DOI] [PubMed] [Google Scholar]
- 21. Jones FS, Meech R. Knockout of REST/NRSF shows that the protein is a potent repressor of neuronally expressed genes in non-neural tissues. BioEssays. 1999;21:372-6 [DOI] [PubMed] [Google Scholar]
- 22. Majumder S. REST in good times and bad: roles in tumor suppressor and oncogenic activities. Cell Cycle. 2006;5:1929-35 [DOI] [PubMed] [Google Scholar]
- 23. Qureshi IA, Mehler MF. Regulation of non-coding RNA networks in the nervous system: what’s the REST of the story? Neurosci Lett. 2009;466:73-80 [DOI] [PMC free article] [PubMed] [Google Scholar]
- 24. Westbrook TF, Martin ES, Schlabach MR, et al. A genetic screen for candidate tumor suppressors identifies REST. Cell. 2005;121:837-48 [DOI] [PubMed] [Google Scholar]
- 25. Coulson JM, Edgson JL, Woll PJ, Quinn JP. A splice variant of the neuron-restrictive silencer factor repressor is expressed in small cell lung cancer: a potential role in derepression of neuroendocrine genes and a useful clinical marker. Cancer Res. 2000;60:1840-4 [PubMed] [Google Scholar]
- 26. Gurrola-Diaz C, Lacroix J, Dihlmann S, Becker CM, von Knebel Doeberitz M. Reduced expression of the neuron restrictive silencer factor permits transcription of glycine receptor alpha1 subunit in small-cell lung cancer cells. Oncogene. 2003;22:5636-45 [DOI] [PubMed] [Google Scholar]
- 27. Fuller GN, Su X, Price RE, et al. Many human medulloblastoma tumors overexpress repressor element-1 silencing transcription (REST)/neuron-restrictive silencer factor, which can be functionally countered by REST-VP16. Mol Cancer Ther. 2005;4:343-9 [DOI] [PubMed] [Google Scholar]
- 28. Wagoner MP, Gunsalus KT, Schoenike B, Richardson AL, Friedl A, Roopra A. The transcription factor REST is lost in aggressive breast cancer. PLoS Genet. 2010;6:e1000979. [DOI] [PMC free article] [PubMed] [Google Scholar]
- 29. Irizarry RA, Wang C, Zhou Y, Speed TP. Gene set enrichment analysis made simple. Stat Methods Med Res. 2009;18:565-75 [DOI] [PMC free article] [PubMed] [Google Scholar]
- 30. Khan MO, Ather MH. Chromogranin A: serum marker for prostate cancer. J Pak Med Assoc. 2011;61:108-11 [PubMed] [Google Scholar]
- 31. Berton F, Iborra C, Boudier JA, Seagar MJ, Marqueze B. Developmental regulation of synaptotagmin I, II, III, and IV mRNAs in the rat CNS. J Neurosci. 1997;17:1206-16 [DOI] [PMC free article] [PubMed] [Google Scholar]
- 32. Hahm S, Mizuno TM, Wu TJ, et al. Targeted deletion of the Vgf gene indicates that the encoded secretory peptide precursor plays a novel role in the regulation of energy balance. Neuron. 1999;23:537-48 [DOI] [PubMed] [Google Scholar]
- 33. Alder J, Thakker-Varia S, Bangasser DA, et al. Brain-derived neurotrophic factor-induced gene expression reveals novel actions of VGF in hippocampal synaptic plasticity. J Neurosci. 2003;23:10800-8 [DOI] [PMC free article] [PubMed] [Google Scholar]
- 34. Li F, Tian X, Zhou Y, et al. Dysregulated expression of secretogranin III is involved in neurotoxin-induced dopaminergic neuron apoptosis. J Neurosci Res. 2012;90:2237-46 [DOI] [PubMed] [Google Scholar]
- 35. Perletti L, Talarico D, Trecca D, et al. Identification of a novel gene, PSD, adjacent to NFKB2/lyt-10, which contains Sec7 and pleckstrin-homology domains. Genomics. 1997;46:251-9 [DOI] [PubMed] [Google Scholar]
- 36. Wu JT, Erickson AJ, Tsao KC, Wu TL, Sun CF. Elevated serum chromogranin A is detectable in patients with carcinomas at advanced disease stages. Ann Clin Lab Sci. 2000;30:175-8 [PubMed] [Google Scholar]
- 37. Moss AC, Jacobson GM, Walker LE, Blake NW, Marshall E, Coulson JM. SCG3 transcript in peripheral blood is a prognostic biomarker for REST-deficient small cell lung cancer. Clin Cancer Res. 2009;15: 274-83 [DOI] [PubMed] [Google Scholar]
- 38. Matsumoto T, Kawashima Y, Nagashio R, et al. A new possible lung cancer marker: VGF detection from the conditioned medium of pulmonary large cell neuroendocrine carcinoma-derived cells using secretome analysis. Int J Biol Markers. 2009;24:282-5 [DOI] [PubMed] [Google Scholar]
- 39. Schoenherr CJ, Paquette AJ, Anderson DJ. Identification of potential target genes for the neuron-restrictive silencer factor. Proc Natl Acad Sci U S A. 1996;93:9881-6 [DOI] [PMC free article] [PubMed] [Google Scholar]
- 40. Otto SJ, McCorkle SR, Hover J, et al. A new binding motif for the transcriptional repressor REST uncovers large gene networks devoted to neuronal functions. J Neurosci. 2007;27:6729-39 [DOI] [PMC free article] [PubMed] [Google Scholar]
- 41. Jørgensen HF, Terry A, Beretta C, et al. REST selectively represses a subset of RE1-containing neuronal genes in mouse embryonic stem cells. Development. 2009;136:715-21 [DOI] [PMC free article] [PubMed] [Google Scholar]
- 42. Bertolotti A, Melot T, Acker J, Vigneron M, Delattre O, Tora L. EWS, but not EWS-FLI-1, is associated with both TFIID and RNA polymerase II: interactions between two members of the TET family, EWS and hTAFII68, and subunits of TFIID and RNA polymerase II complexes. Mol Cell Biol. 1998;18:1489-97 [DOI] [PMC free article] [PubMed] [Google Scholar]
- 43. Thomas GR, Latchman DS. The pro-oncoprotein EWS (Ewing’s sarcoma protein) interacts with the Brn-3a POU transcription factor and inhibits its ability to activate transcription. Cancer Biol Ther. 2002;1:428-32 [DOI] [PubMed] [Google Scholar]
- 44. Gao Z, Ure K, Ding P, et al. The master negative regulator REST/NRSF controls adult neurogenesis by restraining the neurogenic program in quiescent stem cells. J Neurosci1999. 2011;31:9772-86 [DOI] [PMC free article] [PubMed] [Google Scholar]
- 45. Patel M, Simon JM, Iglesia MD, et al. Tumor-specific retargeting of an oncogenic transcription factor chimera results in dysregulation of chromatin and transcription. Genome Res. 2012;22:259-70 [DOI] [PMC free article] [PubMed] [Google Scholar]
- 46. Rashid NU, Giresi PG, Ibrahim JG, Sun W, Lieb JD. ZINBA integrates local covariates with DNA-seq data to identify broad and narrow regions of enrichment, even within amplified genomic regions. Genome Biol. 2011;12:R67. [DOI] [PMC free article] [PubMed] [Google Scholar]
- 47. Rocchi A, Manara MC, Sciandra M, et al. CD99 inhibits neural differentiation of human Ewing sarcoma cells and thereby contributes to oncogenesis. J Clin Invest. 2010;120:668-80 [DOI] [PMC free article] [PubMed] [Google Scholar]
- 48. Sanchez G, Bittencourt D, Laud K, et al. Alteration of cyclin D1 transcript elongation by a mutated transcription factor up-regulates the oncogenic D1b splice isoform in cancer. Proc Natl Acad Sci U S A. 2008;105:6004-9 [DOI] [PMC free article] [PubMed] [Google Scholar]
- 49. Sankar S, Bell R, Stephens B, et al. Mechanism and relevance of EWS/FLI-mediated transcriptional repression in Ewing sarcoma. Oncogene. Epub 2012. November 26 [Google Scholar]
- 50. Ordonez NG. Desmoplastic small round cell tumor, I: a histopathologic study of 39 cases with emphasis on unusual histological patterns. Am J Surg Pathol. 1998;22:1303-13 [DOI] [PubMed] [Google Scholar]
- 51. Goh YW, Spagnolo DV, Platten M, et al. Extraskeletal myxoid chondrosarcoma: a light microscopic, immunohistochemical, ultrastructural and immuno-ultrastructural study indicating neuroendocrine differentiation. Histopathology. 2001;39:514-24 [DOI] [PubMed] [Google Scholar]
- 52. Tsai MC, Manor O, Wan Y, et al. Long noncoding RNA as modular scaffold of histone modification complexes. Science. 2010;329:689-93 [DOI] [PMC free article] [PubMed] [Google Scholar]
- 53. Huang L, Nakai Y, Kuwahara I, Matsumoto K. PRAS40 is a functionally critical target for EWS repression in Ewing sarcoma. Cancer Res. 2012;72:1260-9 [DOI] [PubMed] [Google Scholar]
- 54. Tawadros T, Martin D, Abderrahmani A, Leisinger HJ, Waeber G, Haefliger JA. IB1/JIP-1 controls JNK activation and increased during prostatic LNCaP cells neuroendocrine differentiation. Cell Signal. 2005;17:929-39 [DOI] [PubMed] [Google Scholar]
- 55. Yeo M, Lee SK, Lee B, Ruiz EC, Pfaff SL, Gill GN. Small CTD phosphatases function in silencing neuronal gene expression. Science. 2005;307:596-600 [DOI] [PubMed] [Google Scholar]
- 56. Lessnick SL, Dacwag CS, Golub TR. The Ewing’s sarcoma oncoprotein EWS/FLI induces a p53-dependent growth arrest in primary human fibroblasts. Cancer Cell. 2002;1:393-401 [DOI] [PubMed] [Google Scholar]
- 57. Lessnick SL, Braun BS, Denny CT, May WA. Multiple domains mediate transformation by the Ewing’s sarcoma EWS/FLI-1 fusion gene. Oncogene. 1995;10:423-31 [PubMed] [Google Scholar]
- 58. Subramanian A, Tamayo P, Mootha VK, et al. Gene set enrichment analysis: a knowledge-based approach for interpreting genome-wide expression profiles. Proc Natl Acad Sci U S A. 2005;102:15545-50 [DOI] [PMC free article] [PubMed] [Google Scholar]
- 59. Daily K, Patel VR, Rigor P, Xie X, Baldi P. MotifMap: integrative genome-wide maps of regulatory motif sites for model species. BMC Bioinformatics. 2011;12:495. [DOI] [PMC free article] [PubMed] [Google Scholar]
Associated Data
This section collects any data citations, data availability statements, or supplementary materials included in this article.