

Abstract
Osteopontin (OPN) Spp1 is involved in differentiation of the mammary gland. We engineered mice to overexpress OPN in mammary epithelium and describe an altered mammary phenotype. Three transgenic (Tg) founder lines FVB/N Tg(MMTV-Opn)(1-3BOR) were propagated after FVB/NJ pronuclear injections. Mammary glands from Tg-OPN mice compared to littermate controls showed, at 4 weeks of age, exaggerated terminal end buds; at 8 and 12 weeks, more numerous and complex ducts with increased luminal protein; and at 16 weeks, increased lobulogenesis. Lactational Tg-OPN mammary glands showed more rapid lobulogenesis and lactational changes with slower gland involution and regression following weaning. Ex vivo lobulogenesis was noticeably increased from organoids of Tg-OPN mice. Immunohistochemistry revealed cytoplasmic OPN accumulation and increased Ki-67 positive mammary epithelial cells in Tg-OPN mammary glands. OPN appears to convey a proliferative stimulus for mammary epithelial cells and alters development and differentiation. These OPN mammary overexpressing mice provide a means to study the role of OPN in cancer progression.
Keywords: mammary gland, osteopontin, lobulogenesis, involution, organoid culture, flow cytometry
Introduction
The mechanisms involved in dysregulation of mammary gland growth, differentiation, and regression leading to mammary epithelial cell (MEC) hyperplasia and tumorigenesis are unknown but probably involve the aberrant expression of key genes. Elucidating why normal MEC proliferation becomes aberrant remains a challenge in the study of breast cancer, but experiments using human derived cell lines have yielded some important findings.1 In vitro studies, however, are unable to replace the complexity of mammary gland development with its hormonal and stromal regulation. Using model systems such as genetically engineered mice provides an in vivo setting to help interrogate the involvement of specific genes in the context and complexity of the mammary gland and its development.2,3 The normal mammary gland is composed of luminal and basal epithelial cells, which form a network of ducts embedded in a stroma. Pregnancy induces hormonal changes that cause alveolar cell proliferation and differentiation, resulting in milk production and lactation.4 Understanding how specific genes can alter that process provides an important basis for studying changes that can lead to mammary gland hyperplasia, neoplasia, and eventually malignancy.
While there are many genes and mechanisms involved in MEC proliferation and differentiation, choosing those that have been shown to also play a major role in breast tumorigenesis and overexpressing them in normal tissue could be a good strategy for correlating changes during mammary gland development and differentiation with a preneoplastic phenotype.5 Osteopontin (OPN), Spp1, is a secreted glycophosphoprotein that plays an important role in mammary gland development but has also been implicated in many cancers including breast cancer.6 In normal mouse mammary gland, OPN shows stage-dependent regulation with low to moderate levels of expression in the nulliparous and pregnant glands but extremely high levels in the lactating gland.7 OPN is persistently expressed during lactation8 and has been used as a marker to identify differentiated secretory MEC.9 Targeted inhibition of OPN in a mouse engineered to express OPN antisense-RNA caused abnormal morphogenesis and lactation deficiency,10 verifying that it plays a crucial role in mammary gland development and function. In vitro studies have shown that OPN may support cell adhesion and induce cell migration and invasion of MEC.11
OPN has also been shown to alter many aspects of tumorigenesis, especially metastasis. In a recent study, mutant BRCA1 elicited changes involved in metastatic progression in human breast cancer cells via the overexpression of OPN.12 Since a BRCA1 mutation can be present before breast cancer appears and may alter OPN expression, OPN could be involved in early stages of cancer progression. Also with respect to tumorigenesis, elevated levels of OPN could be observed in tumor cells and surrounding stroma of numerous human cancers and has been correlated with malignant invasion.13 OPN may also prove to be a reliable selective marker for breast cancer.14,15 In one study, RNA messages of all 3 osteopontin splice variants (a, b, c) could be detected from whole blood, with b and c variants correlating with distinct cancers.14 We showed that OPN is a necessary, but not sufficient, regulator of the metastatic phenotype in a polyoma middle T breast cancer model.16 Therefore, it is possible that aberrant expression of OPN may convey changes in epithelial tissues of mammary gland that predispose them to neoplastic development.
Here, we describe phenotypic changes in mouse mammary gland development and lactational differentiation as a result of continuous expression of OPN in MEC. This was achieved using the specificity of the MMTV-LTR to mammary epithelium and its steroid hormone responsiveness. Continuous OPN expression led to increased in vivo and ex vivo mammary gland and organoid lobulogenesis, respectively, with persistent alveolar development and incomplete regression with persistent proliferation. Though continuous OPN expression alone in the context of the developing and differentiating mammary gland may not necessarily confer a frank malignant phenotype, future studies with bitransgenic or polytransgenic mice involving OPN overexpression may be an important strategy for understanding the complexity of advancement to preneoplasia and malignancy. OPN may be involved in acquisition of invasiveness, a critical step in early stage breast carcinomas.
Results
FVB/N Tg(MMTV-Opn)(1-3BOR) founder lines
Of 20 live births that carried the transgene, 3 were successfully bred and passed the transgene germ line. Copy number analysis showed tandem repeat numbers of 45, 295, and 214 of the Opn gene. Eight-week-old nulliparous mammary phenotypes varied between founder lines, but the 2 founder lines with the higher copy numbers (214 and 295) had similar phenotypes. The low copy number founder line had a more subtle phenotype but wild type (WT), low copy number, and high copy number phenotypes could be distinguished in blinded histologic and microscopic review of hematoxylin-eosin-stained sections.
OPN and mammary gland development
To examine the effect of continuous OPN expression on mammary gland development, nulliparous mice were sacrificed at various time points throughout development. In Figure 1, for example, whole mounted #4 mammary glands from nulliparous WT and a signature transgenic (Tg)-OPN animal were compared. Quantitation of these glands showed that the Tg-OPN mammary gland had more terminal end buds (TEBs; Fig. 1C, table). There were no overall significant (P > 0.05) differences in branching and side budding after performance of quantitative image analysis (Fig. 2C), but had a much larger range in the Tg-OPN, suggesting much more heterogeneity. This large range in the Tg-OPN was also seen with duct thickness (Fig. 2E, 2F). Proliferation and side budding can be seen during the estrus phase, but in the Tg-OPN mice, these changes were seen regardless of stage, suggesting activation of developmental proliferation pathways similar to the estrogen stimulation normally seen in the estrus cycle. The persistence through the estrus cycle also raised the question of a block in regression signals. Immunohistochemistry against murine OPN showed abundant expression of OPN in WT mammary glands with secretion into the ductal lumen (Fig. 3). In the OPN transgenic gland there was luminal secretion as well as cytoplasmic excess accumulation. Proliferation as assessed by immunohistochemistry for Ki67 reveals areas with proliferation exceeding any seen in WT mice (Fig. 3). Staining heterogeneity is also consistent with the patchy proliferative phenotype observed in the whole mounts.
Figure 1.

Tg-OPN (transgenic osteopontin) alteration of mammary gland structure. Mammary gland (#4) whole mounts (A) from 8-week-old age-matched nulliparous female wild type (WT) and Tg-OPN littermates were photographed for quantitative image analysis and compared. Terminal end buds (TEBs; B, arrowheads) were more numerous in Tg-OPN mice (C, TEBs).
Figure 2.

Quantitation of transgenic osteopontin (Tg-OPN) duct branching and thickness. Quantitation was performed using an original unprocessed image of duct growth (A). Image that was processed as described in Materials and Methods and analyzed using AngioTool (B). In B, blue dots represent branch points, red line represents duct skeleton, and green lines represents duct outline. The white outline is the area used by AngioTool to find the duct structure. Mammary gland (#4) whole mounts from 6-week-old age-matched nulliparious female wild type (WT) and Tg-OPN littermates were photographed for qualitative image analysis and compared quantitatively for junctions per millimeter (C, D) and thickness (E, F).
Figure 3.
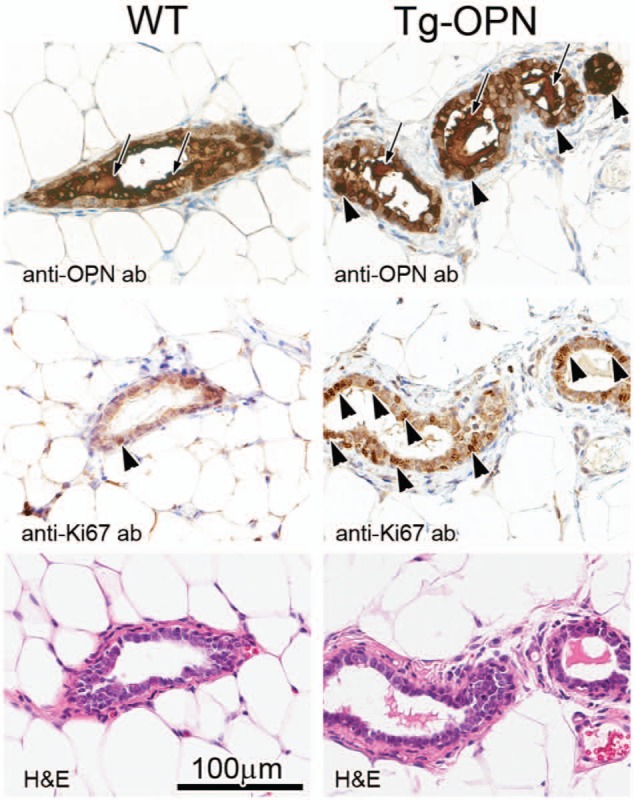
Mammary gland histology, osteopontin (OPN) expression, and proliferation in nulliparous 10-week female transgenic (Tg)-OPN versus wild type (WT) control mice. WT (left) and Tg-OPN (right) mammary ducts, serial or near serial sections. Immunohistochemistry against murine OPN (top panels) shows the abundant expression of OPN in normal mammary glands with secretion into the ductal lumen (arrows). In the OPN transgenic gland, there is luminal secretion (arrows) as well as cytoplasmic excess accumulation (arrowheads). Proliferation as assessed by immunohistochemistry for Ki67 (middle panels) reveals areas with proliferation exceeding any seen in wild type mice. In the representative areas there is one positive nucleus in the wild type (arrowhead), whereas in the Tg-OPN there are many positive nuclei (arrowheads mark only some of the positive cell nuclei). Hematoxylin-eosin (H&E) stained serial sections are shown below, with the 100 µm scale bar (bottom left) pertaining to all panels.
In relatively young (4 weeks of age) mammary glands, Tg-OPN mice appeared to have exaggerated TEBs when compared to littermate controls not expressing the transgene (Fig. 4). The TEBs in the Tg-OPN mice show increased proliferation but also seem to remodel the duct via increased apoptosis (arrowheads). In some TEBs, excessive luminal degraded cells can be seen (inset), possibly representing secondary remodeling via anoikis.17
Figure 4.
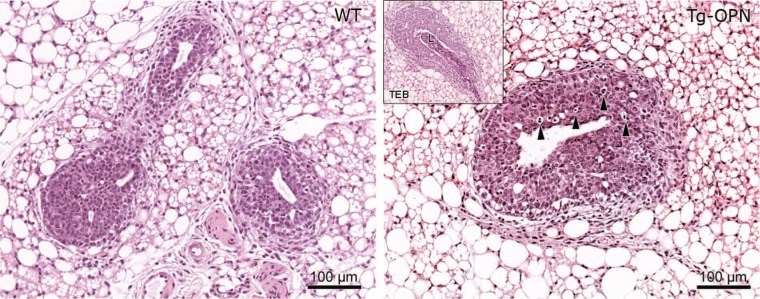
Osteopontin (OPN)-induced epithelial hyperplasia in young nulliparous mammary gland. Tissue sections (4 µm) of formalin-fixed, paraffin-embedded abdominal (#4) mammary glands from 4-week-old age-matched nulliparous female wild type (panel WT) and transgenic osteopontin (Tg-OPN) littermates were stained with hematoxylin-eosin. Tg-OPN induced lobular hyperplasia with increased apoptosis (arrowheads, Tg-OPN panel). Inset in Tg-OPN panel shows a representative Tg-OPN terminal end bud (TEB) with cell debris in lumen (L).
OPN and pregnant and lactational mammary gland
More rapid lobulogenesis was apparent in pregnant Tg-OPN mice compared to littermate controls to the extent that there appeared to be little ductal extension (mostly alveolar) in Tg-OPN mice (Fig. 5). An OPN gland at gestational day (GD) 7 (GD7, Fig. 5C) was more advanced in pregnancy compared to a WT pregnant gland at GD9 (Fig. 5A) and seemed more likely comparable to a GD18 or GD19 pregnant gland. In addition, lactational changes were noted in the transgenic mammary gland. With respect to regression, Tg-OPN mice demonstrated slower gland involution and regression of lactational changes following pregnancy when compared to littermate controls (Fig. 6).
Figure 5.

Osteopontin (OPN)-induced proliferation in prelactating mammary gland. Mammary gland from pregnant females of wild type (WT) (A and B) and transgenic (Tg)-OPN (C and D) mice were compared at various days of gestation (GD). Tg-OPN mice at GD7 (C) had more epithelial cellularity and appeared more differentiated compared to WT mammary gland further into pregnancy (GD9 and GD17, A and B) with many areas of lipid production (D, arrows).
Figure 6.

Osteopontin (OPN) mammary epithelial cell overexpression induces mammary gland persistence long after pregnancy. Five months postpartum (PP), wild type (WT) gland (top 2 panels) has completely regressed compared to transgenic (Tg)-OPN gland 4 months after a second pregnancy. Areas in the Tg-OPN mammary glands appeared prelactating (middle 2 panels) persistently lactating (lower left panel) and persistently acinar (lower right). Middle right panel shows persistent milk production (M) in the transgenic mouse.
Parous OPN overexpressing animals given a normative time to regress (at least 3 months) had areas in the mammary glands that appeared prelactating, persistently lactating, and persistently acinar (Fig. 6). Lipid production was still apparent.
OPN and mammary epithelial cell population
Since we have observed increased mammary gland lobulogenesis with persistent alveolar development and incomplete regression with persistent proliferation, we hypothesized that the effect of continuous OPN expression in the mouse mammary epithelium may be related to changes in MEC populations, including stem and progenitor cells. The percentage of MECs (CD49f+) in 10-week-old nulliparous mice that expressed CD24 was increased substantially in Tg-OPN (59.1%) compared to WT control (23.3%; Fig. 7). Notably, there was also a marked increase in the ratio of CD24hi to CD24lo in the Tg-OPN (0.31 for WT and 0.81 for Tg-OPN). In the CD49f+ CD24 versus CD29 plots there was an increase in the putative stem-enriched population (CD24lo/CD29hi) from 4.27% to 11.5% but CD44+ populations were not changed (Fig. 7B). Immunohistochemical analysis of 2-month-old and 4-month-old intact mammary gland tissues for one of the OPN receptors, CD44 shows that CD44+ cells reside primarily in the basal compartment with far fewer located in the luminal compartment (Fig. 7C). The 2-month-old animals appeared to have more CD44+ cells in the luminal compartment, and it also appeared that the Tg-OPN had fewer luminal CD44+ cells when compared with the WT.
Figure 7.
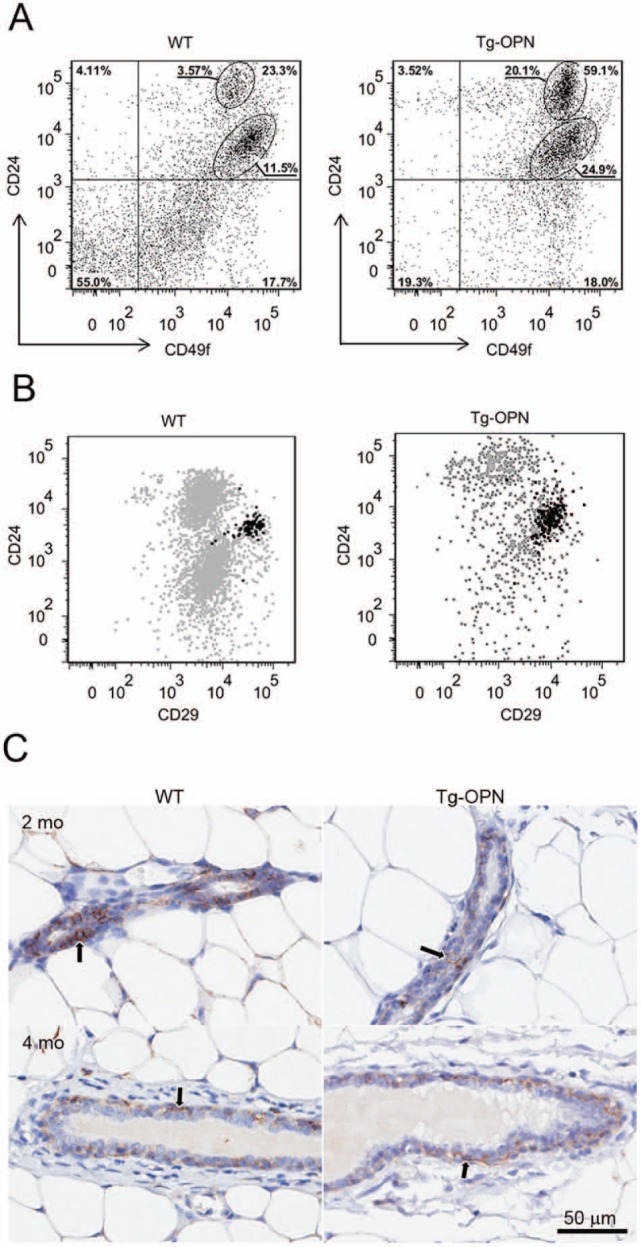
Expression of putative stem cell markers in wild type (WT) and transgenic osteopontin (Tg-OPN) mammary epithelial cells. The gating strategy used to select for CD49f+ cells is described in Supplemental Figure S2. Distribution of CD49f+ cells in Tg-OPN as well as in WT littermate control mammary epithelial cells according to their expression of the putative stem cell markers CD24 and CD29 (A). Representative dot plot showing the distribution of CD44+ cells among the CD49f+ CD24 and CD29 expressing cells (B). Anti-CD44 immunohistochemistry (C) on 2- and 4-month-old nulliparous mammary glands from WT and Tg-OPN animals shows that CD44+ cells (arrows) are located primarily in the basal compartment of ducts with fewer in the luminal compartment. The younger animals appear to have more CD44+ cells in the luminal compartment, and it appears that the Tg-OPN has fewer luminal CD44+ cells compared to the WT.
Ex vivo lobulogenesis
The precocious lobulogenesis observed in vivo was also observed repetitively in an ex vivo lobulogenesis assay. Organoids isolated from Tg-OPN and WT mice showed very different progression patterns after treatment with TGFα in culture for 4 days (Fig. 8; Suppl. Fig. S1). For example, WT organoids could not progress to the 5-branch stage and were never larger than 250 µm in diameter. In contrast, greater than half of the Tg-OPN organoids progressed to the stage with 3 or more branches (including the stage with 5 or more branches) that were greater than 250 µm in diameter (Fig. 8).
Figure 8.

Transgenic osteopontin (Tg-OPN) induces ex vivo lobulogenesis. Mammary glands from 10-week-old nulliparous wild type (WT) and Tg-OPN mice were processed to organoids as described in Methods and cultured with or without TGFα for 4 days. Organoids were measured and placed into 1 of 6 categories (Suppl. Fig. S1). The percentage of total organoids for each category and the mean size are depicted in A, B, C, and D. Representative treated organoids isolated from 16-week-mammary glands of WT (E) at the 3-5 branched stage and Tg-OPN (F) at the >5 branched stage.
Discussion
Osteopontin is required for normal physiologic function but has also been shown to play a role in cancer progression and other diseases. Its contribution to tumor growth, angiogenesis, and metastasis has been vigorously studied, but a role for OPN in induction of neoplasia needs further attention. Here we sought to determine whether continuous OPN expression in MECs altered mammary gland development and/or the lactational cycle. These results would form a basis for future studies by defining the phenotypic changes in mammary gland and comparing those changes with what may occur in gland predisposed to neoplasia.
Regulated expression of OPN is essential in normal mammary gland development, but when dysregulated, OPN can play a role in mammary tumorigenesis. We show here that continuous expression of OPN in MECs of FVB/N Tg(MMTV-Opn)(1-3BOR) mice conferred an altered phenotype predisposed to hyperproliferation. The proliferation stimulus provided by OPN is unknown but led to larger TEBs in early development compared to wild type, more numerous TEBs, and larger ducts with more numerous side branching as development progressed and increased lobulogenesis at later time points. Continuous OPN expression also led to observable mammary gland changes in pregnancy and lactation and appeared to drive persistence with slower and especially incomplete involution.
In a previous study where OPN expression was suppressed in the mammary epithelium, development of normal lobuloalveolar structures was significantly decreased with only few, sparsely distributed individual patches throughout the fat pad leading to a virtual lack of milk synthesis in lactating animals.10 That phenotype and the one we describe here confirm that not only is OPN expression necessary for normal gland development, it must remain regulated. Indeed, OPN expression has been shown to vary with low to moderate levels of expression in the nulliparous and pregnant glands but extremely high levels in the lactating gland,7 so timing of expression is critical as well. It is not surprising that OPN expression is crucial for mammary gland development and can cause major changes if dysregulated based on its role in cell migration, invasion, and survival, critical steps for developing epithelial tissues embedded in a stroma.18
Some of the differences from normal that were observed in the Tg-OPN phenotype such as increased side-budding and with the ex vivo lobulogenesis assay, the majority of organoids progressing to multi-branching stages after TGFα treatment, could be due to several different mechanisms including epithelial-mesenchymal transition (EMT) and/or cooperative integrin and EGFR signaling.19 EMT is likely to be involved in normal mammary development although most of the current data are derived from cell culture models.20-22 Our data here suggest that OPN may induce cellular differentiation programs shifting the mammary epithelium toward a more immature and possibly a stem-like phenotype. This phenotype is also associated with a shift toward EMT and greater tissue plasticity. EMT is also important in mouse and human mammary tumors.23 Based on our observations in this study, and the data from many other labs associating both OPN expression and EMT phenotypes with cancer outcomes, we speculate the following: OPN overexpression or mis-expression by normal or cancer cells induces a more developmental phenotype characterized by a shift toward more immature cell lineages, greater plasticity, and heterogeneous adaptation including cell migration and EMT.
Alternatively, the proliferative stimulus for MECs conveyed by OPN may be due to an increase in the percentage of cells that express α6 integrin (CD49f+) and β1 integrin (CD29) as shown by our fluorescence-activated cell sorting analysis (Fig. 7). An increase in cells expressing β1 integrin, for example, could result in a larger population of cells that would respond to proliferative signals, including ones that activate EGFR and cooperative integrin and EGFR signaling.19 Moreover, most of the CD24lo, CD29hi CD49f+ cells are also positive for CD44, a known receptor for OPN.24 While the mechanism for this percentage increase in the Tg-OPN compared to WT is unknown, perhaps an increase in signaling of the receptor for OPN could be part of a positive feedback loop resulting in an increased population of cells that are responsive to proliferative signals. The flow data that show an improved yield of CD24+ cells also show a distinct increase in the CD24hi to CD24lo ratio. This appears to correspond to the luminal proliferative phenotype we have described and may indicate that there is an expansion of a proliferation capable, CD24hi, population of luminal progenitors or “transit-amplifying” cells.
Materials and Methods
Mice
Mammary directed expression of Spp1 (osteopontin) was achieved using the MMTV-LTR promoter sequence described previously.25 A full-length cDNA for mouse Spp1 was obtained by RT-PCR with FVB/N mouse mammary RNA template. The subcloned sequence segments were assembled with a pseudo-intron and polyadenylation signal, linearized and injected by pronuclear injection into FVB/N pronuclei by the UC Davis Murine Targeted Genomics Laboratory core facility. After reimplantation into pseudopregnant female mice, there were 20 live births that carried the transgene, 3 of which were successfully bred and passed the transgene germ line. Resulting live born pups were genotyped by tail PCR, bred, and regenotyped to document transgene transmission. For genotyping, total genomic DNA was isolated by DNeasy Tissue Kit (Qiagen, Inc., Valencia, CA) from mouse tails and tested by PCR analysis with OPN-ex1-F 5′-ATTTGCTTTTGCCTGTTTGG-3′, OPN-ex5-R 5′-CCTCAGTCCATAAGCCAAGC-3′, OPN-ex5-F 5′-TCTGATGAGACCGTCACTGC-3′, and OPN-ex6-R 5′-TTCGGAATTTCAGATACCTATCATC-3′ primers. PCR products were revealed by staining with ethidium bromide. Copy number analysis showed tandem repeat numbers of 45, 295, and 214 of the Opn gene for the 3 lines. The 2 founder lines with the higher copy numbers (214 and 295) were assessed for alteration in phenotype and found to be similar. FVB/N Tg(MMTV-Opn)(1-3BOR) mice were bred and maintained at the University of California, Davis, vivarium according to National Institutes of Health guidelines, and all procedures were conducted under approval of the Institutional Animal Care and Use Committee (IACUC).
Developmental analysis
For assessing effects of continuous OPN expression on mammary gland development, abdominal (#4) glands were harvested from age-matched transgenic mice and littermate controls not carrying the transgene at various weeks of age. Pituitary glands were also obtained from each mouse sacrificed to ensure alterations in mammary gland development were not due to pathologic changes in the pituitary. To assess effects of OPN on the pregnant mammary gland, matings were established between OPN mice and WT controls. Observation of a vaginal mucus plug was used as an indicator of pregnancy onset. Mice were then sacrificed at various time points after pregnancy onset. For lactation and involution assessment, mice were sacrificed at various times postpartum. Persistence was assessed in mammary glands of older parous and multiparous mice.
Mammary gland whole mounts, histology, and immunohistochemistry
Mammary gland whole mounts were prepared as described26 and photographed. Quantitative image analysis was performed on digital images using Aperio ImageScope software (Aperio Technologies, Vista, CA). For microscopic analysis, tissues were fixed overnight in 4% buffered formalin and transferred to 70% ethanol the next day. Samples were paraffin-embedded, sectioned at 4 µm, mounted on glass slides, and stained with Mayer’s hematoxylin and eosin. Some samples were immunostained as described in detail in Maglione et al.27 Briefly, goat anti-mouse OPN polyclonal antibody (1:800, R&D Systems, Minneapolis, MN), rabbit anti-Ki-67 Ab-4 (1:500, Neomarker, Fremont, CA), and rat anti-CD44 (1:100, Thermo Scientific, Kalamazoo, MI) were the primary antibodies used. Goat anti-rabbit and goat anti-rat secondary antibodies were used for signal amplification of Ki-67 and CD44, respectively (Vectastain ABC Kit, Vector Labs, Burlingame, CA), and horse anti-goat secondary was used for OPN (Vector Labs). Antibody complexes were detected using the DAB Peroxidase Substrate Kit (Vector Labs). Images of slides were captured using 4×, 20×, and 40× objectives on an AxioScope microscope (Carl Zeiss Inc., Thornwood, NY) with AxioCam camera and processed using Adobe Photoshop software (ver. 11.0.1, Adobe Systems, Inc., San Jose, CA).
Quantitative image analysis
The number and area of TEB were analyzed using Aperio ImageScope analysis software (Aperio, Vista, CA) after uploading images to the Aperio Spectrum database (version 10). For this, TEBs were carefully outlined at 20× magnification and total and mean area calculated with the analysis software. For quantitative measurement of branching and duct thickness, images were preprocessed using Fiji (ImageJ) 1.46j morphometric software.28 Images were processed with background subtraction, color deconvolution for hematoxylin and DAB, image inversion, and Local Contrast Enhancement (CLAHE). The processed images were then analyzed using AngioTool29 to measure junctions, duct length, and ductal area. Junctions per millimeter were calculated by dividing the number of junctions by duct length, whereas duct thickness was calculated by dividing ductal area by duct length. All results were scaled by 7 µm/pixel.
Organoid preparation
The second, third, and fourth mammary glands were removed from 10- to 16-week-old virgin wild type FVB/NJ or FVB/NJ Tg(OPN)1-3BOR mice and minced with 2 parallel razor blades (approved by IACUC at University of California, Davis). At this age the expansion of the ductal tree within the fat pad is complete and no TEBs exist. Minced tissue (6 glands) was gently shaken for 30 minutes at 37°C in a 50-mL conical centrifuge tube with a collagenase/trypsin mixture (0.2% trypsin, 0.2% collagenase type IV, 5% fetal calf serum, 5 µg/mL insulin, 50 µg/mL gentamycin, in 50 mL of DMEM/F12). The collagenase solution was discarded after centrifugation at 450 × g and the pellet was resuspended in 10 mL DMEM/F12. The suspension was pelleted again at 450 × g for 10 minutes, resuspended in 4 mL of DMEM/F12 + 40 µL of DNase (2 U/µL), and incubated for 5 minutes at ambient temperature with occasional shaking. The DNase solution was removed after centrifugation at 450 × g for 10 minutes. The DNase solution was discarded and the epithelial pieces were separated from the single cells through differential centrifugation. The pellet was resuspended in 10 mL of DMEM/F12 and pulsed to 500 × g. The supernatant was then removed and the pellet was resuspended in 10 mL DMEM/F12. Differential centrifugation was performed at least 4 times. The final pellet was resuspended in the desired amount of medium or Matrigel (Growth Factor Reduced Matrigel, BD Biosciences, San Jose, CA).
Morphogenesis assay
Morphogenesis assays were performed in 96-well culture plates. The culture had 2 layers, an underlay of 50 µL of Matrigel (Growth Factor Reduced Matrigel, BD Biosciences) and an overlying layer of organoids suspended in Matrigel. The underlay was allowed to set for 30 minutes at 37°C, and then a 100 µL suspension of organoids in Matrigel (~100-200 organoids/100 µL of Matrigel) was added to the well followed by an incubation of 30 minutes at 37°C. All wells were then treated with 150 µL of basal media (DMEM/F12 with 1% insulin, transferrin, selenium, and 1% penicillin/streptomycin) for 24 hours. After 24 hours, the basal media was replenished (untreated samples) or growth factor TGFα (9 nM; Sigma, Saint Louis, MO) FGF was added to basal media. To determine the morphogenic response, all organoids within each well (~100-200 organoids/well) were scored into 1 of 6 categories (Suppl. Fig. S1): solid organoids, open spheroid, complex cyst, those with 1 to 2 branches, 3 to 5 branches, or those with more than 5 branches.30
Flow cytometry
Single cell suspensions were prepared for flow cytometric analysis. For that, mouse mammary fat pads were dissected as described above and collected from OPN+/- or WT female mice, washed in phosphate-buffered saline (PBS), and minced using a sterile razor blade. The tissue was then placed in a filtered digestion buffer that contained serum free DMEM/F12 (50/50, v/v), 7.5% bovine serum albumin fraction V, 1 M HEPES buffer, 10 µg/mL insulin, and 3 mg/mL collagenase IV (Worthington Biochemical Corp., Lakewood, NJ). Tissues were digested overnight on a rotator at room temperature, centrifuged to acquire a pellet, and then washed twice with 1:1 serum-free DMEM/F12. The cell suspension was then rinsed 2 times in PBS and excess amounts of fat still present were aspirated. Cell pellets were then trypsinized (0.2%) and incubated at 37°C for 2 minutes after which 100 µL DNase (2 U/µL) was added to each sample. Cells were further incubated in 37°C for a total of 10 minutes, after which the trypsin was inactivated with DMEM containing 10% fetal bovine serum. Subsequent to centrifugation, the remaining pellet was washed and resuspended in PBS. Cells were filtered through 5-mL polystyrene round-bottom tubes with cell-strainer caps (BD Biosciences), to remove any remaining cellular aggregates, and transferred to 5-mL polypropylene round-bottom tubes (BD Biosciences).
Cells were then stained using fluorescently tagged antibodies optimized for multicolor flow cytometry, and 1 compensation control was provided for each antibody used in the sample. The antibodies used were from BD Biosciences except where indicated. They were FITC hamster anti-rat CD29, PE hamster anti-mouse CD61, BD Horizon V450 anti-mouse CD44, PE-Cy7 rat anti-mouse CD31, PE-Cy7 rat anti-mouse CD45, PE-Cy7 rat anti-mouse Ter119, PerCP-eFluor 710 anti-mouse CD24 (eBioscience, San Diego, CA), and APC anti-human/mouse CD49f (Biolegend, San Diego, CA). Propidium iodide (PI) was used as viability dye. Unstained controls were provided for each sample. Gating controls excluding the antibody of interest, stained with the rest of the panel, were provided for each antibody. Gating path to the CD24 versus CD29 plot (Suppl. Fig. S2): forward scatter versus side scatter (exclusion of cell debris), forward scatter versus pulse width (exclusion of doublets), PI negativity (exclusion of dead cells), selection of lineage negative cells (exclusion of Lin+ populations positive for CD31, CD45, and Ter119 based on Pe-CY7 expression), selection of CD49f+ cells (APC positive). Cell suspensions were analyzed on an LSRII flow cytometer (Applied Biosystems, Foster City, CA).
Acknowledgments
The authors acknowledge important contributions from Ms. Rosina Fosati in preparing portions of the transgenic construct, Dr. Jamie Bascom for help with the in vitro Alveologenesis assay, Mr. Robert Munn for assistance in photomicroscopy and digital imaging, Dr. Jose Galvez for use of the whole-slide imaging system, and Zoomify browser and Carol Oxford for flow cytometry guidance. Ms. Lisa Dillard, Ms. Katie Bell, and Ms. Pan Soonsawad helped with histotechnology and immunohistochemistry. The UC Davis Mouse Biology Program and the Murine Targeted Genomics Laboratory core lab with UC Davis Cancer Center support performed the pronuclear injections and initial founder line development.
Footnotes
Supplementary material for this article is available on the Genes & Cancer website at http://ganc.sagepub.com/supplemental.
Declaration of Conflicting Interests: The author(s) declared no potential conflicts of interest with respect to the research, authorship, and/or publication of this article.
Funding: The author(s) disclosed receipt of the following financial support for the research, authorship, and/or publication of this article: Funding provided by NIH, K26RR024037, and NIH, U01CA 141582.
References
- 1. Sweeney EE, McDaniel RE, Maximov PY, Fan P, Jordan VC. Models and mechanisms of acquired antihormone resistance in breast cancer: significant clinical progress despite limitations. Horm Mol Biol Clin Investig. 2012;9:143-63 [DOI] [PMC free article] [PubMed] [Google Scholar]
- 2. Borowsky A. Special considerations in mouse models of breast cancer. Breast Dis. 2007;28:29-38 [DOI] [PubMed] [Google Scholar]
- 3. Borowsky AD. Choosing a mouse model: experimental biology in context—the utility and limitations of mouse models of breast cancer. Cold Spring Harb Perspect Biol. 2011;3:a009670. [DOI] [PMC free article] [PubMed] [Google Scholar]
- 4. Hassiotou F, Geddes D. Anatomy of the human mammary gland: current status of knowledge. Clin Anat. 2013;26:29-48 [DOI] [PubMed] [Google Scholar]
- 5. Colak D, Nofal A, Albakheet A, et al. Age-specific gene expression signatures for breast tumors and cross-species conserved potential cancer progression markers in young women. PLoS One. 2013;8:e63204. [DOI] [PMC free article] [PubMed] [Google Scholar]
- 6. Shevde LA, Das S, Clark DW, Samant RS. Osteopontin: an effector and an effect of tumor metastasis. Curr Mol Med. 2010;10:71-81 [DOI] [PMC free article] [PubMed] [Google Scholar]
- 7. Rittling SR, Novick KE. Osteopontin expression in mammary gland development and tumorigenesis. Cell Growth Differ. 1997;8:1061-9 [PubMed] [Google Scholar]
- 8. Nagatomo T, Ohga S, Takada H, et al. Microarray analysis of human milk cells: persistent high expression of osteopontin during the lactation period. Clin Exp Immunol. 2004;138:47-53 [DOI] [PMC free article] [PubMed] [Google Scholar]
- 9. Brown LF, Berse B, Van de Water L, et al. Expression and distribution of osteopontin in human tissues: widespread association with luminal epithelial surfaces. Mol Biol Cell. 1992;3:1169-80 [DOI] [PMC free article] [PubMed] [Google Scholar]
- 10. Nemir M, Bhattacharyya D, Li X, Singh K, Mukherjee AB, Mukherjee BB. Targeted inhibition of osteopontin expression in the mammary gland causes abnormal morphogenesis and lactation deficiency. J Biol Chem. 2000;275:969-76 [DOI] [PubMed] [Google Scholar]
- 11. Tuck AB, Chambers AF. The role of osteopontin in breast cancer: clinical and experimental studies. J Mammary Gland Biol Neoplasia. 2001;6:419-29 [DOI] [PubMed] [Google Scholar]
- 12. El-Tanani MK, Yuen HF, Shi Z, et al. Osteopontin can act as an effector for a germline mutation of BRCA1 in malignant transformation of breast cancer-related cells. Cancer Sci. 2010;101:1354-60 [DOI] [PMC free article] [PubMed] [Google Scholar]
- 13. Wai PY, Kuo PC. Osteopontin: regulation in tumor metastasis. Cancer Metastasis Rev. 2008;27:103-18 [DOI] [PubMed] [Google Scholar]
- 14. Hartung F, Weber GF. RNA blood levels of osteopontin splice variants are cancer markers. Springerplus. 2013;2:110. [DOI] [PMC free article] [PubMed] [Google Scholar]
- 15. Mirza M, Shaughnessy E, Hurley JK, et al. Osteopontin-c is a selective marker of breast cancer. Int J Cancer. 2008;122:889-97 [DOI] [PubMed] [Google Scholar]
- 16. Jessen KA, Liu SY, Tepper CG, et al. Molecular analysis of metastasis in a polyomavirus middle T mouse model: the role of osteopontin. Breast Cancer Res. 2004;6:R157-69 [DOI] [PMC free article] [PubMed] [Google Scholar]
- 17. Mailleux AA, Overholtzer M, Schmelzle T, Bouillet P, Strasser A, Brugge JS. BIM regulates apoptosis during mammary ductal morphogenesis, and its absence reveals alternative cell death mechanisms. Dev Cell. 2007;12:221-34 [DOI] [PMC free article] [PubMed] [Google Scholar]
- 18. Streuli CH, Bailey N, Bissell MJ. Control of mammary epithelial differentiation: basement membrane induces tissue-specific gene expression in the absence of cell-cell interaction and morphological polarity. J Cell Biol. 1991;115:1383-95 [DOI] [PMC free article] [PubMed] [Google Scholar]
- 19. Bill HM, Knudsen B, Moores SL, et al. Epidermal growth factor receptor-dependent regulation of integrin-mediated signaling and cell cycle entry in epithelial cells. Mol Cell Biol. 2004;24:8586-99 [DOI] [PMC free article] [PubMed] [Google Scholar]
- 20. Eades G, Yao Y, Yang M, Zhang Y, Chumsri S, Zhou Q. miR-200a regulates SIRT1 expression and epithelial to mesenchymal transition (EMT)-like transformation in mammary epithelial cells. J Biol Chem. 2011;286:25992-6002 [DOI] [PMC free article] [PubMed] [Google Scholar]
- 21. Foroni C, Broggini M, Generali D, Damia G. Epithelial-mesenchymal transition and breast cancer: role, molecular mechanisms and clinical impact. Cancer Treat Rev. 2011;38:689-97 [DOI] [PubMed] [Google Scholar]
- 22. Thiery JP, Acloque H, Huang RY, Nieto MA. Epithelial-mesenchymal transitions in development and disease. Cell. 2009;139:871-90 [DOI] [PubMed] [Google Scholar]
- 23. Damonte P, Gregg JP, Borowsky AD, Keister BA, Cardiff RD. EMT tumorigenesis in the mouse mammary gland. Lab Invest. 2007;87:1218-26 [DOI] [PMC free article] [PubMed] [Google Scholar]
- 24. Anborgh PH, Mutrie JC, Tuck AB, Chambers AF. Role of the metastasis-promoting protein osteopontin in the tumour microenvironment. J Cell Mol Med. 2010;14:2037-44 [DOI] [PMC free article] [PubMed] [Google Scholar]
- 25. Guy CT, Cardiff RD, Muller WJ. Induction of mammary tumors by expression of polyomavirus middle T oncogene: a transgenic mouse model for metastatic disease. Mol Cell Biol. 1992;12:954-61 [DOI] [PMC free article] [PubMed] [Google Scholar]
- 26. Rasmussen S, Young L, Smith G. Preparing mammary gland whole mounts from mice. In: Ip M, Asch B, editors. Methods in mammary gland biology and breast cancer research. New York: Kluwer Academic/Plenum; 2000. p. 75-85 [Google Scholar]
- 27. Maglione JE, McGoldrick ET, Young LJ, et al. Polyomavirus middle T-induced mammary intraepithelial neoplasia outgrowths: single origin, divergent evolution, and multiple outcomes. Mol Cancer Ther. 2004;3:941-53 [PubMed] [Google Scholar]
- 28. Walter T, Shattuck DW, Baldock R, et al. Visualization of image data from cells to organisms. Nat Methods. 2010;7(3 Suppl):S26-41 [DOI] [PMC free article] [PubMed] [Google Scholar]
- 29. Zudaire E, Gambardella L, Kurcz C, Vermeren S. A computational tool for quantitative analysis of vascular networks. PLoS One. 2011;6:e27385. [DOI] [PMC free article] [PubMed] [Google Scholar]
- 30. Simian M, Hirai Y, Navre M, Werb Z, Lochter A, Bissell MJ. The interplay of matrix metalloproteinases, morphogens and growth factors is necessary for branching of mammary epithelial cells. Development. 2001;128:3117-31 [DOI] [PMC free article] [PubMed] [Google Scholar]