

Abstract
Epstein–Barr virus (EBV) is associated with multiple malignancies including nasopharyngeal carcinoma (NPC). In nasopharynx cancer, CD8+ T cells specific for EBV Nuclear Antigen-1 (EBNA-1) and Latent Membrane Protein 2 (LMP2) are important components of anti-tumor immunity since both are consistently expressed in NPC. We have previously shown that EBNA-1-specific CD8+ T cell responses were suppressed in NPC patients compared to healthy controls. We now find that CD8+ T cell responses specific for LMP2 are also abnormal in NPC patients, and both EBNA-1- and LMP2-specific responses are suppressed by regulatory T cells (Treg). EBNA-1 and LMP2-specific CD8+ T cell responses, as well as immune control of EBV-infected cells in vitro, could be restored by the depletion of Tregs and by use of a clinically approved drug targeting Tregs. Thus, in vivo modulation of Tregs may be an effective means of enhancing these anti-tumor immune responses in NPC patients.
Keywords: Epstein–Barr virus, Nasopharyngeal carcinoma, CD8+ T cells, T regulatory cells, Ontak
Introduction
Epstein–Barr virus (EBV) is a herpesvirus that infects nearly all humans by adulthood. Primary infection usually occurs early in life, and EBV infection is controlled, but not eliminated, by the host immune response resulting in a lifelong, asymptomatic, persistent infection (Rickinson and Kieff, 2007). Occasionally, persistent EBV infection is complicated by the development of EBV-positive malignancies such as Hodgkin Lymphoma (HL) and nasopharyngeal carcinoma (NPC).
Viral proteins expressed in these tumors are immunogenic, non-self tumor antigens, yet anti-viral immunity may be unable to prevent or eradicate these virus associated tumors for multiple reasons. Both HL and NPC express a limited number of viral proteins, EBV Nuclear Antigen-1 (EBNA-1), and two Latent Membrane Proteins (LMP1 and LMP2) (Deacon et al., 1993; Murray et al., 1996; Niedobitek et al., 1992), and the CD8+ T cell response directed toward these proteins are sub-dominant (Hislop et al., 2007). Discovering ways to increase EBV-specific, anti-tumor CD8+ T cells is an active area of investigation for vaccine development and immunotherapeutics against EBV-associated cancers (Smith et al., 2012; Louis et al., 2009; Di Stasi et al., 2009).
A suppressive tumor microenvironment can also represent a significant barrier to successful anti-tumor immunity by inhibiting the EBV-specific CD8+ T cell response against EBV-infected malignancies. HL is characterized by an inflammatory cell infiltrate surrounding Reed–Sternberg cells with robust expression of immunosuppressive cytokines (Marshall et al., 2004). NPC is also referred to as a lymphoepithelioma due to infiltration of tumors with T cells (Herait et al., 1987) that create an immunosuppressive environment (Klibi et al., 2009). Identifying and overcoming pathways in NPC and HL patients that suppress EBV-specific immunity may provide a synergistic mechanism for improving therapy of EBV-associated malignancies.
We previously reported that EBNA-1-specific CD8+ T cell responses from the majority of NPC patients were abnormal because they failed to respond to their own EBV-infected B cells (Fogg et al., 2009). EBNA-1-specific CD8+ T cells could be expanded by stimulation with peptides derived from EBNA-1 in the presence of cytokines, thus indicating the abnormality in NPC patients was not due to a lack of EBNA-1-specific CD8+ T cells. Instead, the data suggested EBNA-1-specific CD8+ T cells were being suppressed in the presence of EBV-infected cells. In the current study, we find that this immune abnormality in NPC patients extends to CD8+ T cell responses specific for LMP2, another viral protein expressed in NPC. Furthermore, we identify that EBNA-1- and LMP2-specific CD8+ T cell responses are suppressed by Tregs, and the suppression of these anti-viral responses is reversible in many cases by depletion of Tregs. Understanding the extent, prevalence, and mechanism of this suppression may be important for developing new immune therapies for NPC.
Results
Abnormal LMP2-specific CD8+ T cell responses to EBV-infected cells in NPC patients
We evaluated the in vitro expansion of LMP2-specific CD8+ T cells after stimulation with autologous, EBV transformed lymphoblastoid B cell lines versus LMP2 peptides in NPC patients and healthy donors. We identified the LMP2 epitopes recognized by EBV- and peptide-stimulated T cell lines to ask whether the repertoire of LMP2-specific CD8+ T cells from NPC patients was the same after EBV versus peptide stimulation.
First, PBMC from 27 NPC patients were repetitively stimulated with their irradiated LCL to generate EBV-stimulated T cell lines (Fogg et al., 2009; Straathof et al., 2005). LMP2-specific CD8+ T cell epitopes were identified in the EBV-stimulated T cell lines by incubation with individual LMP2 peptides in IFN-γ ELISPOT assays (Fig. 1A, black bars). Four NPC patients had no LMP2-specific T cell responses (NPC13, 35, 44, and 43). Sixteen patients recognized a single epitope (NPC8, 11, 15, 30, 31, 45, 6, 27, 34, 39, 42, 14, 26, 1, 29, and 2), and seven NPC patients recognized 2 epitopes (NPC17, 38, 46, 9, 12, 19, and 4) for an average of 1.1 epitopes per NPC patient recognized by CD8+ T cells after stimulation with LCL.
Fig. 1.

Repertoire of the LMP2-specific CD8+ T cell response in NPC patients and healthy donors. The number of distinct LMP2 epitopes recognized by PBMC from individual NPC patients (A) and healthy donors (B) in T cell lines stimulated with LCL (black bars) or a pool of overlapping LMP2 peptides (white bars). LMP2 epitopes in the T cell lines were identified by responses to individual LMP2 peptides in IFN-γ ELISPOT assays and (C) the average number of LMP2 epitopes in T cell lines stimulated with EBV or peptide are shown. Statistical significance was determined by Students t test.
Next, PBMC from the same NPC patients were stimulated with a pool of overlapping LMP2 peptides in the presence of cytokines to generate peptide-stimulated T cells. After 10–14 days the peptide-stimulated lines were depleted of CD4+ T cells, and the number of LMP2 epitopes recognized by the LMP2-specific CD8+ T cell response was determined. Strikingly, in 15 patients, peptide-stimulated T cells recognized more LMP2 epitopes than the EBV-stimulated T cells (Fig. 1A, white bars versus black bars, NPC43, 6, 27, 34, 39, 42, 14, 26, 1, 29, 2, 9, 12, 19, and 4). These NPC patients recognized on average 2.1 epitopes per patient when LMP2-specific CD8+ T cells were stimulated using peptides. In each case, peptide-stimulated T cell lines recognized all of the epitopes recognized by EBV-stimulated T cell lines, thus peptide stimulation was inclusive of, but more comprehensive than, EBV stimulation. Overall, peptide-stimulated CD8+ T cells from all NPC patients recognized an average of 2.1 epitopes per NPC patient, and this was significantly more than the average number of epitopes recognized by CD8+ T cells after stimulation with the patient’s own EBV-infected cells (Fig. 1C; 2.1 epitopes in LMP2 peptide-stimulated T cell lines versus 1.1 epitopes in EBV-stimulated T cell lines, p=0.0008 paired Students t test).
Similar experiments were carried out using PBMC from healthy, EBV seropositive donors, and the same number and sequence of LMP2 epitopes were recognized by EBV-stimulated (Fig. 1B, black bars) as peptide-stimulated (Fig. 1B, white bars) T cell lines in all cases studied, i.e. EBV stimulation was as comprehensive as peptide stimulation in healthy donors. Overall, the average number of LMP2 epitopes recognized in EBV-stimulated T cell lines from healthy donors was 2.6 (Fig. 1B, black bars), and the average number of LMP2 epitopes recognized by peptide-stimulated T cell lines was 2.7 per donor (Fig. 1B, white bars). Thus, NPC patients have a similar capacity of LMP2-specific CD8+ T cells as healthy donors (Fig. 1C, 2.1 versus 2.7 epitopes for NPC versus healthy donors after peptide stimulation; compare white bars), but LMP2-specific CD8+ T cells from NPC patients responded abnormally when stimulated by EBV-infected cells with recognition of significantly fewer epitopes (Fig. 1C; compare black bars, 1.1 versus 2.6 epitopes, p=0.0003 Students t test).
Depletion of Tregs augments EBV-specific CD8+ T cell responses in EBV-stimulated T cell lines generated from NPC patients
We investigated whether Tregs were responsible for the abnormal response of EBV-specific CD8+ T cell responses in NPC patients. First, we asked whether CD4+ T cells might contain a population of suppressor cells by depleting CD4+ T cells from the PBMC of NPC patients (greater than 97% of CD4+ T cells were selectively removed from PBMC by immunomagnetic depletion), and then repetitively stimulating the CD4-depleted PBMC with LCL to generate EBV-stimulated T cell lines. We had sufficient PBMC for cell depletion studies in 5 NPC patients (NPC6, 9, 14, 15, and 17) with abnormal EBNA-1-specific CD8+ T cell responses (Supplementary Table 1). The abnormal EBNA-1 response in NPC patients is readily detected by an absent/present EBNA-1 response in EBV-versus peptide-stimulated T cells since the EBNA-1-specific CD8+ T cell response is usually limited to recognition of a single dominant epitope (Fogg et al., 2009). As expected from the depletion of helper T cells, the total cell numbers were reduced in EBV-stimulated T cell lines derived from CD4-depleted PBMC (average 3-fold increase, range 2–6 fold) compared to non-depleted PBMC (average 16-fold increase, range 3–32). Despite the smaller in vitro expansion, EBNA-1-specific CD8+ T cells responses were rescued in 3 of 5 T cell lines generated from CD4-depleted PBMC (NPC6, 15, and 17, Fig. 2, black bars), whereas EBNA-1-specific T cell responses remained undetectable in mock-depleted T cell lines where CD4+ T cells were present (Fig. 2, white bars).
Fig. 2.
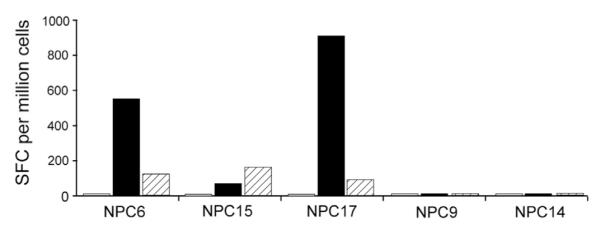
EBNA-1-specific CD8+ T cell responses can be rescued by removal of CD4+ or CD25(hi) T cells from NPC PBMC. PBMC depleted of CD4+ T cell lines (black bars), CD25hi cells (hatched bars), or non-depleted PBMC (white bars) were stimulated with LCL and EBNA-1 specific CD8+ T cell responses were detected by IFN-γ ELISPOT after incubation with an EBNA-1 peptide pool. Results from a representative experiment are expressed as the number of EBNA-1-specific spot forming cells (SFC) per million input cells.
To more specifically identify whether the inhibitory cells in the CD4+ T cell population were Tregs, cells expressing the IL-2 receptor alpha chain at high levels (CD25hi) were immunodepleted from PBMC prior to generation of EBV-stimulated T cell lines from the same 5 NPC patients. Immunomagnetic depletion of CD25hi cells resulted in >66% decrease of CD4+ CD25hi staining cells in all cases (range 66%–78%) with a concurrent >71% decrease in FoxP3 positive cells (range 71%–82%), a representative FACS plot is shown in Fig. 3A. CD25hi depleted PBMC were repetitively stimulated with EBV-infected cells to generate EBV-stimulated T cell lines (average 11-fold increase in cells; range 2–18 fold). EBNA-1-specific CD8+ T cell responses were restored using CD25hi depleted PBMC from the same 3 of 5 NPC patients (Fig. 2, hatched bars, NPC6, 15, and 17) where CD4+ T cell depletion also restored EBNA-1-specific T cell responses. Thus, depletion of CD4+ T cells, and specifically CD25hi cells, can restore EBNA-1-specific CD8+ T cell responses to EBV-infected cells in a subset of NPC patients in vitro, consistent with Treg-mediated immune suppression of anti-tumor responses in some NPC patients.
Fig. 3.

Ontak treatment of NPC PBMC reduces CD4+ T cells with a Treg phenotype. NPC PBMC were treated overnight with 5 mM Ontak. The percent of CD25hi cells (top panels) and CD25hi/FoxP3+ cells (bottom panels) was determined pre- (left panels) and post-Ontak treatment (right panels).
Pharmacologic mediated depletion of Tregs enhances EBV-specific T cell responses in EBV-stimulated T cell lines generated from NPC patients
To investigate a more readily translatable approach to reverse Treg-mediated suppression of anti-tumor responses in NPC patients, we tested whether a clinically approved drug targeting Tregs could reverse suppression of EBV-specific immune responses in vitro. Ontak (denileukin diftitox) is a recombinant protein consisting of the human interleukin 2 sequence genetically fused to the catalytic and transmembrane domains of diphtheria toxin, thereby specifically targeting cells expressing CD25 for toxin mediated cell killing (Williams et al., 1990). As shown in Fig. 3, overnight treatment NPC PBMC with 5 mM Ontak reduced the number of CD4+/CD25hi T cells from 9.44% to 5.61% and the number of CD25hi/FoxP3+ cells from 10.3% to 7.25%. Thus, Ontak treatment does eliminate cells with a Treg phenotype and the average Ontak mediated reduction was 48% (range 27%–56%; n=6) for CD4+/CD25hi T cells and 44% (range 26%–58%; n=6) for CD25hi/FoxP3+ T cells. This analysis likely underestimates the actual Treg depletion since the in vitro culture of PBMC can also stimulate a new CD25hi/FoxP3+ activated T cell population that masks the loss of CD25hi/FoxP3+ Tregs.
Ontak or mock treated PBMC were repetitively stimulated with LCL to generate EBV-stimulated T cell lines from 11 NPC patients with abnormal EBNA-1-specific CD8+ T cell responses to EBV-infected cells, and one patient with intact EBNA-1 responses to both EBV-infected cells and peptides. The T cell expansion was slightly greater with Ontak versus mock treated PBMC (average 8-fold increase, range 3–18, versus 6-fold increase, range 2–13). There was no significant difference in the phenotype of the T cell lines derived from Ontak or mock treated PBMC (average 89% CD3+, 69% CD8+, and 19% CD4+).
EBNA-1-specific CD8+ T cell responses to EBV-infected cells were restored by Ontak treatment of PBMC in 7 of the 11 NPC patients with abnormal EBNA-1-specific immune responses (Fig. 4A, black bars, NPC6, 13, 15, 17, 27, 29, and 43). No EBNA-1-specific T cell responses were detected in EBV-stimulated T cell lines derived from their mock treated PBMC (Fig. 4A, open bars). Ontak did not have an adverse effect on EBNA-1-specific responses in NPC patient 26 who had an intact EBNA-1 specific response to EBV and peptide stimulation. Ontak treatment of PBMC did not rescue EBNA-1-specific CD8+ T cell responses in the remaining four patients (NPC9, 12, 14, 31).
Fig. 4.

Ontak treatment of PBMC from NPC patients rescues EBNA-1 and LMP2-specific CD8+ T cell responses. PBMC from NPC patients were treated overnight with Ontak (black bars) or mock treated (white bars), and then stimulated with EBV-infected cells to generate T cell lines. EBNA-1- and LMP2-specific T cell responses present in the T cell lines were detected by IFN-γ ELISPOT using either an EBNA-1 peptide pool (A) to determine the number of EBNA-1-specific spot forming cells (SFC) per million input cells, or LMP2 peptide pools (B) to determine the number of individual LMP2 epitopes recognized.
In 9 of 12 patients the effect of Ontak on the LMP2-specific CD8+ T cell response was also determined (Fig. 4B). Ontak treatment of PBMC led to an increased repertoire of LMP2-specific CD8+ T cells in response to EBV-infected cells in four NPC patients (NPC6, 9, 26, and 27). Ontak treatment of PBMC did not increase the repertoire of LMP2-specific T cells in the other five NPC patients (NPC12, 13, 15, 17 and 31). Thus, Ontak treatment could improve EBV-specific responses, either EBNA-1, LMP2, or both, in 9 of 12 NPC patients.
Ontak enhances immune control of EBV-infected cells by PBMC from NPC patients
We next asked whether Ontak treatment of PBMC from NPC patients translates into improved immune control of EBV-infected cells as a surrogate measure for improved anti-tumor responses in vivo. Moss et al. (1983) reported impaired EBV-specific immunity in NPC patients detectable by an in vitro regression assay. In this assay, PBMC are infected with EBV in vitro, and multiple replicates of PBMC are cultured at decreasing numbers, so that T cells are present in gradually limiting numbers. EBV infection immortalizes B cell growth, and the minimum number of EBV-specific T cells necessary to mediate control, or regression, of EBV-immortalized B cell growth is a reflection of EBV-specific immunity, i.e. fewer T cells are required to control growth when EBV-specific immune responses are more robust.
Regression assays from five healthy donors showed an average of 28,223 PBMC were required to control growth of EBV-infected cells in 50% of the replicates, whereas PBMC from eight NPC patients showed 76,828 PBMC were required for 50% regression (Fig. 5, compare black squares with black circles, p=0.05 Mann-Whitney U test). These results are similar to those described by Moss et al. (1983). The level of EBV immune responses are variable from person-to-person, but an increased number of PBMC from NPC patients overall are required to efficiently control EBV infection, i.e. the T cell response in NPC patients is less effective at controlling EBV infection.
Fig. 5.
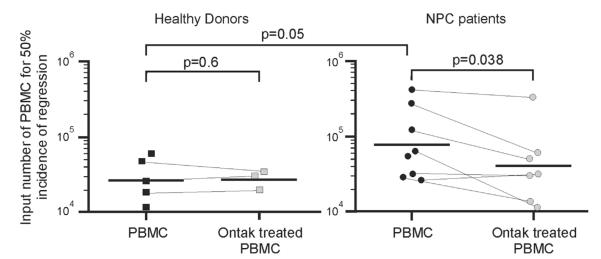
Ontak treatment of NPC PBMC restores EBV immunity detected by enhanced regression of EBV-induced cell growth. PBMC from healthy donors (squares) and NPC patients (circles) were treated overnight with Ontak (shaded) or mock treated (black). PBMC were then infected with EBV, replicate plated at varying cell numbers, and scored for outgrowth of EBV-infected cells after several weeks in culture. The cell number where 50% of replicates showed outgrowth of EBV-infected cells, i.e. 50% regression, was calculated according to the formula of Reed and Muench. Significance between healthy donors and NPC patients was determined by Mann-Whitney U test, and significance of Ontak treatment by paired Students t test.
Ontak treatment of PBMC from seven NPC patients improved the regression value from an average of 80,550–41,445 PBMC (Fig. 5, compare black circles with shaded circles), a significant recovery in the average regression value (49%, p=0.038, paired Students t test). There was no significant effect following Ontak treatment of PBMC from three healthy donors (average of 29,197–27,841 following treatment, p=0.6). Thus, Ontak can reverse suppression of EBV-specific T cell responses, resulting in a significant overall improvement in immune control of EBV-infected cells in vitro by NPC patients.
Discussion
In the current study, we found: (1) EBV-specific CD8+ T cell responses to LMP2, a viral protein expressed in most EBV-associated malignancies, are abnormal in many NPC patients, (2) Tregs (CD25hi cells) suppress both EBNA-1- and LMP2-specific CD8+ T cell responses in NPC patients, (3) physical Treg depletion or pharmacologic therapy with Ontak removes suppression and restores EBV-specific CD8+ T cell responses from many NPC patients and (4) Ontak treatment of PBMC from NPC patients results in enhanced in vitro immune control of EBV-infected cells.
Tregs are a physiologic response to chronic antigen stimulation in persistent virus infections such as Hepatitis B and C (Xu et al., 2006; Cabrera et al., 2004), as well as EBV (Marshall et al., 2003; Voo et al., 2005). Voo et al. (2005) identified EBNA-1-specific CD4+ T cell clones with a Treg phenotype in healthy, EBV seropositive individuals that could suppress anti-CD3 induced cell proliferation. In our assay system, we did not see any functional evidence of Treg-mediated suppression in healthy individuals, suggesting that the Tregs in our NPC patients were either more abundant or active compared to healthy donors with normal persistent EBV infection. In our in vitro model, PBMC are co-cultured with EBV-infected cells to stimulate the expansion of EBNA-1- and LMP2-specific CD8+ T cells. Tregs in the PBMC of NPC patients may already be pre-activated in vivo or may be activated upon exposure to the EBV-infected cell in vitro; either may prevent the expansion of EBNA-1 and LMP2-specific CD8+ T cells. It is also a possibility that Tregs suppress the CD8+ T cell activity detected in ELISPOT assays, although this would require that the Tregs be propagated for weeks in EBV-stimulated T cell lines. EBV-specific responses may not be suppressed after peptide and cytokine stimulation because EBV-infected cells are not present to activate Tregs, or the potent stimulation of CD8+ T cells in the presence of cytokines may simply override the Treg suppressive effect.
This excessive Treg activity in NPC patients may arise through their continuous stimulation from the high antigenic load associated with the presence of an EBV-positive tumor. Alternatively, increased Treg numbers or function could be a primary event that contributes to the development of malignancy, i.e. those individuals with higher Treg activity during persistent EBV infection may be at increased risk for EBV-associated cancers due excessive Treg suppression of EBV immunity.
Tregs have been described and implicated in EBV-associated NPC. Li et al. (2011a) found higher numbers of CD4+ CD25+ cells in the peripheral blood of 67 NPC patients compared to 20 healthy donors (>7% versus 2.8%). Cells of a Treg phenotype can also be found in NPC tumor infiltrates (Lau et al., 2007), and the same study also found increased levels of circulating Tregs in the peripheral blood of NPC patients compared to healthy controls. More recently, Li et al. (2011b) described CD8+ Tregs present at increased frequencies in the peripheral blood of NPC patients compared to healthy controls, and these cells could also be detected in the tumor infiltrate. Our study significantly extends these observations by demonstrating a functional consequence of Tregs on EBV- and tumor-specific CD8+ T cell responses in NPC patients. Furthermore, we show that removing the Treg suppression from PBMC of NPC patients can result in enhanced control of the patient’s own EBV-infected cells. It remains to be determined whether Tregs in NPC patients are EBV-specific in terms of their activation and effector function. We were not able to rescue tumor-specific T cell responses in all NPC patients. In these non-responding cases, suppression may be due to mechanisms not involving Tregs, or tumor-specific CD8+ T cell responses may have been suppressed in these patients beyond a point of recovery.
The rescue of EBV-specific responses in NPC patients by removing Treg-mediated suppression with Ontak has important clinical implications that could be readily translated and tested in NPC patients. Historically, Ontak has had limited clinical efficacy in melanoma trials where it was used in attempts to break tolerance to self-antigens expressed on tumor cells (Mahnke et al., 2007; Morse et al., 2008). However, the immunobiology of NPC is quite different since EBV-specific CD8+ T cells already exist in patients, and once Treg suppression is removed by Ontak the anti-tumor cells might be readily expanded. Thus, there are several therapeutic models that could be tested. Simply treating patients with Ontak, or other agents that target Tregs, may result in expansion of tumor-specific CD8+ T cells in vivo, as we have modeled in vitro, resulting in a direct clinical effect against the tumor. Alternatively, Ontak may be useful as an adjuvant to adoptive immunotherapy using EBV-specific T cells. Pretreatment of NPC patients with Ontak could increase the number of tumor-specific CD8+ T cells in the peripheral blood so that in vitro expansion of EBV-specific T cells produces a more robust EBV-specific T cell product, containing increased EBNA-1 and LMP2-specific CD8+ T cells for adoptive transfer. Ontak may provide additional benefit by removing the immunosuppressive element from the tumor microenvironment, allowing for more effective killing at the tumor site after adoptive transfer of EBV-specific T cells.
In conclusion, we show that the EBV- and tumor-specific CD8+ T cell response is suppressed in many NPC patients, it is salvageable by the depletion of Tregs, and Ontak mediated removal of Treg immunosuppression may be a viable and effective therapy to enhance anti-tumor responses in EBV-associated NPC.
Materials and methods
Human subjects
Peripheral blood was obtained by informed consent from healthy donors under an IRB approved protocol at Brigham and Women’s Hospital. Peripheral blood was obtained from patients with EBV-associated NPC confirmed by EBER in situ hybridization under an IRB approved protocol at the Dana Farber Cancer Institute.
Peptides
102 peptides spanning EBNA-1 (15mer peptides overlapping by 11 residues, spanning the N-terminal 96 and C-terminal 334 residues) and 97 peptides spanning LMP2 (15mers and one 12mer, overlapping by 10 residues) were synthesized by F-moc chemistry at the Massachusetts General Hospital peptide core facility (Charlestown, MA). Individual peptides were resuspended at 100 mg/ml in 100% DMSO (Sigma). The final concentration used for stimulation in pools, or as individual peptides, was 1–2 μg/ml.
Peripheral blood mononuclear cell purification, EBV transformed B cell line generation, and T cell subset depletion
PBMC were separated from heparinized blood by density centrifugation. Autologous EBV transformed lymphoblastoid B cell lines (LCL) were generated by incubation of PBMC with supernatant from the B95-8 cell line (Miller and Lipman, 1973). CD4+ or CD25+ cells were depleted from PBMC by immunomagnetic selection (Dynal). Efficient depletion was confirmed by flow cytometric analysis on a FACSCalibur (BD Biosciences) using T cell-specific, fluorescently-conjugated antibodies (Biolegend) and analyzed using FlowJo software (TreeStar).
EBV-stimulated and peptide-stimulated T cell lines
T cell lines were generated as described previously (Fogg et al., 2009; Blake et al., 2000; Straathof et al., 2005). EBV-stimulated T cell lines were generated by stimulation of PBMC with irradiated autologous LCL at a ratio of 40:1 for 10 days at 37 °C with 5% CO2, followed by three subsequent stimulations at 4:1 every seven days. 20 IU/ml IL-2 (Roche) was added after the second stimulation and maintained in the culture medium. Peptide-stimulated T cell lines were generated by pulsing PBMC with peptide for 1 h, and then PBMC were washed and cultured in media containing 25 ng/ml IL-7 (R&D Systems). After three days, IL-2 was added at a final concentration of 10 IU/ml, and cultures were subsequently fed every three days with fresh medium containing IL-2 and IL-7. Cells were harvested for analysis after 10–14 days in culture.
Pharmacologic mediated depletion of CD25 expressing cells
PBMC were treated overnight with 5 mM of DAB389IL-2 (Ontak) (Williams et al., 1990) at 37 °C with 5% CO2. Cells were recovered on the following day and washed three times prior to the generation of EBV-stimulated T cell lines.
Measurement of EBNA-1 and LMP2-specific T cell responses and epitopes
Peptide-specific T cells were enumerated by incubating CD4+ T cell depleted cell populations with peptide overnight at 37 °C with 5% CO2, and then detecting interferon γ secretion by ELISPOT assays as described (Fogg et al., 2009) and following the manufacturer’s instructions (Mabtech). The number of activated T cells was measured by counting spots of interferon-γ secretion using an automated reader and analysis software (Zellnet, NJ). Background values of cells incubated with no peptide or control peptides were subtracted from all test samples. Results are expressed as spot forming cells (SFC) per million cells, and a response greater than 50 SFC per million cells was considered positive. Individual LMP2 epitopes were identified by positive responses to distinct, non-overlapping peptides. Responses to two overlapping peptides were recorded as a single epitope.
Regression assay
Regression assays were performed as described (Moss et al., 1983). PBMC were incubated with filtered viral supernatant from the B95-8 cell line, washed and seeded at a range of doubling dilutions, in multiple replicates, in a 96 well flat-bottomed plate. Cultures were incubated at 37 °C with 5% CO2 with weekly changes of medium. After four to five weeks, wells were scored positive or negative for growth of EBV transformed B cells and the cell number required to achieve a 50% incidence of regression was then calculated according to the formula of Reed and Muench (1938).
Supplementary Material
Acknowledgments
This work was supported by Grants from the Dana Farber Cancer Institute Friends of Head and Neck Cancer Research and the National Institutes of Health (CA68051, CA132279).
We thank the Head and Neck Clinical Research Team at the DFCI for managing clinical sample collection and all of the NPC patients and healthy donors who so generously contributed blood for these studies.
Footnotes
Appendix A. Supporting information Supplementary information associated with this article can be found in the online version at http://dx.doi.org/10.1016/j.virol.2013.03.016.
References
- Blake N, Haigh T, Shaka’a G, Croom-Carter D, Rickinson A. The importance of exogenous antigen in priming the human CD8+ T cell response: lessons from the EBV nuclear antigen EBNA1. J. Immunol. 2000;165:7078–7087. doi: 10.4049/jimmunol.165.12.7078. [DOI] [PubMed] [Google Scholar]
- Cabrera R, Tu Z, Xu Y, Firpi RJ, Rosen HR, Liu C, Nelson DR. An immunomodulatory role for CD4(+)CD25(+) regulatory T lymphocytes in hepatitis C virus infection. Hepatology. 2004;40:1062–1071. doi: 10.1002/hep.20454. [DOI] [PubMed] [Google Scholar]
- Deacon EM, Pallesen G, Niedobitek G, Crocker J, Brooks L, Rickinson AB, Young LS. Epstein–Barr virus and Hodgkin’s disease: transcriptional analysis of virus latency in the malignant cells. J. Exp. Med. 1993;177:339–349. doi: 10.1084/jem.177.2.339. [DOI] [PMC free article] [PubMed] [Google Scholar]
- Di Stasi A, De Angelis B, Rooney CM, Zhang L, Mahendravada A, Foster AE, Heslop HE, Brenner MK, Dotti G, Savoldo B. T lymphocytes coexpressing CCR4 and a chimeric antigen receptor targeting CD30 have improved homing and antitumor activity in a Hodgkin tumor model. Blood. 2009;113:6392–6402. doi: 10.1182/blood-2009-03-209650. [DOI] [PMC free article] [PubMed] [Google Scholar]
- Fogg MH, Wirth LJ, Posner M, Wang F. Decreased EBNA-1-specific CD8+ T cells in patients with Epstein–Barr virus-associated nasopharyngeal carcinoma. Proc. Nat. Acad. Sci. USA. 2009;106:3318–3323. doi: 10.1073/pnas.0813320106. [DOI] [PMC free article] [PubMed] [Google Scholar]
- Herait P, Ganem G, Lipinski M, Carlu C, Micheau C, Schwaab G, De-The G, Tursz T. Lymphocyte subsets in tumour of patients with undifferentiated nasopharyngeal carcinoma: presence of lymphocytes with the phenotype of activated T cells. Br. J. Cancer. 1987;55:135–139. doi: 10.1038/bjc.1987.28. [DOI] [PMC free article] [PubMed] [Google Scholar]
- Hislop AD, Taylor GS, Sauce D, Rickinson AB. Cellular responses to viral infection in humans: lessons from Epstein–Barr virus. Annu. Rev. Immunol. 2007;25:587–617. doi: 10.1146/annurev.immunol.25.022106.141553. [DOI] [PubMed] [Google Scholar]
- Klibi J, Niki T, Riedel A, Pioche-Durieu C, Souquere S, Rubinstein E, Le Moulec S, Guigay J, Hirashima M, Guemira F, et al. Blood diffusion and Th1-suppressive effects of galectin-9-containing exosomes released by Epstein–Barr virus-infected nasopharyngeal carcinoma cells. Blood. 2009;113:1957–1966. doi: 10.1182/blood-2008-02-142596. [DOI] [PubMed] [Google Scholar]
- Lau KM, Cheng SH, Lo KW, Lee SA, Woo JK, van Hasselt CA, Lee SP, Rickinson AB, Ng MH. Increase in circulating Foxp3+CD4+CD25(high) regulatory T cells in nasopharyngeal carcinoma patients. Br. J. Cancer. 2007;96:617–622. doi: 10.1038/sj.bjc.6603580. [DOI] [PMC free article] [PubMed] [Google Scholar]
- Li J, Chen QY, Mo H, Zhang YL, Huang ZF, Zeng YX. Immunopheno-typing at the time of diagnosis distinguishes two groups of nasopharyngeal carcinoma patients: implications for adoptive immunotherapy. Int. J. Biol. Sci. 2011a;7:607–617. doi: 10.7150/ijbs.7.607. [DOI] [PMC free article] [PubMed] [Google Scholar]
- Li J, Huang ZF, Xiong G, Mo HY, Qiu F, Mai HQ, Chen QY, He J, Chen SP, Zheng LM, et al. Distribution, characterization, and induction of CD8+ regulatory T cells and IL-17-producing CD8+ T cells in nasopharyngeal carcinoma. J. Transl. Med. 2011b;9:189. doi: 10.1186/1479-5876-9-189. [DOI] [PMC free article] [PubMed] [Google Scholar]
- Louis CU, Straathof K, Bollard CM, Gerken C, Huls MH, Gresik MV, Wu MF, Weiss HL, Gee AP, Brenner MK, et al. Enhancing the in vivo expansion of adoptively transferred EBV-specific CTL with lymphodepleting CD45 monoclonal antibodies in NPC patients. Blood. 2009;113:2442–2450. doi: 10.1182/blood-2008-05-157222. [DOI] [PMC free article] [PubMed] [Google Scholar]
- Mahnke K, Schonfeld K, Fondel S, Ring S, Karakhanova S, Wiedemeyer K, Bedke T, Johnson TS, Storn V, Schallenberg S, Enk AH. Depletion of CD4+CD25+ human regulatory T cells in vivo: kinetics of Treg depletion and alterations in immune functions in vivo and in vitro. Int. J. Cancer. 2007;120:2723–2733. doi: 10.1002/ijc.22617. [DOI] [PubMed] [Google Scholar]
- Marshall NA, Vickers MA, Barker RN. Regulatory T cells secreting IL-10 dominate the immune response to EBV latent membrane protein 1. J. Immunol. 2003;170:6183–6189. doi: 10.4049/jimmunol.170.12.6183. [DOI] [PubMed] [Google Scholar]
- Marshall NA, Christie LE, Munro LR, Culligan DJ, Johnston PW, Barker RN, Vickers MA. Immunosuppressive regulatory T cells are abundant in the reactive lymphocytes of Hodgkin lymphoma. Blood. 2004;103:1755–1762. doi: 10.1182/blood-2003-07-2594. [DOI] [PubMed] [Google Scholar]
- Miller G, Lipman M. Release of infectious Epstein–Barr virus by transformed marmoset leukocytes. Proc. Nat. Acad. Sci. USA. 1973;70:190–194. doi: 10.1073/pnas.70.1.190. [DOI] [PMC free article] [PubMed] [Google Scholar]
- Morse MA, Hobeika AC, Osada T, Serra D, Niedzwiecki D, Lyerly HK, Clay TM. Depletion of human regulatory T cells specifically enhances antigen-specific immune responses to cancer vaccines. Blood. 2008;112:610–618. doi: 10.1182/blood-2008-01-135319. [DOI] [PMC free article] [PubMed] [Google Scholar]
- Moss DJ, Chan SH, Burrows SR, Chew TS, Kane RG, Staples JA, Kunaratnam N. Epstein–Barr virus specific T-cell response in nasopharyngeal carcinoma patients. Int. J. Cancer. 1983;32:301–305. doi: 10.1002/ijc.2910320307. [DOI] [PubMed] [Google Scholar]
- Murray PG, Niedobitek G, Kremmer E, Grasser F, Reynolds GM, Cruchley A, Williams DM, Muller-Lantzsch N, Young LS. In situ detection of the Epstein–Barr virus-encoded nuclear antigen 1 in oral hairy leukoplakia and virus-associated carcinomas. J. Pathol. 1996;178:44–47. doi: 10.1002/(SICI)1096-9896(199601)178:1<44::AID-PATH471>3.0.CO;2-0. [DOI] [PubMed] [Google Scholar]
- Niedobitek G, Young LS, Sam CK, Brooks L, Prasad U, Rickinson AB. Expression of Epstein–Barr virus genes and of lymphocyte activation molecules in undifferentiated nasopharyngeal carcinomas. Am. J. Pathol. 1992;140:879–887. [PMC free article] [PubMed] [Google Scholar]
- Reed LJ, Muench H. A simple method of estimating fity percent end-points. Am. J. Hyg. 1938;27:493–497. [Google Scholar]
- Rickinson A, Kieff E. Epstein–Barr Virus. In: Knipe DM, Howley PM, editors. Fields Virology. 5th edition vol. 2. Lippincott Williams and Wilkins; Philadelphia: 2007. pp. 2655–2700. [Google Scholar]
- Smith C, Tsang J, Beagley L, Chua D, Lee V, Li V, Moss DJ, Coman W, Chan KH, Nicholls J, et al. Effective treatment of metastatic forms of Epstein–Barr virus-associated nasopharyngeal carcinoma with a novel adenovirus-based adoptive immunotherapy. Cancer Res. 2012;72:1116–1125. doi: 10.1158/0008-5472.CAN-11-3399. [DOI] [PubMed] [Google Scholar]
- Straathof KC, Bollard CM, Popat U, Huls MH, Lopez T, Morriss MC, Gresik MV, Gee AP, Russell HV, Brenner MK, et al. Treatment of nasopharyngeal carcinoma with Epstein–Barr virus—specific T lymphocytes. Blood. 2005;105:1898–1904. doi: 10.1182/blood-2004-07-2975. [DOI] [PubMed] [Google Scholar]
- Voo KS, Peng G, Guo Z, Fu T, Li Y, Frappier L, Wang RF. Functional characterization of EBV-encoded nuclear antigen 1-specific CD4+ helper and regulatory T cells elicited by in vitro peptide stimulation. Cancer Res. 2005;65:1577–1586. doi: 10.1158/0008-5472.CAN-04-2552. [DOI] [PubMed] [Google Scholar]
- Williams DP, Snider CE, Strom TB, Murphy JR. Structure/function analysis of interleukin-2-toxin (DAB486-IL-2). Fragment B sequences required for the delivery of fragment A to the cytosol of target cells. J. Biol. Chem. 1990;265:11885–11889. [PubMed] [Google Scholar]
- Xu D, Fu J, Jin L, Zhang H, Zhou C, Zou Z, Zhao JM, Zhang B, Shi M, Ding X, et al. Circulating and liver resident CD4+CD25+ regulatory T cells actively influence the antiviral immune response and disease progression in patients with hepatitis B. J. Immunol. 2006;177:739–747. doi: 10.4049/jimmunol.177.1.739. [DOI] [PubMed] [Google Scholar]
Associated Data
This section collects any data citations, data availability statements, or supplementary materials included in this article.