

Abstract
Purpose
The current study prospectively examined processing speed (PS), broad attention (BA), and working memory (WM) ability of patients diagnosed with medulloblastoma over a 5-year period.
Patients and Methods
The study included 126 patients, ages 3 to 21 years at diagnosis, enrolled onto a collaborative protocol for medulloblastoma. Patients were treated with postsurgical risk-adapted craniospinal irradiation (n = 36 high risk [HR]; n = 90 average risk) followed by four cycles of high-dose chemotherapy with stem-cell support. Patients completed 509 neuropsychological evaluations using the Woodcock-Johnson Tests of Cognitive Abilities Third Edition (median of three observations per patient).
Results
Linear mixed effects models revealed that younger age at diagnosis, HR classification, and higher baseline scores were significantly associated with poorer outcomes in PS. Patients treated as HR and those with higher baseline scores are estimated to have less favorable outcomes in WM and BA over time. Parent education and marital status were significantly associated with BA and WM baseline scores but not change over time.
Conclusion
Of the three key domains, PS was estimated to have the lowest scores at 5 years after diagnosis. Identifying cognitive domains most vulnerable to decline should guide researchers who are aiming to develop efficacious cognitive intervention and rehabilitation programs, thereby improving the quality of survivorship for the pediatric medulloblastoma population.
INTRODUCTION
In contrast to their healthy peers, children who have been treated for medulloblastoma exhibit a decreased ability to acquire new information and skills at a comparable rate.1 Declines in academic performance and overall intellect have long been identified as serious disease and treatment-related sequelae.2,3 Recent studies have also revealed that children treated for medulloblastoma experience deficits in more key cognitive skills.4–10
A retrospective examination of 70 patients treated for a brain tumor found deficits in speed of processing, attention, memory, and academic performance at approximately 3 to 4 years after diagnosis.4 A study of cognitive skills among a group of survivors of pediatric leukemia and brain tumor found that treatment with cranial irradiation was associated with slowed information processing and difficulties with working memory (WM).11 Given the retrospective nature, cross-sectional design, and the mixed diagnoses included in these studies, questions remain with regard to the manifestation of the cognitive deficits over time experienced by patients who receive cranial irradiation for medulloblastoma.
From studies of healthy children, it is known that the ability to process information efficiently improves rapidly at an early age and continues to show improvement throughout childhood, eventually reaching adult levels of performance during late adolescence.12 An extensive review among healthy children concluded that WM ability follows a similar course of development.13
Using standardized cognitive testing, the current study aimed to prospectively measure three key cognitive skills of children treated within a risk-based trial for pediatric medulloblastoma, from the point of diagnosis forward. Processing speed (PS), broad attention (BA), and WM were examined relevant to demographic and treatment risk factors. It was hypothesized that patients who were older at the time of diagnosis and treated as average risk (AR) would maintain function over time, whereas younger and high-risk (HR) patients would show declines in function over time. Identifying which patients are at risk for deficits in key cognitive skills and the time course on which they may manifest will provide important information for those seeking to develop and test empirically based intervention programs.
PATIENTS AND METHODS
Patients and Procedures
From 2003 to 2011, 318 patients age 3 to 21 years with histologically proven medulloblastoma tumors were enrolled onto a collaborative treatment protocol (SJMB03; NCT00085202; see Appendix for list of collaborating sites).14 The institutional review board–approved informed consent was obtained on all patients before starting protocol therapy.
All sites followed the same protocol-driven medical treatment. Patients with M0 disease with no brainstem invasion, in whom gross total resection was achieved, were classified as AR; otherwise patients were classified as HR. Treatment between AR and HR patients was identical with the exception of postoperative radiation therapy, initiated within 31 days of definitive surgery. AR patients received 23.4 Gy of craniospinal irradiation and 55.8 Gy of conformal primary site boost (+1 cm margin). HR patients received 36 to 39.6 Gy of craniospinal irradiation and 55.8 Gy of conformal primary site boost. Chemotherapy was initiated 6 weeks after the completion of radiation therapy and included four cycles of dose-intensive cyclophosphamide, cisplatin, and vincristine. Patients were observed every 3 months for 2 years and every 6 months thereafter. Audiograms and endocrine testing were routinely conducted with hearing aids and appropriate replacement therapy offered as necessary. Patients also received vision testing throughout the study.
Of the 318 patients with medulloblastoma enrolled at the time of the current analyses, 75 patients were excluded as a result of posterior fossa syndrome that restricted valid assessment at baseline. Others were excluded for the following reasons: enrolled at a site that did not participate in neurocognitive testing (n = 19), lack of fluency in English (n = 12), medical status restricting assessment (n = 8), parents had refused testing (n = 12), scheduling conflicts (n = 8), died of disease (n = 2), progressive disease and off study (n = 2), and patient was found to have significant pre-existing learning deficits (n = 1). An additional 53 patients were excluded as a result of having only a single evaluation. The final study group consisted of 126 patients from eight collaborative sites (Appendix). As part of a separate study, a subgroup of patients from the primary site (St Jude Children's Research Hospital) were randomly assigned to receive either a computer-based reading intervention (n = 33) or standard of care (n = 28). The aim of the reading intervention was to improve reading decoding ability, which was found to be vulnerable in a previous study.2
The 126 patients included in the final analysis had an average age at diagnosis (AgeDx) of 9.82 years (standard deviation [SD], 4.39 years; Table 1). Parents provided demographic information, including marital status (n = 111; Table 1) and years of education (n = 107). Parents attended school for a median of 14 years (mean, 14.3 years; SD, 2.5 years; range, 8 to 20 years).
Table 1.
Demographic Characteristics of Patients With Medulloblastoma (N = 126) and Their Parents (N = 111) by Risk Status
| Characteristic | Average-Risk Patients |
High-Risk Patients |
All Patients |
|||
|---|---|---|---|---|---|---|
| No. | % | No. | % | No. | % | |
| Sex | ||||||
| Female | 34 | 69.4 | 15 | 30.6 | 49 | 38.9 |
| Male | 56 | 72.7 | 21 | 27.3 | 77 | 61.1 |
| Race | ||||||
| Aboriginal | 1 | 100.0 | — | — | 1 | 0.8 |
| Asian | 4 | 80.0 | 1 | 20.0 | 5 | 4.0 |
| Black | 8 | 72.7 | 3 | 27.3 | 11 | 8.7 |
| Black and white | 1 | 100.0 | — | — | 1 | 0.8 |
| Other | 4 | 100.0 | — | — | 4 | 3.1 |
| Unknown | 3 | 100.0 | — | — | 3 | 2.4 |
| White | 69 | 68.3 | 32 | 31.7 | 101 | 80.2 |
| Age at diagnosis, years | ||||||
| Mean | 9.82 | |||||
| Standard deviation | 4.39 | |||||
| Parent marital status (N = 111) | ||||||
| Divorced | 8 | 66.7 | 4 | 33.3 | 12 | 10.8 |
| Married | 60 | 70.6 | 25 | 29.4 | 85 | 76.6 |
| Separated | 7 | 77.8 | 2 | 22.2 | 9 | 8.1 |
| Single | 5 | 100.0 | — | — | 5 | 4.5 |
| Years of education of parents | ||||||
| Mean | 14.3 | |||||
| Standard deviation | 2.5 | |||||
Neurocognitive Assessment
Patients completed 509 assessments between 0 and 5 years from diagnosis (median, three assessments per patient; range, two to seven assessments). Neurocognitive testing was scheduled after surgical resection (baseline; shortly after the time of enrollment) and at 1, 3, and 5 years after diagnosis. At the primary site (St Jude Children's Research Hospital), every attempt was made to evaluate patients after completion of radiation treatment and annually from time of diagnosis. To be included in the study, patients needed to complete a protocol-driven evaluation of cognitive function using the Woodcock-Johnson Tests of Cognitive Abilities Third Edition15 at baseline and at least one other time point. Patients were also examined via the Woodcock-Johnson Tests of Achievement Third Edition,16 and those results will be reported separately. The country-specific edition of the Woodcock-Johnson battery was used at the Australian collaborative sites.
Three key cognitive skills were of particular interest for the current study: PS, BA, and WM. Age-adjusted standard scores have a population mean of 100 and an SD of 15. Standard scores of 90 to 110 are considered average, 80 to 89 low-average, 70 to 79 low, and ≤ 69 very low.15,16 (See Appendix for subtest information).
Statistical Analysis
Linear mixed effects models (LMEMs) were used to estimate change in each cognitive function separately over time.17,18 LMEMs allow estimation of the overall, group-level, and patient-level parameter estimates including rate of change (slope) over time.19–24 Profile plots with spline smoothing were created as part of exploratory data analysis to identify outliers and to visually inspect patterns of change in each outcome. No deviations from linearity were apparent, and the number of observations per patient was not large enough to reliably model nonlinear change.
As reported previously,2 examining cognitive outcomes within this population via single-variable analyses masks important results that manifest themselves differently in patient subgroups. Hence, our models are multivariable in nature. The following variables and their interaction with time were considered for inclusion in the LMEMs: AgeDx (years), risk group (AR and HR), sex, race (white and other), randomly assigned intervention group status (intervention or standard of care), baseline performance (standard scores), parent marital status (married and other), and parental education (years). Parent marital status and parental education were included as surrogate variables for socioeconomic status. We have previously shown that patients with higher baseline values may be more vulnerable to deterioration in their cognitive functioning.3 Therefore, baseline performance was included as a covariate rather than simply as the earliest value in the longitudinal sequence. To explain the variability in baseline scores, we used general linear models (GLMs) to study associations of the same set of covariates mentioned earlier with the baseline score.
A backward elimination approach was used both for GLMs and LMEMs to remove nonsignificant variables from the full model. On the basis of the F statistic P values, variables were removed from the model one at a time starting with the largest P value, until the final model was achieved for each outcome. Consistent with the hierarchy principle if a variable was included as part of an interaction term, its main effect was also included in the model regardless of significance. All models were fitted using PROC GLM and PROC MIXED in SAS Release 9.2 (SAS Institute, Cary, NC). All tests were two-tailed, and a significance threshold of P = .05 was used. No adjustments were made for the number of tests performed.
RESULTS
Race and intervention group status of the patient were not significantly associated with baseline scores or change in PS, WM, and BA scores over time. Therefore, they were removed from the models. Sex, AgeDx, risk status, parent education, parent marital status, and baseline scores were found to have significant associations that varied by outcome as described in the following sections.
PS
Observed PS scores at baseline were in the low-average range (mean, 88.06; SD, 20.43). In an effort to understand what impacts baseline performance, we used GLM. Only AgeDx was found to be significantly associated with baseline PS scores, where older patients had lower baseline scores compared with younger patients (P = .0176; Table 2).
Table 2.
Observed Baseline Standard Scores and Final GLMs for Baseline Scores by Neurocognitive Outcome
| Outcome and Covariate | Observed Baseline Score |
GLM Baseline Estimates |
||
|---|---|---|---|---|
| Mean | SD | Coefficient Estimate | P | |
| Processing speed | 88.06 | 20.43 | ||
| Intercept | 98.337 | < .001 | ||
| AgeDx | −1.018 | .0176 | ||
| Working memory | 102.40 | 16.95 | ||
| Intercept | 82.244 | < .001 | ||
| AgeDx | −1.306 | .0015 | ||
| Parent education | 2.066 | .0013 | ||
| Parent marital status (married) | 6.077 | .0895 | ||
| Broad attention | 98.35 | 16.87 | ||
| Intercept | 78.797 | < .001 | ||
| AgeDx | −1.330 | .0017 | ||
| Parent education | 1.964 | .0029 | ||
| Parent marital status (married) | 8.707 | .0189 | ||
Abbreviations: AgeDx, age at diagnosis; GLM, generalized linear model; SD, standard deviation.
The examination of change over time using LMEMs revealed that younger AgeDx (P < .001), HR disease (P = .0025), and higher baseline scores (P = .0095) were associated with slower PS over time (Table 3). The intercept term estimated by this model has significant associations with sex and, by design, with baseline PS performance. Results for the subtests contributing to PS can be found in the Appendix.
Table 3.
Final Linear Mixed Effects Models by Neurocognitive Outcome
| Outcome and Covariate | Coefficient Estimate | P |
|---|---|---|
| Intercept | ||
| PS | ||
| Intercept | 17.7137 | < .001 |
| Sex (female) | 2.3943 | .0343 |
| AgeDx | 0.0569 | .6550 |
| Risk (AR) | −1.6766 | .1871 |
| Baseline PS | 0.8056 | < .001 |
| WM | ||
| Intercept | 11.7845 | .0032 |
| Risk (AR) | 0.07723 | .9561 |
| Baseline WM | 0.8889 | < .001 |
| BA | ||
| Intercept | 7.7564 | .0352 |
| Risk (AR) | 1.1723 | .3732 |
| Baseline BA | 0.9130 | < .001 |
| Slope | ||
| PS | ||
| Time | −1.9084 | .4863 |
| AgeDx × time | 0.4700 | < .001 |
| Risk (AR) × time | 3.2377 | .0025 |
| Baseline PS × time | −0.05897 | .0095 |
| WM | ||
| Time | 7.1803 | .002 |
| Risk (AR) × time | 2.4886 | .0036 |
| Baseline WM × time | −0.09911 | < .001 |
| BA | ||
| Time | 6.4692 | .0353 |
| Risk (AR) × time | 3.1663 | .006 |
| Baseline BA × time | −0.1007 | < .001 |
Abbreviations: AgeDx, age at diagnosis; AR, average risk; BA, broad attention; PS, processing speed; WM, working memory.
Our population-level model for PS is given below where the terms with significant P values are in bold print. In this model, IAR is an indicator function for risk (IAR = 1 for AR patients and 0 otherwise), and IS is an indicator function for sex (IS = 1 for female patients and 0 otherwise). Time and AgeDx were treated as continuous variables and were measured in years:
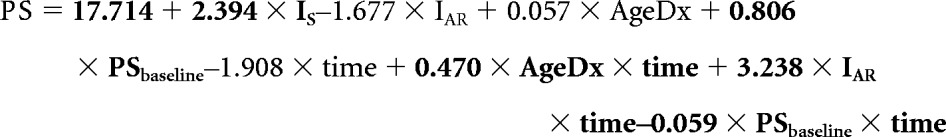 |
Using this equation, we estimated PS scores at 5 years after diagnosis assuming a baseline PS value of 88.06, which was the observed average value in our cohort. Patients who were 6 years of age at diagnosis and HR had estimated mean scores in the very low range, whereas their older counterparts had estimated scores in the low to low-average range (Fig 1). Patients who were AR fared better, with estimated mean PS scores in the low-average range only for patients age 6 years at diagnosis, whereas older patients were in the average range (Fig 1). Our model also suggests that even if the baseline PS value is 100 (healthy population average), the estimated 5-year average PS value in the younger HR group remains in the low to very low range. Although sex was significant as part of the intercept term, the estimated 5-year mean PS values were not notably different between male and female patients.
Fig 1.

Estimated change in processing speed standard score (blue line; 95% CI, black lines) over time (years) for patients diagnosed at (A) 6, (B) 10, and (C) 14 years old with either average-risk (AR) or high-risk (HR) medulloblastoma. Population mean, 100 (red line).
WM
Observed WM scores at baseline were in the average range (mean, 102.40; SD, 16.95). Using GLM, results suggested lower baseline WM scores for patients diagnosed at an older age and higher baseline scores for patients whose parents were better educated and married (Table 2).
Time, risk, and baseline score were the only significant variables in our longitudinal model for WM scores. HR patients and patients with higher baseline scores exhibited less favorable outcomes (Table 3). Results for subtests contributing to WM can be found in the Appendix.
The following equation represents our population-level model for WM where the variables are defined as previously stated. The coefficients in bold are statistically significant:
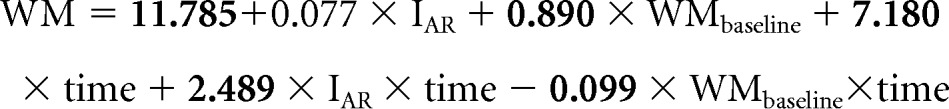 |
On the basis of this equation, mean WM scores for AR and HR patients are estimated to be in the average and low-average range at 5 years after diagnosis, respectively (Fig 2).
Fig 2.

Estimated change in working memory standard score (blue line; 95% CI, black lines) over time (years) for patients diagnosed with either average-risk (AR) or high-risk (HR) medulloblastoma. Population mean, 100 (red line).
BA
Observed BA scores at baseline were in the average range (mean, 98.35; SD, 16.87). Younger patients and patients whose parents were married and better educated had higher baseline BA scores (Table 2).
Our longitudinal model results for BA were similar to the ones for WM where time, risk, and baseline BA scores were the only variables that were associated with change in BA over time. However, HR patients and patients with higher baseline scores had less favorable outcome (Table 3). Results for subtests contributing to BA can be found in the Appendix.
The following is our population-level model for BA where the variables are defined as before and bold indicates significant associations:
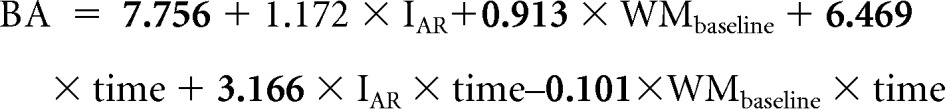 |
On the basis of this equation, the average BA scores for both AR and HR patients were estimated to be in the average and low-average range at 5 years after diagnosis, respectively (Fig 3).
Fig 3.

Estimated change in broad attention standard score (blue line; 95% CI, black lines) over time (years) for patients diagnosed with average-risk (AR) or high-risk (HR) medulloblastoma. Population mean, 100 (red line).
DISCUSSION
The current study is a comprehensive prospective comparison of key cognitive functions among a group of patients treated with risk-adapted therapy. Change in PS, WM, and BA was examined over time. Using the derived equations to estimate scores at 5 years after diagnosis, PS was found to have the lowest scores, especially for those who were younger at diagnosis and had HR disease. These patients had estimated average PS scores in the low to very low range, BA scores in the low-average to low range, and WM scores in the low-average range. These findings are similar to those from Mabbott et al5 who studied cognitive function of pediatric patients who were treated for a brain tumor and evaluated 4 to 6 years after diagnosis. The lowest scores for all patients were found on information PS. BA and WM results were at or above what was expected for a healthy population.
Slowed processing of information may contribute to impaired learning of new information, especially in an academic setting. For school-aged children, necessary modification strategies may include eliminating timed testing and reducing the number of assignments. Although accommodations and modifications are a necessary step in supporting patients after treatment for pediatric medulloblastoma, there is a critical need to provide empirically tested cognitive remediation and intervention programs. Results from the current study suggest that interventions that focus on improving PS hold merit. A pilot study aimed at improving cognitive skills among children with cancer-related brain injury reported that although the participants required longer than expected to complete the intervention, the group showed improved PS scores after intervention.25 Additional studies report evidence of improved cognitive processes among populations experiencing learning difficulties.26,27
Of the variables tested, AgeDx, risk status, and baseline performance were found to be significantly associated with change in PS. Several studies have revealed that young age of the patient at the time of diagnosis is a prominent risk factor for cognitive late effects,1,3,10 but few studies have been able to examine how age and risk may interact. The uniform patient population, treatment regimen, and number of observations included in the present study allowed for such examination. As hypothesized, those who were youngest at diagnosis and those who were treated as HR showed the greatest vulnerability. The declines experienced by this group may be related to the white matter injury documented after diagnosis.28–32
The process of myelination within the white matter continues into the third decade of life.33 In healthy individuals, cortical white matter tracts normally complete myelination by age 3 or 4 years, followed by cerebellar connectivity, and full completion into the late 20s.34 The presence of disease may delay maturation.35,36 Radiation can cause interference in postnatal endothelial and glial cell cycles, depressed postnatal neurogenesis of subependymal glial and hippocampal neuroblast stem cells, and immune-mediated radiotherapy associated inflammatory processes.37–40 Tumor compression of surrounding white matter and additional treatment with chemotherapy are alternate explanatory factors for white matter changes.41,42
Although the current study includes several cognitive assessments per patient among a consistently treated group of patients, with a median of three assessments per patient (range, two to seven assessments), no nonlinear trend was apparent and the data were not sufficient to reliably explore nonlinear models. Those with higher baseline values were shown to have steeper declines over time. This finding is similar to a study of general intellect, where those with higher baseline values were also found to have steeper declines over time.3 Without extended long-term follow-up to reveal potential nonlinear patterns, questions remain with regard to when the declines eventually cease and whether or not the impact of baseline scores is potentially a regression to the mean effect.
Older patients were found to have lower PS, WM, and BA scores at baseline, a finding that was counterintuitive. Tumor location and PFS were examined for potential relation to AgeDx, but results failed to offer any explanation. Future studies that assess more specific pretreatment variables, such as symptom duration (ie, time from symptom onset to diagnosis) or symptom severity, may offer greater insight.43
Similar to a previous study of general intellect,44 the current results showed higher parent education to significantly relate to higher patient baseline WM and BA scores. In addition, children from families with married parents also showed higher baseline BA and WM scores. Education and marital status may be acting as proxy variables for family environment, which has been shown to be related to recovery in pediatric studies of traumatic brain injury.45 However, no such relationship to change in performance over time was found in the current study. Therefore, for a more complete understanding of potential impact, family environment should be explored in more detail in future studies. Long-term memory processes, involving the encoding, retrieval, and consolidation of information in memory, and executive functions were also not measured in this study, yet are related to late effects of radiation as well as posterior fossa brain tumor effects on cognition.46,47 The same specificity of longitudinal change in relation to age, disease risk, and dose burden should be examined in relation to other key cognitive processes that affect learning and adaptation to the environment.
The present study shows that patients treated for medulloblastoma are especially vulnerable to change in PS ability, especially for those who are younger and HR. Concentrating efforts to remediate PS may support the maintenance of collateral processes. The current results should guide researchers to develop efficacious cognitive intervention programs, thereby improving the quality of survivorship for the pediatric medulloblastoma population.
Appendix
Methods
Participating sites.
From 2003 to 2011, 318 patients age 3 to 21 years with histologically proven medulloblastoma tumors were enrolled onto a collaborative treatment protocol (SJMB03; NCT00085202). The primary site was St Jude Children's Research Hospital (Memphis, TN). Collaborative sites included Children's Hospital of Philadelphia (Philadelphia, PA), Duke University Medical Center (Durham, NC), Hospital for Sick Children (Toronto, Ontario, Canada), Royal Children's Hospital Brisbane (Brisbane, Australia), Royal Children's Hospital Melbourne (Melbourne, Australia), Sydney Children's Hospital (Sydney, Australia), and Texas Children's Cancer Center (Houston, TX).
Neurocognitive assessment.
Processing speed (PS) refers to the ability to efficiently absorb and cognitively manage presented information. Patients completed the following two subtests that, when combined, derive the PS composite score: decision speed, developed to test processing of semantic information; and visual matching, developed to test speed of processing visual perceptual information. Working memory (WM) is the temporary storage and manipulation of information necessary for the completion of various cognitive tasks. Patients completed the following two WM-related subtests: numbers reversed, a task of holding a span of presented numbers in short-term memory while reversing the sequence; and auditory working memory, a task of holding a mixed set of numbers and words in short-term memory while reordering into two sequences. Scores from the following four subtests were combined to derive the composite measure of broad attention (BA): numbers reversed and auditory working memory (described earlier); auditory attention, a test designed to measure speech sound discrimination amid increasing background noise; and pair cancellation, a task measuring concentration ability by rapidly identify visually presented repeated patterns.
Results
Decision speed.
Using linear mixed effects models, age at diagnosis (P = .0062), risk status (P = .0250), and baseline performance (P < .001) were found to be significantly associated with change in decision speed over time (Table 2). Younger, high-risk patients and those with higher baseline scores experienced steeper declines in decision speed.
General linear model (GLM) analysis revealed that race was significantly associated with decision speed scores at baseline (P = .0154). Patients who were white had higher PS baseline scores than other races (Appendix Table A1).
Visual matching.
Linear mixed effects models revealed that age at diagnosis was significantly associated with changes of visual matching scores over time (P < .001). Risk (P = .0019) and baseline performance (P = .008) were also significantly associated with the changes in visual matching scores over time (Appendix Table A2). Younger, high-risk patients and those with higher baseline WM scores experienced steeper declines in visual matching. GLM analysis showed that risk status and age of the patient at diagnosis were significantly associated with baseline visual matching scores (Appendix Table A1).
Numbers reversed.
Age at diagnosis and parent education were significantly associated with scores at baseline (P = .0037 and P = .0039, respectively; Appendix Table A1). Baseline performance and risk status were associated with changes in numbers reversed scores over time (P < .001 and P = .0491, respectively), with those classified as high risk and who had higher scores at baseline experiencing steeper declines over time (Appendix Table A2).
Auditory working memory.
GLM revealed that age at diagnosis (P = .0023) and parent education (P = .006) were significantly associated with the auditory working memory scores at baseline (Appendix Table A1). Linear mixed effects models revealed that risk status (P < .001) and baseline performance (P < .001) were significantly associated with changes in auditory working memory scores over time (Appendix Table A2). High-risk patients and those with higher baseline scores experienced steeper declines in auditory working memory.
Auditory attention.
Parent marital status (P = .0263) was significantly associated with auditory attention at baseline (Appendix Table A1). Risk (P = .0152), baseline performance (P < .001), and parent education (P = .0182) were significantly associated with change in auditory attention over time (Appendix Table A2).
Pair cancellation.
Age at diagnosis was significantly associated with pair cancellation at baseline (P < .001; Appendix Table A1). Risk (P = .0321) and baseline performance (P = .0036) were significantly associated with the changes in pair cancellation scores over time (Appendix Table A2). High-risk patients and those with higher baseline scores experienced steeper declines in pair cancellation.
Table A1.
Observed Baseline Standard Scores and Final GLMs for Baseline Scores by Neurocognitive Outcome
| Outcome and Covariate | Baseline Score |
GLM Estimates |
||
|---|---|---|---|---|
| Mean | SD | Coefficient Estimate | P | |
| Decision speed | 91.17 | 17.87 | ||
| Intercept | 101.351 | < .001 | ||
| Race (nonwhite) | −9.919 | .0154 | ||
| AgeDx | −0.815 | .0279 | ||
| Visual matching | 87.98 | 20.49 | ||
| Intercept | 101.137 | < .001 | ||
| Risk (AR) | −6.838 | .0878 | ||
| AgeDx | −1.482 | .0011 | ||
| Parent marital status (married) | 7.217 | .0978 | ||
| Numbers reversed | 100.49 | 15.54 | ||
| Intercept | 88.452 | < .001 | ||
| AgeDx | −1.097 | .0037 | ||
| Parent education | 1.677 | .0039 | ||
| Auditory working memory | 104.68 | 15.94 | ||
| Intercept | 87.874 | < .001 | ||
| AgeDx | −1.180 | .0023 | ||
| Parent education | 1.717 | .0060 | ||
| Parent marital status (married) | 6.500 | .0629 | ||
| Auditory attention | 101.72 | 13.22 | ||
| Intercept | 94.423 | < .001 | ||
| Parent marital status (married) | 7.933 | .0263 | ||
| Pair cancellation | 90.95 | 13.59 | ||
| Intercept | 103.345 | < .001 | ||
| AgeDx | −1.148 | < .001 | ||
Abbreviations: AgeDx, age at diagnosis; AR, average risk; GLM, generalized linear model; SD, standard deviation.
Table A2.
Final Linear Mixed Effects Models by Neurocognitive Outcome
| Outcome and Covariate | Coefficient Estimate | P |
|---|---|---|
| Intercept | ||
| DS | ||
| Intercept | 18.2232 | < .001 |
| Sex (female) | 3.2390 | .009 |
| Risk (AR) | −0.9460 | .4953 |
| AgeDx | 0.01305 | .9253 |
| Baseline DS | 0.8044 | < .001 |
| VM | ||
| Intercept | 17.3422 | < .001 |
| AgeDx | 0.1729 | .1880 |
| Risk (AR) | −1.9544 | .1254 |
| Baseline VM | 0.8078 | < .001 |
| NR | ||
| Intercept | 16.9023 | .0003 |
| Risk (AR) | 1.9593 | .1917 |
| Baseline NR | 0.8275 | < .001 |
| AWM | ||
| Intercept | 19.1009 | < .001 |
| Risk (AR) | −2.8034 | .0684 |
| Baseline AWM | 0.8359 | < .001 |
| AA | ||
| Intercept | 35.8948 | < .001 |
| Risk (AR) | −0.4888 | .7707 |
| Baseline AA | 0.6472 | < .001 |
| Parent education | 0.07832 | .7877 |
| PC | ||
| Intercept | 6.9547 | .0627 |
| Risk (AR) | 1.3093 | .2586 |
| Baseline PC | 0.9071 | < .001 |
| Slope | ||
| DS | ||
| Time | 4.2792 | .1899 |
| Risk (AR) × time | 2.6263 | .0250 |
| AgeDx × time | 0.3226 | .0062 |
| Baseline DS × time | −0.09653 | < .001 |
| VM | ||
| Time | 2.3106 | .2701 |
| AgeDx × time | 0.08636 | < .001 |
| Risk (AR) × time | 0.8310 | .0019 |
| Baseline VM × time | 0.01905 | .0080 |
| NR | ||
| Time | 11.2763 | < .001 |
| Risk (AR) × time | 1.8564 | .0491 |
| Baseline NR × time | −0.1341 | < .001 |
| AWM | ||
| Time | 8.1587 | < .001 |
| Risk (AR) × time | 3.1648 | < .001 |
| Baseline AWM × time | −0.1099 | < .001 |
| AA | ||
| Time | 5.1546 | .2667 |
| Risk (AR) × time | 3.3908 | .0152 |
| Baseline AA × time | −0.1746 | < .001 |
| Parent education × time | 0.5637 | .0182 |
| PC | ||
| Time | 10.3868 | .0226 |
| Risk (AR) × time | 3.0545 | .0321 |
| Baseline PC × time | −0.1383 | .0036 |
Abbreviations: AA, auditory attention; AgeDx, age at diagnosis; AR, average risk; AWM, auditory working memory; DS, decision speed; NR, numbers reversed; PC, pair cancellation; VM, visual matching.
See accompanying editorial on page 3480
Supported, in part, by the National Cancer Institute through a Cancer Center Support grant (Grant No. P30-CA21765), the Noyes Brain Tumor Foundation, Musicians Against Childhood Cancer, and the American Lebanese Syrian Associated Charities.
Authors' disclosures of potential conflicts of interest and author contributions are found at the end of this article.
AUTHORS' DISCLOSURES OF POTENTIAL CONFLICTS OF INTEREST
The author(s) indicated no potential conflicts of interest.
AUTHOR CONTRIBUTIONS
Conception and design: Shawna L. Palmer, Arzu Onar-Thomas, Dana Wallace, Amar Gajjar
Financial support: Amar Gajjar
Provision of study materials or patients: Shawna L. Palmer, Amar Gajjar
Collection and assembly of data: Shawna L. Palmer, Carol Armstrong, Melanie J. Bonner, Jane Schreiber, Michelle Swain, Lynn Chapieski, Donald Mabbott, Sarah Knight, Robyn Boyle, Amar Gajjar
Data analysis and interpretation: Shawna L. Palmer, Carol Armstrong, Arzu Onar-Thomas, Shengjie Wu, Dana Wallace
Manuscript writing: All authors
Final approval of manuscript: All authors
REFERENCES
- 1.Palmer SL, Goloubeva O, Reddick WE, et al. Patterns of intellectual development among survivors of pediatric medulloblastoma: A longitudinal analysis. J Clin Oncol. 2001;19:2302–2308. doi: 10.1200/JCO.2001.19.8.2302. [DOI] [PubMed] [Google Scholar]
- 2.Mulhern RK, Palmer SL, Merchant TE, et al. Neurocognitive consequences of risk-adapted therapy for childhood medulloblastoma. J Clin Oncol. 2005;23:5511–5519. doi: 10.1200/JCO.2005.00.703. [DOI] [PubMed] [Google Scholar]
- 3.Palmer SL, Gajjar A, Reddick WE, et al. Predicting intellectual outcome among children treated with 35-40 Gy craniospinal irradiation for medulloblastoma. Neuropsychology. 2003;17:548–555. doi: 10.1037/0894-4105.17.4.548. [DOI] [PubMed] [Google Scholar]
- 4.Patel SK, Mullins WA, O'Neil SH, et al. Neuropsychological differences between survivors of supratentorial and infratentorial brain tumours. J Intellect Disabil Res. 2010;55:30–40. doi: 10.1111/j.1365-2788.2010.01344.x. [DOI] [PubMed] [Google Scholar]
- 5.Mabbott DJ, Penkman L, Witol A, et al. Core neurocognitive functions in children treated for posterior fossa tumors. Neuropsychology. 2008;22:159–168. doi: 10.1037/0894-4105.22.2.159. [DOI] [PubMed] [Google Scholar]
- 6.Jain N, Krull KR, Brouwers P, et al. Neuropsychological outcome following intensity-modulated radiation therapy for pediatric medulloblastoma. Pediatr Blood Cancer. 2008;51:275–279. doi: 10.1002/pbc.21580. [DOI] [PubMed] [Google Scholar]
- 7.Brière M, Scott JG, McNall-Knapp RY, et al. Cognitive outcome in pediatric brain tumor survivors: Delayed attention deficit at long term follow-up. Pediatric Blood Cancer. 2008;50:337–340. doi: 10.1002/pbc.21223. [DOI] [PubMed] [Google Scholar]
- 8.Reeves CB, Palmer SL, Reddick WE, et al. Attention and memory functioning among pediatric patients with medulloblastoma. J Pediatr Psychol. 2006;31:272–280. doi: 10.1093/jpepsy/jsj019. [DOI] [PubMed] [Google Scholar]
- 9.Nagel BJ, Delis DC, Palmer SL, et al. Early patterns of verbal memory impairment in children treated for medulloblastoma. Neuropsychology. 2006;20:105–112. doi: 10.1037/0894-4105.20.1.105. [DOI] [PubMed] [Google Scholar]
- 10.Mulhern RK, Merchant TE, Gajjar A, et al. Late neurocognitive sequelae in survivors of brain tumours in childhood. Lancet Oncol. 2004;5:399–408. doi: 10.1016/S1470-2045(04)01507-4. [DOI] [PubMed] [Google Scholar]
- 11.Schatz J, Kramer JH, Ablin A, et al. Processing speed, working memory, and IQ: A developmental model of cognitive deficits following cranial radiation therapy. Neuropsychology. 2000;14:189–200. doi: 10.1037//0894-4105.14.2.189. [DOI] [PubMed] [Google Scholar]
- 12.Fry AF, Hale S. Processing speed, working memory and fluid intelligence: Evidence for a developmental cascade. Psychol Sci. 1996;7:237–241. [Google Scholar]
- 13.Fry AF, Hale S. Relationships among processing speed, working memory, and fluid intelligence in children. Biol Psychol. 2000;54:1–34. doi: 10.1016/s0301-0511(00)00051-x. [DOI] [PubMed] [Google Scholar]
- 14.ClinicalTrials.gov. Treatment of patients with newly diagnosed medulloblastoma, supratentorial primitive neuroectodermal tumor, or atypical teratoid rhabdoid tumor. http://clinicaltrials.gov/ct2/show/record/NCT00085202.
- 15.Woodcock R, McGraw K, Mather N. Woodcock-Johnson Third Edition, Tests of Cognitive Abilities. Itasca, IL: Riverside Publishing; 2001. [Google Scholar]
- 16.Woodcock R, McGraw K, Mather N. Woodcock-Johnson Third Edition, Tests of Achievement. Itasca, IL: Riverside Publishing; 2001. [Google Scholar]
- 17.Laird NM, Ware JH. Random-effects models for longitudinal data. Biometrics. 1982;38:963–974. [PubMed] [Google Scholar]
- 18.Diggle PJ, Liang K, Zeger SL. Analysis of Longitudinal Data. New York: Oxford University Press; 1994. [Google Scholar]
- 19.Chambers J, Hastie T. Statistical Models in Southern California. Pacific Grove, CA: Wadsworth and Brooks; 1993. [Google Scholar]
- 20.Jones RH. Longitudinal Data With Serial Correlation: A State-Space Approach. London, United Kingdom: Chapman and Hall; 1993. [Google Scholar]
- 21.Little RC, Milliken GA, Stroup WW. SAS System for Mixed Models. Cary, NC: SAS Institute; 1996. [Google Scholar]
- 22.Rutter CM, Elashoff RM. Analysis of longitudinal data: Random coefficient regression modelling. Stat Med. 1994;13:1211–1231. doi: 10.1002/sim.4780131204. [DOI] [PubMed] [Google Scholar]
- 23.Searle SR. Linear Models for Unbalanced Data. New York, NY: John Wiley and Sons; 1987. [Google Scholar]
- 24.Venables WN, Ripley BD. Modern Applied Statistics. New York, NY: Springer; 1997. [Google Scholar]
- 25.Kesler SR, Lacayo NJ, Jo B. A pilot study of an online cognitive rehabilitation program for executive function skills in children with cancer-related brain injury. Brain Inj. 2011;25:101–112. doi: 10.3109/02699052.2010.536194. [DOI] [PMC free article] [PubMed] [Google Scholar]
- 26.Beck SJ, Hanson CA, Puffenberger SS, et al. A controlled trial of working memory training for children and adolescents with ADHD. J Clin Child Adolesc Psychol. 2010;39:825–836. doi: 10.1080/15374416.2010.517162. [DOI] [PubMed] [Google Scholar]
- 27.Gray SA, Chaban P, Martinussen R, et al. Effects of a computerized working memory training program on working memory, attention, and academics in adolescents with severe LD and comorbid ADHD: A randomized controlled trial. J Child Psychol Psychiatry. 2012;53:1277–1284. doi: 10.1111/j.1469-7610.2012.02592.x. [DOI] [PubMed] [Google Scholar]
- 28.Palmer SL, Glass JO, Li Y, et al. White matter integrity is associated with cognitive processing in patients treated for a posterior fossa brain tumor. Neuro Oncol. 2012;14:1185–1193. doi: 10.1093/neuonc/nos154. [DOI] [PMC free article] [PubMed] [Google Scholar]
- 29.Khong PL, Leung LH, Fung AS, et al. White matter anisotropy in post-treatment childhood cancer survivors: Preliminary evidence of association with neurocognitive function. J Clin Oncol. 2006;24:884–890. doi: 10.1200/JCO.2005.02.4505. [DOI] [PubMed] [Google Scholar]
- 30.Mabbott DJ, Noseworthy MD, Bouffet E, et al. Diffusion tensor imaging of white matter after cranial radiation in children for medulloblastoma: Correlation with IQ. Neuro Oncol. 2006;8:244–252. doi: 10.1215/15228517-2006-002. [DOI] [PMC free article] [PubMed] [Google Scholar]
- 31.Reddick WE, Glass JO, Palmer SL, et al. Atypical white matter volume development in children following craniospinal irradiation. Neuro Oncol. 2005;7:12–19. doi: 10.1215/S1152851704000079. [DOI] [PMC free article] [PubMed] [Google Scholar]
- 32.Reddick WE, White HA, Glass JO, et al. Developmental model relating white matter volume to neurocognitive deficits in pediatric brain tumor survivors. Cancer. 2003;97:2512–2519. doi: 10.1002/cncr.11355. [DOI] [PubMed] [Google Scholar]
- 33.Pfefferbaum A, Mathalon DH, Sullivan EV, et al. A quantitative magnetic resonance imaging study of changes in brain morphology from infancy to late adulthood. Arch Neurol. 1994;51:874–887. doi: 10.1001/archneur.1994.00540210046012. [DOI] [PubMed] [Google Scholar]
- 34.Barkovich AJ. Concepts of myelin and myelination in neuroradiology. AJNR Am J Neuroradiol. 2000;21:1099–1109. [PMC free article] [PubMed] [Google Scholar]
- 35.Shaw P, Eckstrand K, Sharp W, et al. Attention-deficit/hyperactivity disorder is characterized by a delay in cortical maturation. Proc Natl Acad Sci U S A. 2007;104:19649–19654. doi: 10.1073/pnas.0707741104. [DOI] [PMC free article] [PubMed] [Google Scholar]
- 36.Shaw P, Malek M, Watson B, et al. Development of cortical surface area and gyrification in attention-deficit/hyperactivity disorder. Biol Psychiatry. 2012;72:191–197. doi: 10.1016/j.biopsych.2012.01.031. [DOI] [PMC free article] [PubMed] [Google Scholar]
- 37.Chiang CS, Hong JH, Stalder A, et al. Delayed molecular responses to brain irradiation. Int J Radiat Biol. 1997;72:45–53. doi: 10.1080/095530097143527. [DOI] [PubMed] [Google Scholar]
- 38.Mizumatsu S, Monje ML, Morhardt DR, et al. Extreme sensitivity of adult neurogenesis to low doses of X-irradiation. Cancer Res. 2003;63:4021–4027. [PubMed] [Google Scholar]
- 39.Monje ML, Toda H, Palmer TD. Inflammatory blockade restores adult hippocampal neurogenesis. Science. 2003;302:1760–1765. doi: 10.1126/science.1088417. [DOI] [PubMed] [Google Scholar]
- 40.van der Knapp MS, Valk J. Leukoencephalopathy and Radiotherapy and Chemotherapy: Magnetic Resonance of Myelination and Myelin Disorders. Berlin, Germany: Springer; 2005. [Google Scholar]
- 41.Khong PL, Kwong DL, Chan GC, et al. Diffusion-tensor imaging for the detection and quantification of treatment-induced white matter injury in children with medulloblastoma: A pilot study. Am J Neuroradiol. 2003;24:734–740. [PMC free article] [PubMed] [Google Scholar]
- 42.Steen RG, Koury BSM, Granja CI, et al. Effect of ionizing radiation on the human brain: White matter and gray matter T1 in pediatric brain tumor patients treated with conformal radiation therapy. Int J Radiat Oncol Biol Phys. 2001;49:79–91. doi: 10.1016/s0360-3016(00)01351-1. [DOI] [PubMed] [Google Scholar]
- 43.Iuvone L, Peruzzi L, Colosimo C, et al. Pretreatment neuropsychological deficits in children with brain tumors. Neuro Oncol. 2011;13:517–524. doi: 10.1093/neuonc/nor013. [DOI] [PMC free article] [PubMed] [Google Scholar]
- 44.Mulhern RK, Reddick WE, Palmer SL, et al. Neurocognitive deficits in medulloblastoma survivors and white matter loss. Ann Neurol. 1999;46:834–841. doi: 10.1002/1531-8249(199912)46:6<834::aid-ana5>3.0.co;2-m. [DOI] [PubMed] [Google Scholar]
- 45.Taylor HG, Yeates KO, Wade SL, et al. A prospective study of short- and long-term outcomes after traumatic brain injury in children: Behavior and achievement. Neuropsychology. 2002;16:15–27. doi: 10.1037//0894-4105.16.1.15. [DOI] [PubMed] [Google Scholar]
- 46.Armstrong CL, Iampietro M, Smith D, et al. Is there hemispheric specialization for cognitive function in the pediatric cerebellum?. Presented at the Association for Psychological Science Annual Meeting; May 26-29, 2011; Washington, DC. [Google Scholar]
- 47.Iampietro M, Armstrong CL. Differential neuropsychological deficits in children with cerebellar brain tumors. J Int Neuropsychol Soc. 2011;17(suppl):191. [Google Scholar]