Abstract
The growth plate is a highly organized section of cartilage in the long bones of growing children that is susceptible to mechanical failure as well as structural and functional disruption caused by a dietary deficiency of vitamin D. The shear mechanical properties of the proximal tibial growth plate of rats raised either on normal or vitamin D and calcium deficient diets were measured. A sinusoidal oscillating shear load was applied to small excised growth plate specimens perpendicular to the direction of growth while imaging the deformation in real time with a fast confocal microscope. Local deformations and shear strains were quantified using image correlation. The proliferative zone of the growth plate bores the majority of the shear strain and the resting, hypertrophic and calcification zones deformed less. Surprisingly, we regularly observed discontinuous deformations in the proliferative zone in both groups that resembled cell columns sliding past one another in the direction of growth. These discontinuities manifested as regions of concentrated longitudinal shear strain. Furthermore, these shear strain concentrations were spaced evenly in the proliferative zone and the spacing between them was similar across growth plate regions and across control specimens. In contrast to the healthy controls, the vitamin D deficient growth plate exhibited larger variations in the size and orientation of cellular columns in the proliferative and hypertrophic zones. High strains were observed between columns, much as they were in the controls. However, the regular spacing of shear strain concentrations was not preserved, echoing the observation of decreased structural organization.
Keywords: Growth plate, Cartilage, Shear modulus, Vitamin D
1. Introduction
The growth plate is the collection of tissues located near the ends of long bones which together provide the mechanisms for longitudinal bone growth. Central to its function is a layer of growth plate cartilage, the primary source of new bone scaffold material. Growth plate cartilage is comprised of four distinct zones that lie along the longitudinal axis of the bone: resting, proliferative, hypertrophic, and calcified (Martin et al., 1998). This axis is both spatial and temporal, representing the life cycle of chondrocytes in the growth plate. Cells in the resting zone (closest to the epiphysis) are the smallest by diameter. As these cells age, they enter the proliferative zone, the site of growth plate cell division. Adjacent to time and space is the hypertrophic zone, where cells increase in volume by accumulating glycogen. Finally, cells enter the calcification zone where they die as the extracellular matrix is calcified. During all stages of growth, growth plate cells sit along distinct columnar structures known as chondrons (Bonucci and Motta, 1990). The growth plate also contains longitudinal struts known as tethers (Martin et al., 2003) that connect the epiphysis to the metaphysis. Collectively this cellular and matrix structure imparts the growth plate with a highly organized arrangement that is critical to its function.
Disruption of the organization of the growth plate significantly impedes skeletal growth. Such disruptions can arise from a variety of conditions, including genetic mutations (Oh et al., 2012; Marks et al., 2000; Bonaventure et al., 1998), dietary insufficiencies (Ehrlich et al., 1973; Tardivel et al., 1992), and mechanical trauma (Lee et al., 1985; Revel et al., 1985; Wattenbarger et al., 2002). Of specific interest here are insufficiencies of dietary components necessary for skeletal growth, particularly vitamin D. Insufficient dietary intake of vitamin D is a major cause of rickets, one of the most frequent childhood diseases in the developing world (Allgrove, 2004). Rickets is characterized by bone shortening, bone deformities, and increased susceptibility to fractures (Özkan, 2010). The rachitic growth plate is characterized by decreased synthesis of extracellular matrix (Genever and Dickson, 1996; Takechi and Itakura, 1995), abnormal vascularization (Gay et al., 2007), increased chondrocyte hypertrophy (Sabbagh et al., 2005), and disruption of the cell columns (Sabbagh et al., 2005) as well as the tether network that connects the epiphysis to metaphysis (Lee et al., 1985).
Mechanical trauma impedes skeletal growth through premature closure of the growth plate caused by chondrocyte apoptosis (Gaber et al., 2009; Macsai et al., 2011). Such injuries can result from a single overload event or from repetitive loading and overuse (DiFiori, 2010). Failure of the growth plate under load occurs frequently in shear (van Leeuwen et al., 2004), with local damage occurring most commonly in the hypertrophic zone (Lee et al., 1985). Despite the frequency and potentially devastating consequences of such injuries, relatively little is known about the mechanical properties of the growth plate, particularly in comparison to other cartilaginous tissues.
The bulk compressive mechanical properties of growth plate along and perpendicular to the direction of growth have been studied in vitro (Villemure and Stokes, 2009). While the compressive modulus (E) in the direction of growth is approximately 0.5 MPa (Cohen et al., 1994), E is 10 times greater in the transverse direction (Villemure and Stokes, 2009). Spatial variations in compressive strain along the growth plate have been measured using partial thickness sectioning (Sergerie et al., 2009) and by imaging fluorescently stained growth plate nuclei as the tissue is loaded uniaxially (Villemure et al., 2007). In the latter study, texture correlation was used to quantify patterns in axial strain throughout the growth plate. The growth plate was found to be stiffest under compression in the proliferation zone. In contrast, using atomic force microscopy the indentation modulus of the extracellular matrix increased monotonically from the reserve zone to the calcification zone (Radhakrishnan et al., 2004). Villemure et al. (2007) suggest that these apparent contradictions may be the result of the changing ratio of extracellular matrix volume to cell volume from 1.6 in the proliferative zone to 0.4 in the hypertrophic zone (Farnum and Wilsman, 1998).
These studies collectively suggest that growth plate tensile and compressive properties are spatially heterogeneous in a way that depends on growth plate structure. However, very little is known about the shear properties of the growth plate, which are critical to understand how the tissue fails. Previous studies have established confocal elastography techniques capable of mapping shear strains in articular cartilage with a spatial resolution of approximately 20 μm (Buckley et al., 2008, 2010). The goals of the current study were to apply these confocal elastography techniques to characterize the spatial pattern of shear strains in the normal rat growth plate and to characterize changes in this pattern due to structural disruption of the growth plate induced by dietary vitamin D insufficiency.
2. Materials and methods
2.1. Dietary Vitamin D insufficiency model
Vitamin D deficiency in male Sprague-Dawley rats (Charles River, Wilmington, MA) was achieved using a modified dietary intervention based on the methods of Sonnenberg et al. (1984) and Kim et al. (2012). At 3 weeks of age, animals were weaned and started on their respective diets. Controls were fed normal rat chow replete in vitamin D3 (2000 IU/kg) and Ca (0.47%) for the 10 week experimental duration (Harlan Teklad, TD. 08364, Indianapolis, IN). The vitamin D-deficient group was fed rat chow with 0 IU/kg Ca and 0 IU/kg D3 during weeks 7, 8 and 9, and with 0.47% Ca and 0 IU/kg vitamin D3 for the remainder of the 10 week experimental duration. The purpose of partial dietary calcium deficiency is to exacerbate the conditions of Rickets, which may be brought on by either only vitamin D deficiency or a combination of vitamin D and calcium deficiencies (Sonnenberg et al., 1984). All animals were housed in 12 h/12 h light–dark cycles, free from UV radiation for the experimental duration. At the end of the 10 week experimental duration animals were euthanized by CO2 asphyxiation. All procedures were approved by Cornell University’s Institutional Animal Care and Use Committee (IACUC).
2.2. Sample preparation
Proximal tibias from 13 control and 9 vitamin D deficient 13 week-old male Sprague-Dawley rats were removed immediately after sacrifice and frozen at −18 °C. To obtain a thin section of bone and growth plate, a single edge blade was used to make 2 sagittal cuts slightly to the medial side of the center of each bone (Fig. 1). This region of the growth plate was free from visible jagged edges according to 25 μm–resolution μmCT scans performed on 4 additional tibias (data not shown). Bone was retained on both sides of the test specimen.
Fig. 1.
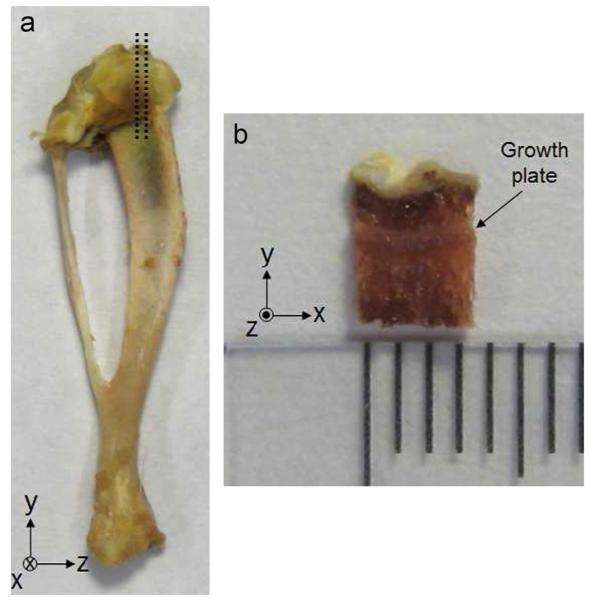
(a) Posterior view of rat tibia prior to cutting along dashed line segments. (b) Mechanical test specimen. Tissue sections were trimmed to obtain a parallelepiped shaped plug of length approximately 3.5 mm anterior/posterior (x), 4 mm superior/inferior (y) and 1.5 mm medial/lateral (z). Ruler markings indicate 1 mm.
Prior to mechanical testing, each specimen was bathed for 2 h in phosphate-buffered saline (PBS) with 7 μg mL−1 5-dichlorotriazinylaminofluorescein (a general fluorescent dye for both cellular and ECM proteins) and then washed for 30 min in fresh PBS to remove unbound fluorophores (Buckley et al., 2010).
2.3. Mechanical testing
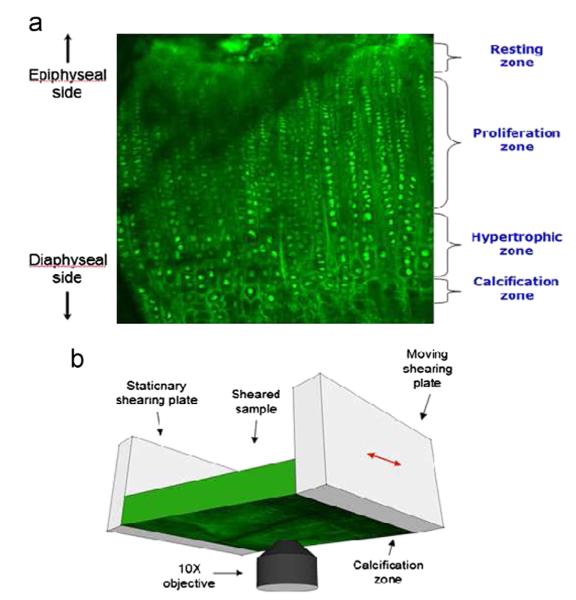
Each specimen was tested in shear on a tissue deformation imaging stage mounted onto a line-scanning confocal microscope capable of imaging at >60 fps (Fig. 2). Bony ends of the specimens were adhered to the shearing plates using a cyanoacrylate gel. Specimens were imaged before testing to ensure that glue did not penetrate the growth plate at any location. When required, photobleaching of the specimen was performed as described previously (Buckley et al., 2010; Bruehlmann et al., 2004). Samples were imaged using 20× magnification under shear in the anterior/posterior direction (Fig. 3a, b) at a frequency of 100 mHz and a maximum displacement amplitude of 32 μm, corresponding to a shear strain of ≈5–15% depending on the thickness of the growth plate specimen.
Fig. 2.
(a) Confocal micrograph of tibial growth plate demonstrating the four major zones and (b) schematic of the shear testing apparatus. Zones are distinguished by chondrocyte size (smallest in the resting & proliferating zones, larger in the hypertrophic zones) and alignment (organized into columns in the proliferating and hypertrophic zones). Image size is 637 μm × 637 μm. All tissue images are shown epiphyseal side up.
Fig. 3.
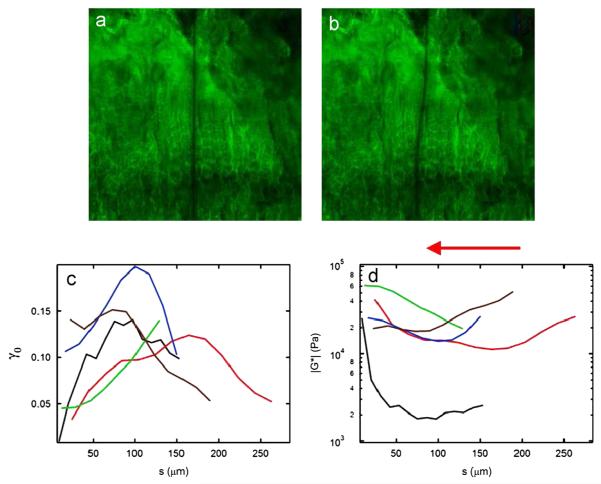
Shear strain and shear modulus of the growth plate as a function of distance from the metaphyseal chondro-osseous junction. 637 μm × 637 μm confocal micrographs of a control rat tibial growth plate (a) before and (b) after application of 10% shear strain, the arrow indicating the direction of applied shear. (c) Shear strain and (d) shear modulus profiles for tested samples (n = 5) as a function of distance s from the chondro-osseous junction. Specimens are represented by the same color trace in both (c) and (d).
2.4. Data analysis
To measure specimen deformation as a function of time and distance s from the metaphyseal chondro-osseous junction, a photobleached line oriented along the direction of growth was tracked using methods described previously (Buckley et al., 2008). The transverse displacement of the line u(s,t) was fit with a sinusoid at discrete positions s to determine the displacement amplitudes u0(s) and the displacement phase angles δu(s). The phase δu(s) is defined relative to the phase at of the applied load, s=0.
Assuming the shear stress τ is uniform along s, the shear strain amplitude γ0(s) is given by
| (1) |
Additionally, the phase angle of the strain relative to the displacement of the shearing plate δγ(s) is given by
| (2) |
In the limit where δu(s)⪡1 (i.e., pseudo-static loading), Eq. (1) may be simplified to γ0(s) = du0(s)=ds and Eq. (2) to δγ(s) = δu(s). Five point linear least squares fitting was used to differentiate u0(s) and obtain δγ(s). From this, the modulus
| (3) |
was obtained.
The above method provides the storage modulus through the different zones with high 1D longitudinal resolution, but does not capture transverse heterogeneities within zones. For this purpose, two dimensional maps of shear strain were obtained by digital image correlation (DIC). A publicly available DIC implementation for use with MATLAB (Eberl, 2010) was optimized and used to obtain the deformation field (where x indicates the transverse and y indicates the longitudinal directions). 2D maps of shear strain γxy(x,y) = duy/dx and γyx(x,y) = dux/dy were then calculated from the deformation field, using a centered finite difference approximation for the derivative. DIC measures deformations by measuring the displacement of a grid of small sub-images (called control points) from one image to the next (usually through a series of images). A grid spacing of 9 μm corresponded to the highest spatial resolution for which this technique could determine strains reliably, given the resolution of the acquired images.
We used the 2D discrete fast Fourier transform (FFT) to measure and compare the extent of spatial periodicity in the resulting shear strain maps. The 2D FFT describes an image in terms of Fourier components of different spatial frequencies, and has point symmetry about its center such that every Fourier component (i.e. each spatial frequency) is represented by a symmetric pair of points. Therefore, the presence of a symmetric pair of salient peaks in the 2D FFT indicates a primary sinusoidal spatial frequency in strain magnitude, the direction and spatial period of which are indicated by the location of the peaks.
3. Results
The shear strain profiles γ0(s) of growth plate were sensitive to distance s from the chondro-osseous junction in controls (Fig. 3c, d). In general, the largest shear strains were observed in the proliferation zone while small strains were observed in the hypertrophic/calcification and resting zones. Storage modulus ∣G*∣(s) reached a maximum value of 20–60 kPa near the chondro-osseous junction (Fig. 3b). In all but one sample, the global minimum of ∣G*∣(s) was in the range 10–20 kPa and located in the proliferation zone.
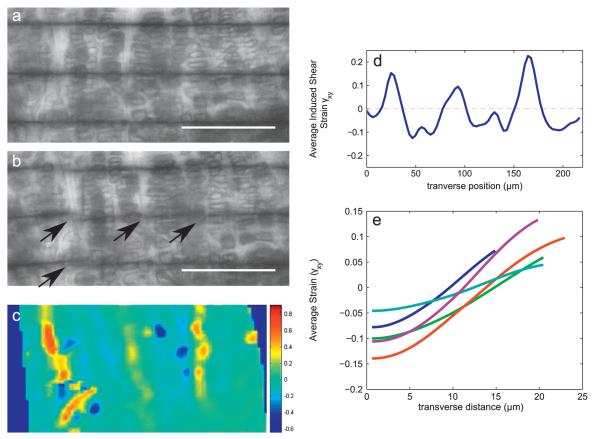
The applied shear strain γyx was transverse to the direction of growth and chondron orientation. This loading induced discontinuities in transverse photobleached lines (Fig. 4a, b) and also in the longitudinal shear strain field γxy (Fig. 4c). By aligning features of the strain map with those of the specimen, we observed that these discontinuities in γxy tended to occur in the extracellular matrix between groups of cell columns. For an applied negative transverse shear, the induced longitudinal shear was negative in the chondrons (the stacked columns of cells and their adjacent pericellular region) and positive in the extracellular matrix where slip occurred. This result was surprising because the specimens were loaded in simple shear in the transverse direction, so the overall total longitudinal shear of the specimens was zero. In order to better visualize and compare the spacing between the regions of slip, the induced shear strain maps of the proliferating and hypertrophic zones were averaged along the direction of growth to create a shear strain profile for each specimen (Fig. 4d). When these maps were compared across the first five specimens, all strain maps had the same qualitative features: wide negative regions separated by sharp peaks of positive strain (Fig. 4e).
Fig. 4.
Transverse variation in induced shear strain γxy within the proliferative and hypertrophic zones. (a, b) Due to intercolumnar sliding, medial–lateral photobleached lines become discontinuous as growth plate is sheared. This slipping behavior results in large negative and positive shear strains between chondrons, as demonstrated by a map of γxy (c). (d) Averaging the γxy strain map of a single sample in the longitudinal direction produces a profile of strain as a function of transverse position, in which the bands of large positive strain observed in (c) manifest as regularly spaced peaks. (e) Average γxy as a function of transverse distance from the midpoint between the regions of slip for all (n=5) samples. Each curve in the plot represents the average of at least 5 traces from a single growth plate sample. Scale bars in (a, b) indicate 100 μm.
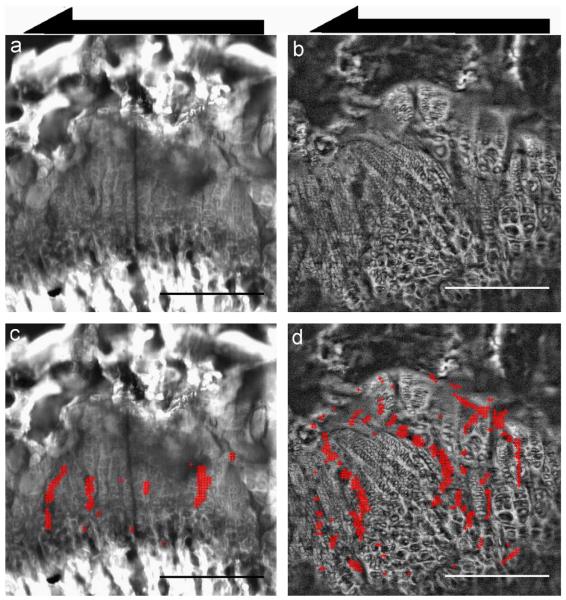
Confocal images comparing growth plates from control and vitamin D deficient rats showed significant morphological differences resulting from dietary insufficiency (Fig. 5). As expected, normal growth plates had a distinct columnar structure that was aligned in the direction of growth. In contrast, chondrons in the vitamin D deficient specimens exhibited greater variation in width. Under shear, regions of high induced longitudinal strain (γxy) were still located between columns of cells for both control and vitamin D deficient samples; however, the areas of peak strain in the control growth plates appeared to have a consistent spacing of about two or three cells while such areas in the vitamin D deficient growth plates were less clearly organized.
Fig. 5.
Local concentrations of induced shear strain γxy in the control (left) and vitamin D deficient (right) growth plates. (a, b) Representative confocal images of growth plates from control and vitamin D deficient rats indicating the direction of loading for mechanical testing. Growth plates from animals with vitamin D deficient diets exhibit extensive disorganization, with a discontinuous structure and columns of chondrocytes aligned in varying directions that were not parallel to the axis of growth. (Bottom) Superimposed on confocal images are markers denoting regions of high strain: the red + indicate locations where γxy exceeds 1 standard deviation above the average strain for each image. The black arrows indicate the direction of applied shear. As before, all tissue images are shown epiphyseal side up. Scale bars indicate 250 μm. (For interpretation of the references to color in this figure caption, the reader is referred to the web version of this article.)
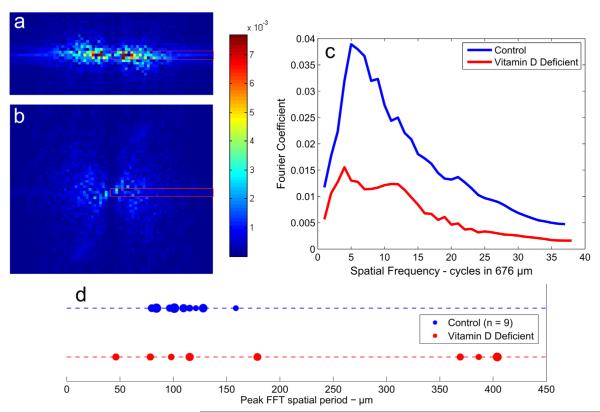
The 2D FFT was performed on the induced shear strain maps of both the control and vitamin D deficient specimens to quantify the periodicity of the strain fields in the transverse direction (Fig. 6). The FFTs of control growth plates often had a single pair of symmetrical salient peaks. This indicated a single characteristic spatial frequency, or periodic spacing, between the high-strain regions. Moreover this characteristic spatial frequency was always directed horizontally across the strain maps, confirming that this pattern was predominantly transverse to the direction of growth. These observations validated our earlier analysis of averaging the strain maps in the longitudinal direction, and was consistent with our observation that high strains were concentrated in boundary-like regions that run parallel to the direction of growth. The spatial period of the controls (n = 8) was 110±24 μm (mean±SD). In contrast, FFTs of vitamin D deficient growth plates often did not have such direction-specific periodicity. Typically, vitamin D deficient growth plate sections in which the chondron alignment was disrupted had near-random, aperiodic strain field FFTs. However, growth plate sections in which chondron alignment was maintained had strain field FFTs which resembled those of the controls. The average spatial period of strain concentrations in the vitamin D deficient samples (n = 9) was 210±151 μm. Additionally, the vitamin D deficient growth plates exhibited greater heterogeneity within specimens, both in microstructure and strain field properties. In fact, while some sections of the deficient growth plate were highly disorganized other regions had microstructure and strain fields resembling those of the control growth plates (Fig. 6).
Fig. 6.
Two dimensional fast Fourier transforms (2D FFT) of strain fields γxy of growth plates shown in Fig. 5 ((a) control, (b) vitamin D deficient). These maps show the frequency distribution in spatial patterns of induced shear strain. The maps have been normalized to have a sum of 1, such that pixel intensity corresponds to the relative weight of that Fourier component in the reconstruction. (a) The high-magnitude horizontal band indicates that the strain field is strongly periodic in the horizontal and aperiodic in the vertical directions. The bright peaks indicate a single characteristic spatial frequency. (b) The 2D FFT of the vitamin D deficient growth plates is more widely distributed than that of the controls. (c) Comparison of the primarily horizontal Fourier components of the 2D FFT. The control specimen has a maximum Fourier coefficient at 6 cycles in the analyzed area. Since the analyzed area was 676 μm for this image sequence, this corresponds to a spatial period of about 676 μm=6 = 113 μm. The primarily horizontal components of the vitamin D deficient specimen 2D FFT does not have such a distinct peak and is smaller overall, the Fourier components being much more diffusing in both spatial frequency and direction. (d) A dot plot showing the spatial periods corresponding to the largest Fourier components of each of the Control and Vitamin D deficient FFT’s. Dot size is proportional to the maximum value of that FFT, such that FFT’s with a single large characteristic peak (indicating a very regular periodic spacing of shear concentrations) are represented by larger dots while flatter FFT’s are represented by smaller dots. The spatial periods of the control are clustered between 50 and 150 μm and have larger peak Fourier components while the dominant spatial periods in the vitamin D deficient FFT’s are more widely distributed and have slightly smaller peak Fourier components overall.
4. Discussion
This study established that growth plate exhibits a complex, heterogeneous response to shear strain transverse to the direction of growth. The proliferation zone experienced larger shear strains than the resting and hypertrophic zones. While all samples were most compliant near the middle of the growth plate, the location-dependent shear strain and modulus demonstrated significant variation between samples. We surmised that these variations were a result of the non-uniform geometry of bone surrounding the tibial growth plate. Although the sample location was chosen to minimize the roughness of the growth plate/bone intersection, microscale variations in growth plate height were visible in all confocal micrographs (Fig. 2). As a result of these undulations, the material properties cannot be assumed to be transversely isotropic in the x and z directions. Thus, ∣G*∣ vs. s shown in Fig. 3 should be thought of as effective, geometry-dependent shear modulus profiles. Our results then suggest that shear loading induced strain primarily in the proliferation zone not because the extracellular matrix was particularly compliant in this region, but because the tissue was more isolated from the undulating epiphyseal and metaphyseal boundaries that frame the growth plate and protect the tissue from high shear loads in vivo. Since mechanical loading is known to elicit a zone-specific biochemical response (Villemure et al., 2005), this finding is relevant for understanding the mechanobiology of growth plate.
Intercolumnar sliding was observed in growth plates from both normal and vitamin D deficient rats. Notably, sliding was never observed at every boundary between cell columns, rather always at a spatial interval somewhat larger. This suggests the presence of additional tissue structures and organization beyond individual cell columns. Mineralizing tethers noted recently in the rat (Martin et al., 2003) and mouse (Chen et al., 2009) growth plate are one possible such feature. The spacing of these tethers is 50–200 μm in normal growth plate (Lee et al., 2011) similar to the characteristic 110 μm spacing of the shear strain field shown here (Fig. 6). Furthermore, the observation that tether spacing increases in vitamin D receptor knockout mice (Lee et al., 2011) is consistent with the increased spatial period in the shear strain field resulting from vitamin D deficiency (Fig. 6).
The comparison of growth plates from normal and vitamin D deficient rats shows clear connections between tissue structure and mechanical behavior. The disorganization of the columnar structure of the vitamin D deficient growth plate was directly related to changes in shear strain fields. In general, regions of maximal shear strain occurred on periphery of discrete bundles of cell columns (Fig. 5). As such, where these column bundles were small, local spacing between regions of high slip were small and where these bundles were larger, regions of high slip were spaced farther apart. In general, both cell columns and regions of high slip were oriented at a wide range of angles from the main axis of growth in vitamin D deficient animals (Figs. 5 and 6). The 2D FFT analysis of the strain fields demonstrated the high degree of directionality in the strain fields in normal growth plate and the lack of such directionality in the vitamin D deficient growth plates, and quantitative comparison between the two experimental groups was achieved by extracting the peak spatial frequencies and their magnitudes from the 2D FFTs (Fig. 6).
Previously published measurements by Tschegg et al. (2012) of ovine growth plate fracture under mode I ‘opening’ loading have indicated that growth plate cartilage is especially susceptible to fracture along the direction of growth. Even when the growth plate was tested under mode I loading transverse to the direction of growth, cracks often still propagated along the direction of growth (Tschegg et al., 2012). Although the samples were loaded in pure shear in this experiment, the heterogeneity and anisotropy of the growth plate would result in localized mode I loads. These would result from intercolumnar sliding—the cell columns can be pressed against or pulled away from each other as the sample is sheared. They also would result from the undulating epiphyseal and metaphyseal boundaries of the growth plate cartilage, and spatial variations in growth plate thickness. Since the vitamin D deficient specimens exhibited greater heterogeneity in chondron size and orientation as well as greater variation in width, it seems likely that the vitamin D deficient samples experienced elevated local mode I loads under transverse shear, compared to the controls.
Electron microscope imaging and histological investigations of growth plate ultrastructure have established that extracellular matrix is divided into three compartments: the pericellular matrix immediately surrounding each cell and the territorial and interterritorial matrices (Bonucci and Motta, 1990; Noonan et al., 2005; Akisaka et al., 1998). The territorial matrix encloses chondrons, while the interterritorial matrix lies between them. Given that collagen fibrils (the primary tensile mechanical component of cartilage) in the interterritorial matrix appear denser than the pericellular and territorial matrix (Akisaka et al., 1998), the shear-induced intercolumnar slip described in the current study is surprising. However, the interterritorial collagen network forms longitudinal septa oriented along the direction of growth, i.e. the direction of slip (Noonan et al., 2005). If cross-linking in this region is weak, these structures may allow for the observed sliding behavior. Therefore, chondrons can be thought of as bundles of cells surrounded by fibrillar sheaths. In addition to affecting growth plate bulk mechanics, these sheaths may also have a role in directing cell proliferation, guiding cells to divide along the longitudinal axis of chondrons. In this regard, a higher shear compliance of the interterritorial matrix would reduce off-axis stresses generated by different growth rates in neighboring chondrons. When regions of columnar sliding are directed at significant angles relative to the longitudinal axis of the bone (i.e. as in vitamin D deficiency), this would be expected to result in slower longitudinal growth as well as wider and more curved growth plates and bones. As such, the identification of regions of high intercolumnar sliding combined with the disruption in directionality of the growth plate due to vitamin D deficiency may give new insights into the mechanical mechanisms of growth plate and bone deformities due to rickets.
Acknowledgments
This work was supported by the National Institutes of Health (R01-AR053571, R01-AR053571-S1 and R21-AR054867). We thank Darvin Griffin and Jesse Silverberg for their advice and assistance and Drs. Nelly Farnum and Adele Boskey for their keen insight and helpful conversations.
Footnotes
Conflict of interest statement The authors have no conflict of interest to disclose.
References
- Akisaka T, Nakayama M, Yoshida H, Inoue M. Ultrastructural modifications of the extracellular matrix upon calcification of growth plate cartilage as revealed by quick-freeze deep etching technique. Calcified Tissue International. 1998;63:47–56. doi: 10.1007/s002239900488. [DOI] [PubMed] [Google Scholar]
- Allgrove J. Is nutritional rickets returning? Archives of Disease in Childhood. 2004;89:699–701. doi: 10.1136/adc.2003.036780. [DOI] [PMC free article] [PubMed] [Google Scholar]
- Bonaventure J, Rousseau F, Legeai-Mallet L, Le Merrer M, Munnich A, Maroteaux P. Common mutations in the fibroblast growth factor receptor 3 (fgfr3) gene account for achondroplasia, hypochondroplasia, and thanatophoric dwarfism. American Journal of Medical Genetics. 1998;63:148–154. doi: 10.1002/(SICI)1096-8628(19960503)63:1<148::AID-AJMG26>3.0.CO;2-N. [DOI] [PubMed] [Google Scholar]
- Bonucci E, Motta P. Electron Microscopy in Biology and Medicine. Luwer Academic Publishers; 1990. Ultrastructure of Skeletal Tissues: Bone and Cartilage in Health and Disease. [Google Scholar]
- Bruehlmann S, Matyas J, Duncan N. Issls prize winner: collagen fibril sliding governs cell mechanics in the annulus fibrosus: an in situ confocal microscopy study of bovine discs. Spine. 2004;29:2612–2620. doi: 10.1097/01.brs.0000146465.05972.56. [DOI] [PubMed] [Google Scholar]
- Buckley M, Bergou A, Fouchard J, Bonassar L, Cohen I. High-resolution spatial mapping of shear properties in cartilage. Journal of Biomechanics. 2010;43:796–800. doi: 10.1016/j.jbiomech.2009.10.012. [DOI] [PMC free article] [PubMed] [Google Scholar]
- Buckley M, Gleghorn J, Bonassar L, Cohen I. Mapping the depth dependence of shear properties in articular cartilage. Journal of Biomechanics. 2008;41:2430–2437. doi: 10.1016/j.jbiomech.2008.05.021. [DOI] [PubMed] [Google Scholar]
- Chen J, Lee C, Coleman R, Yoon J, Lohmann C, Zustin J, Guldberg R, Schwartz Z, Boyan B. Formation of tethers linking the epiphysis and metaphysis is regulated by vitamin d receptor-mediated signaling. Calcified Tissue International. 2009;85:134–145. doi: 10.1007/s00223-009-9259-1. [DOI] [PubMed] [Google Scholar]
- Cohen B, Chorney G, Phillips D, Dick H, Mow V. Compressive stress-relaxation behavior of bovine growth plate may be described by the nonlinear biphasic theory. J Orthopaedic Research. 1994;12:804–813. doi: 10.1002/jor.1100120608. [DOI] [PubMed] [Google Scholar]
- DiFiori J. Overuse injury of the physis: a “growing” problem. Clinical Journal of Sport Medicine. 2010;20:336–337. doi: 10.1097/JSM.0b013e3181ebb55d. [DOI] [PubMed] [Google Scholar]
- Eberl C. Digital image correlation and tracking. 2010 ⟨ http://www.mathworks. com/matlabcentral/fileexchange/12413 ⟩ .
- Ehrlich MG, Weiss C, Mankin HJ, Treadwell BV, Sanzone C. Histochemical, metabolic and ultrastructural studies of the maturation zone of the rachitic rat epiphyseal plate. Journal of Bone & Joint Surgery. 1973;55:785–794. [PubMed] [Google Scholar]
- Farnum CE, Wilsman NJ. Skeletal Growth and Development: Clinical Issues and Basic Science Advances. AAOS; Rosemont: 1998. [Google Scholar]
- Gaber S, Fischerauer E, Fröhlich E, Janezic G, Amerstorfer F, Weinberg A. Chondrocyte apoptosis enhanced at the growth plate: a physeal response to a diaphyseal fracture. Cell Tissue Research. 2009;335:539–549. doi: 10.1007/s00441-008-0735-0. [DOI] [PubMed] [Google Scholar]
- Gay C, Gilman V, Leach R., Jr. Immunolocalization of vascularization factors in normal, tibial dyschondroplasia and rachitic cartilage. Avian Pathology. 2007;36:445–451. doi: 10.1080/03079450701591387. [DOI] [PubMed] [Google Scholar]
- Genever P, Dickson I. Influence of vitamin D status on hyaluronan localization in bone. Bone. 1996;18:429–435. doi: 10.1016/8756-3282(96)00046-4. [DOI] [PubMed] [Google Scholar]
- Kim G, Boskey AL, Baker SP, van der Meulen MC. Improved prediction of rat cortical bone mechanical behavior using composite beam theory to integrate tissue level properties. Journal of Biomechanics. 2012;45:2784–2790. doi: 10.1016/j.jbiomech.2012.08.042. [DOI] [PMC free article] [PubMed] [Google Scholar]
- Lee C, Chen J, Wang Y, Williams J, Ranly D, Schwartz Z, Boyan B. Coordinated tether formation in anatomically distinct mice growth centers is dependent on a functional vitamin d receptor and is tightly linked to three-dimensional tissue morphology. Bone. 2011;49:419–427. doi: 10.1016/j.bone.2011.05.004. [DOI] [PubMed] [Google Scholar]
- Lee K, Pelker R, Rudicel S, Ogden J, Panjabi M. Histologic patterns of capital femoral growth plate fracture in the rabbit: the effect of shear direction. Journal of Pediatric Orthopaedics. 1985;5:32–39. doi: 10.1097/01241398-198501000-00007. [DOI] [PubMed] [Google Scholar]
- van Leeuwen B, Hartel R, Jansen H, Verkerke G, Veth R, Kamps W, Hoekstra H. Chemotherapy affects the pattern of failure after shear loading of the proximal tibial growth plate. Archives of Orthopaedic and Trauma Surgery. 2004;124:503–506. doi: 10.1007/s00402-004-0732-z. [DOI] [PubMed] [Google Scholar]
- Macsai C, Hopwood B, Chung R, Foster B, Xian C. Structural and molecular analyses of bone bridge formation within the growth plate injury site and cartilage degeneration at the adjacent uninjured area. Bone. 2011;49:904–912. doi: 10.1016/j.bone.2011.07.024. [DOI] [PubMed] [Google Scholar]
- Marks S, Jr., Lundmark C, Christersson C, Wurtz T, Odgren P, Seifert M, MacKay C, Mason-Savas A, Popoff S. Endochondral bone formation in toothless (osteopetrotic) rats: failures of chondrocyte patterning and type x collagen expression. International Journal of Developmental Biology. 2000;44:309–316. [PubMed] [Google Scholar]
- Martin E, Ritman E, Turner R. Time course of epiphyseal growth plate fusion in rat tibiae. Bone. 2003;32:261–267. doi: 10.1016/s8756-3282(02)00983-3. [DOI] [PubMed] [Google Scholar]
- Martin R, Burr D, Sharkey N. Skeletal Tissue Mechanics. Springer; 1998. [Google Scholar]
- Noonan K, Hunziker E, Nessler J, Buckwalter J. Changes in cell, matrix compartment, and fibrillar collagen volumes between growth-plate zones. Journal of Orthopaedic Research. 2005;16:500–508. doi: 10.1002/jor.1100160416. [DOI] [PubMed] [Google Scholar]
- Oh J, Park S, de Crombrugghe B, Kim J. Chondrocyte-specific ablation of osterix leads to impaired endochondral ossification. Biochemical and Biophysical Research Communications. 2012;418:634–640. doi: 10.1016/j.bbrc.2012.01.064. [DOI] [PMC free article] [PubMed] [Google Scholar]
- Özkan B. Nutritional rickets. Journal of Clinical Research in Pediatric Endocrinology. 2010;2:137. doi: 10.4274/jcrpe.v2i4.137. [DOI] [PMC free article] [PubMed] [Google Scholar]
- Radhakrishnan P, Lewis N, Mao J. Zone-specific micromechanical properties of the extracellular matrices of growth plate cartilage. Annals of Biomedical Engineering. 2004;32:284–291. doi: 10.1023/b:abme.0000012748.41851.b4. [DOI] [PubMed] [Google Scholar]
- Revel M, Roudier R, Roudier B, Hamard G, Amor B. Effects of repetitive strains on vertebral end in young rats. Clinical Orthopaedics and Related Research. 1985;279:303–309. [PubMed] [Google Scholar]
- Sabbagh Y, Carpenter T, Demay M. Hypophosphatemia leads to rickets by impairing caspase-mediated apoptosis of hypertrophic chondrocytes. Proceedings of the National Academy of Science of the United States of America. 2005;102:9637–9642. doi: 10.1073/pnas.0502249102. [DOI] [PMC free article] [PubMed] [Google Scholar]
- Sergerie K, Lacoursière M, Lévesque M, Villemure I. Mechanical properties of the porcine growth plate and its three zones from unconfined compression tests. Journal of Biomechanics. 2009;42:510–516. doi: 10.1016/j.jbiomech.2008.11.026. [DOI] [PubMed] [Google Scholar]
- Sonnenberg J, Pansini A, Christakos S. Vitamin d-dependent rat renal calcium-binding protein: Development of a radioimmu no assay, tissue distribution, and immunologic identification. Endocrinology. 1984;115:640–648. doi: 10.1210/endo-115-2-640. [DOI] [PubMed] [Google Scholar]
- Takechi M, Itakura C. Ultrastructural studies of the epiphyseal plate of chicks fed a vitamin d-deficient and low-calcium diet. Journal of Computational Pathology. 1995;113:101–111. doi: 10.1016/s0021-9975(05)80026-x. [DOI] [PubMed] [Google Scholar]
- Tardivel S, Banide H, Porembska Z, Aymard P, Dupuis Y, Lacour B. Different forms of alkaline phosphatase in adult rat femur. effect of a vitamin d 3-deficient diet and of a sorbitol-enriched diet. Calcified Tissue International. 1992;50:433–438. doi: 10.1007/BF00296774. [DOI] [PubMed] [Google Scholar]
- Tschegg E, Celarek A, Fischerauer S, Stanzl-Tschegg S, Weinberg A. Fracture properties of growth plate cartilage compared to cortical and trabecular bone in ovine femora. Journal of the Mechanical Behavior of Biomedical Materials. 2012;14:119–129. doi: 10.1016/j.jmbbm.2012.05.011. [DOI] [PubMed] [Google Scholar]
- Villemure I, Chung M, Seck C, Kimm M, Matyas J, Duncan N. Static compressive loading reduces the mrna expression of type ii and x collagen in rat growth-plate chondrocytes during postnatal growth. Connect Tissue Research. 2005;46:211–219. doi: 10.1080/03008200500344058. [DOI] [PubMed] [Google Scholar]
- Villemure I, Cloutier L, Matyas J, Duncan N. Non-uniform strain distribution within rat cartilaginous growth plate under uniaxial compression. Journal of Biomechanics. 2007;40:149–156. doi: 10.1016/j.jbiomech.2005.11.008. [DOI] [PubMed] [Google Scholar]
- Villemure I, Stokes I. Growth plate mechanics and mechanobiology, a survey of present understanding. Journal of Biomechanics. 2009;42:1793–1803. doi: 10.1016/j.jbiomech.2009.05.021. [DOI] [PMC free article] [PubMed] [Google Scholar]
- Wattenbarger J, Gruber H, Phieffer L. Physeal fractures, part I: histologic features of bone, cartilage, and bar formation in a small animal model. Journal of Pediatric Orthopaedics. 2002;22:703–709. [PubMed] [Google Scholar]


