Abstract
The prevalence of valvular heart disease is increasing as the population ages. In diagnosing individuals with valve disease, echocardiography is the primary imaging modality used by clinicians both for initial assessment and for longitudinal evaluation. However, in some cases cardiovascular magnetic resonance has become a viable alternative in that it can obtain imaging data in any plane prescribed by the scan operator, which makes it ideal for accurate investigation of all cardiac valves: aortic, mitral, pulmonic, and tricuspid. In addition, CMR for valve assessment is noninvasive, free of ionizing radiation, and in most instances does not require contrast administration. The objectives of a comprehensive CMR study for evaluating valvular heart disease are threefold: (1) to provide insight into the mechanism of the valvular lesion (via anatomic assessment), (2) to quantify the severity of the valvular lesion, and (3) to discern the consequences of the valvular lesion
Keywords: valvular heart disease, cardiovascular magnetic resonance, CMR, mitral insufficiency, aortic stenosis

Introduction
The prevalence of valvular heart disease is increasing along with the life span of the population. In assessing individuals with valve disease, echocardiography is the primary imaging modality used by clinicians both for initial assessment and for longitudinal evaluation. Information regarding valve morphology and function, cardiac chamber size, wall thickness, ventricular function, and estimates of pulmonary artery pressures can be readily obtained and integrated to formulate an assessment of valve disease severity. In some instances, however, body habitus or the presence of coexisting lung disease may result in suboptimal acoustic windows on echocardiography, which may lead to technically difficult studies. Additionally, in some patients, information from clinical history and physical examination or other diagnostic tests may be discordant with echocardiographic findings. In these instances, there is a significant clinical role for cardiovascular magnetic resonance (CMR). The diagnostic capabilities of CMR have increased substantially over the past 20 years due to hardware and software advances. Today, CMR has a number of unique advantages over other imaging modalities. It provides a view of the entire heart without limitations from inadequate imaging windows or body habitus. CMR also can obtain imaging data in any imaging plane prescribed by the scan operator, which makes it ideal for accurate investigation of all cardiac valves: aortic, mitral, pulmonic, and tricuspid. In addition, CMR for valve assessment is noninvasive, free of ionizing radiation, and in most instances does not require contrast administration.
This review focuses on the most common valvular indications for performing clinical CMR studies in our laboratory: mitral insufficiency, aortic stenosis, and aortic regurgitation.1 It includes a description of the CMR techniques and an overview of selected validation and reproducibility studies. The objectives of a comprehensive CMR study for evaluating valvular heart disease are threefold: 1) to provide insight into the mechanism of the valvular lesion (via anatomic assessment); 2) to quantify the severity of the valvular lesion; and 3) to discern the consequences of the valvular lesion including its effects on left ventricular (LV) volume, LV systolic function, and left atrial volumes. In most instances this information can be obtained without the need for intravenous contrast agents (gadolinium). Therefore, CMR can be performed even in patients with severe renal failure.
CMR Technique
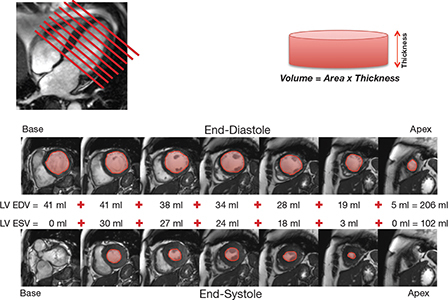
The typical CMR study for evaluating a valvular lesion involves the performance of a complete set of sequential short-axis (every 10 mm from base to apex) and long-axis (2-, 3-, and 4-chamber views) cine images using a steady-state free precession (SSFP) pulse sequence. This provides excellent signal-to-noise ratio and high blood-to-myocardium contrast. The typical spatial resolution is 1.5 to 2.0 mm per pixel with 6 mm slice thickness. Using this ultrafast pulse sequence, temporal resolution of 25 to 35 ms (frame rates of 30-40/s) can be achieved within a 5 to 6 second breath hold that is generally tolerable for most patients even in the presence of severe valvular disease. In individuals who have significant difficulty with breath holding, a newer non-breath held “real-time” pulse sequence with parallel imaging can be used with only a modest compromise in spatial and temporal resolution. An example of a typical series of cine images is shown in Figure 1. In addition to providing a comprehensive assessment of regional LV and right ventricular (RV) function, this data set can be used to planimeter LV and RV volumes in end-diastole and end-systole, thus determining ventricular stroke volume and ejection fraction. Additionally, planimetry of epicardial contours can be performed to obtain ventricular mass. Because of the tomographic nature of the technique, CMR can provide these measures in a three-dimensional fashion without the need for geometric assumptions—in fact, it is considered the gold standard, with extensive validation in both the in vivo and ex vivo settings.
Figure 1.
Typical set of cine images utilizing a steady-state free precession pulse sequence. From a 4-chamber long-axis view, serial short-axis cine images are acquired every 1 cm from base to apex of the heart. The left ventricular (LV) endocardial contours are planimetered in both end-diastole and end-systole and added to calculate LV end-diastolic volume (LV EDV) and LV end-systolic volume (LV ESV). The difference between LV EDV and LV ESV represents the LV stroke volume. LV ejection fraction can be calculated by dividing the LV stroke volume by the LV EDV and multiplying by 100. The same can be performed for the right ventricle (RV) to ascertain RV end-diastolic volume, RV end-systolic volume, RV stroke volume, and RV ejection fraction.
Mitral Insufficiency
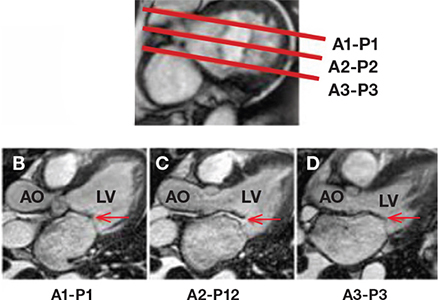
Before we discuss the CMR method for quantification of mitral regurgitation severity, it is important to recognize that CMR may be able to provide useful information regarding the mechanism of mitral insufficiency. An understanding of the mitral valve anatomy is required to perform optimal imaging with CMR. The mitral valve consists of two leaflets, anterior and posterior. The posterior leaflet has three scallops. For purposes of classification, Carpentier defined three segments on each leaflet: A1 (lateral), A2 (middle), and A3 (medial) for the anterior leaflet, and P1, P2, and P3 for the posterior leaflet (Figure 2).2, 3 When imaging a patient with suspected mitral valve abnormality, it is essential that all segments of the mitral valve leaflets are interrogated with individual cine images. This is accomplished by obtaining sequential long-axis cine slices through each segment as is shown in Figure 3. This provides long-axis views that interrogate all of the valve coaptation interfaces (A-P1, A2-P2, and A3-P3), provide insight into mechanism (i.e., prolapse, flail, restriction), and also aid in localization of the abnormality. CMR has the potential to visualize all parts of the valve (leaflets, chordae tendineae, and papillary muscles) throughout the entire cardiac cycle. Congenitally abnormal valve leaflets, aberrant papillary muscles or aberrant chordal attachments (parachute mitral valve), leaflet thickening, presence and extent of calcification, leaflet redundancy and prolapse, and commissural fusion are all anatomic descriptions that have been reported by CMR.4
Figure 2.
Anatomy of the mitral valve shown in a cross section during mid-diastole. The three segments or scallops of the anterior mitral leaflet are labeled A1, A2, and A3. The three segments or scallops of the posterior mitral leaflet are labeled P1, P2, and P3.
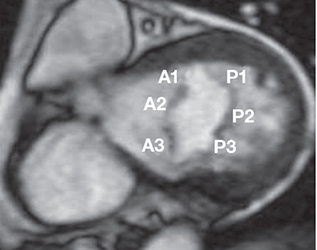
Figure 3.
CMR interrogation of the mitral valve. Using a cross-sectional view of the mitral valve as a reference point (A), serial long-axis views are prescribed through the A1 to P1 scallops (B), the A2 to P2 scallops (C), or the A3 to P3 scallops (D) to produce long-axis cine views interrogating the individual scallops and coaptation points of the mitral valve. In this example, there is adequate coaptation of the A1 to P1 scallops (B) and the A3 to P3 scallops (D) but impaired coaptation of the A2 to P2 scallops, demonstrating a flail P2 scallop (C). AO: aorta; LV: left ventricle.
Quantifying the Severity of Mitral Insufficiency
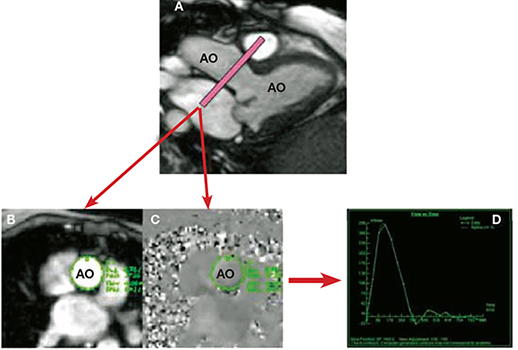
In some patients, the nature of the orientation of the regurgitant jet, such as severe obliquity, can make echocardiographic assessment unreliable. The phase contrast or velocity-encoded cine CMR pulse sequence is the imaging sequence of choice in quantifying flow and calculating velocities. Protons moving along a magnetic field gradient acquire a phase shift relative to stationary spins.5 The phase shift is directly proportional to the velocity of the moving protons in a linear gradient. Phase-contrast CMR produces two sets of images: magnitude images and phase velocity maps (Figure 4). The magnitude image is used for anatomic orientation of the imaging slice and to identify the boundaries of the vessel imaged. The phase map encodes the velocities within each pixel. Using both images, a region of interest can be traced at each time frame of the data set. The region of interest must be drawn carefully for each frame of the cardiac cycle because of movement and deformation of the vessel.4 Using this data, the computer software can calculate anterograde and retrograde flows through a region of interest (Figure 4).
Figure 4.
Phase-contrast CMR of the aorta to determine aortic stroke volume and flow. Utilizing a 3-chamber cine view for reference (A), a phase-contrast CMR slice is prescribed in the aortic root (just above the aortic valve). This produces two sets of images: (B) the magnitude image provides details of the anatomy, contour, and shape of the aorta, and (C) the phase velocity map depicts the velocity and direction of flow in each pixel within the aorta. By outlining the contours of the aorta throughout each phase in the cardiac cycle, a flow curve can be generated (D) to determine aortic forward and reverse stroke volume and flow. AO: aorta; LV: left ventricle.
Phase-contrast CMR has been shown to be very accurate for assessing anterograde and retrograde flow across semilunar valves and therefore is the technique used for assessing aortic or pulmonic insufficiency.1, 4, 6 This technique for the mitral valve is more difficult because of significant movement of the mitral annulus during systole. For this reason, quantification of mitral insufficiency volume is performed using an alternative approach. In patients with mitral insufficiency, the total LV stroke volume is increased and is equivalent to the aortic forward stroke volume (anterograde flow) plus the mitral regurgitant volume (retrograde flow) (Figure 5). Since the total LV stroke volume can be calculated from planimetry of the LV end-diastolic and end-systolic contours (Figure 1), and the aortic forward flow can be calculated from phase-contrast CMR at the aortic root (Figure 4), the difference between these values will be equal to the mitral insufficiency volume. This technique provides accurate calculations in the setting of isolated mitral insufficiency and coexisting aortic insufficiency, since aortic insufficiency increases both the LV stroke volume and aortic forward flow but leaves the difference between the two values unaffected. Selected validation studies are shown in Table 1. Calculation of regurgitant volumes by CMR also has low study variability as is demonstrated in several studies evaluating reproducibility of regurgitant volume assessment (Table 2). This makes CMR an optimal technique for serial assessment of mitral insufficiency in patients who are managed expectantly.
Figure 5.
Example of the method used to calculate mitral regurgitant volume (see text for details). AO: aorta; LA: left atrium; LV: left ventricle; EDV: end diastolic volume; ESV: end systolic volume; MR: mitral regurgitation
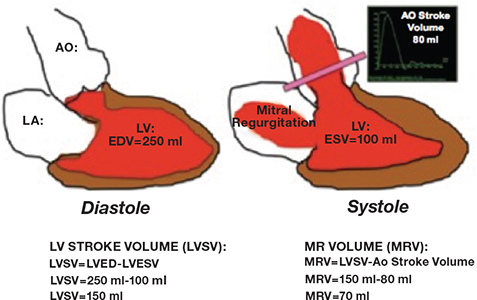
Table 1.
| First Author (Year) | CMR Method | Reference Standard: Method | n | r |
| Fujita (1994) | Velocity mapping: (LV mitral inflow–Ao outflow) RV and RF | TTE: jet area | 29 | RV 074 RF 097 |
| Hundley (1995) | Velocity mapping: (LV cine and aortic phase contrast) | catheterization: RV index | 23 | 097 |
| RV index and RF | RF | 096 | ||
| Kizibash (1998) | Velocity mapping: (LV cine and aortic phase contrast) RF | TTE: | ||
| pulsed Doppler RV | 22 | 092 | ||
| pulsed Doppler RF | 22 | 082 | ||
RV: regurgitant volume; RF: regurgitant fraction; LV: left ventricle; RV: right ventricle; Ao: aortic; TTE: transthoracic echocardiography
Table 2.
| First Author (Year) | CMR Method | n | CMR Reproductibility*: Means Difference±1 SD |
| Fujita (1994) | Velocity mapping: (LV mitral inflow–Ao outflow) RV and RF | 29 | RV r=0 99 RF r= 0 98 |
| Hundley (1995) | Velocity mapping: (LV cine and aortic phase contrast) RV index and RF |
23 | FSV 3±3% |
| TSV 9±7% | |||
| RF 10±9% | |||
| Kon (2004) | Velocity mapping: (LV cine and aortic phase contrast) RF | 28 | VM 0 6±4 8%- |
| VM–2±77 |
RV: regurgitant volume; RF: regurgitant fraction; FSV: forward stroke volume; TSV: total stroke volume; VM: velocity mapping.
Aortic Stenosis
There are cases in which parallel alignment of the Doppler transducer with the aortic flow cannot be obtained, making it technically difficult to record the highest aortic transvalvular velocity with Doppler. In that regard, CMR is advantageous given its capability of slice selection at any angle and its ability to measure the velocity of the transaortic flow. The CMR SSFP cine images have excellent signal-to-noise ratio and spatial resolution that is better than transthoracic echocardiography (TTE) and comparable to transesophageal echocardiography (TEE) for anatomic aortic valve assessment (planimetry and number of cusps).7 There are well-validated methods to assess aortic stenosis severity with CMR (Table 3), and it offers a wider field of view than TTE and TEE. En-face imaging of the aortic valve and the use of phase-contrast velocity mapping make it possible to determine the severity of the aortic stenosis by peak velocity.8 These assessments are done without the use of gadolinium-based contrast.
Table 3.
| First Author (Year) | CMR Method | n | Reference Standard: Method | r | Mean Difference ± SD (CMR-Echo) | CMR Reproducibility Mean Difference ± SD or r |
| Kilner (1993) | V max by VENC | 26 | TTE Doppler | n/a | -0.10±0.46 m/s | 0.11±0.29 m/s |
| Caruthers (2003) | Peak Pressure | 24 | TTE Doppler | 0.82 | n/a | r=0.94 |
| Mean Pressure | 0.87 | |||||
| John (2003) | Planimetry | 40 | TTE Planimetry | 0.96 | 0.02±0.08 cm2 | 0.07±0.06 cm2 |
| Reant (2006) | Planimetry | 32 | TTE Planimetry | 0.58 | 0.01±0.14 cm2 | 0.03±0.14 cm2 |
VENC: velocity encoding; TTE: transthoracic echocardiography; TEE: transesophageal echocardiography; n/a: not available.
Quantifying the Severity of Aortic Stenosis
Phase-contrast velocity mapping makes it possible to measure the flow of interest by calculating a shift of the precession between the stationary protons and protons moving in a magnetic field. The magnitude of this phase shift is proportional to the velocity of interest. When the velocity assessed is higher than the velocity encoded in that particular phase, aliasing occurs. The velocities must be sampled at 25 to 50 cm/s intervals. If the TTE peak aortic valve velocity from a previous study is available, this can help tailor the protocol to the patient and make the assessment faster and more efficient. The determined peak aortic valve velocity is the lowest velocity where there is no aliasing (Figure 6). Methods to assess the mean gradient are not widely used, mainly because Doppler echocardiography has higher temporal resolution than phase-contrast velocity mapping, which could cause underestimation of the mean gradient when compared to Doppler.9 If a misalignment between the phase direction and the flow direction is more than 20 degrees, the velocities can be inaccurate.10 The aortic valve is planimetered from a series of sequential high-resolution SSFPs or gradient echo cines every 4 mm from a transverse prescribed plane (encompassing the aortic valve). The smallest systolic opening during peak systole is planimetered (Figure 7).
Figure 6.
Example of aortic valve peak velocity determination by the velocity encoding mapping sequence (VENC thru-plane). (A) The anatomical orientation is provided by the magnitude image. (B, C) Black pixels at the aortic valve represent aliasing of the velocity through the valve, which means that the true peak velocity is higher than the one encoded in the sequence. (D) This represents the VENC that correspond to the true peak velocity (no aliasing, white pixels inside the aortic valve), which in this case is 450 cm/s.
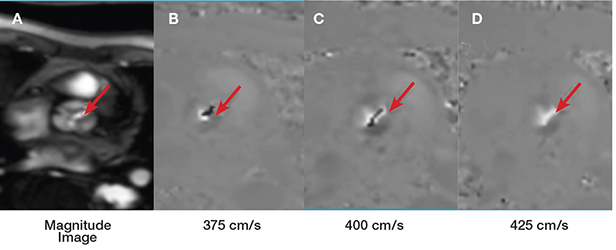
Figure 7.
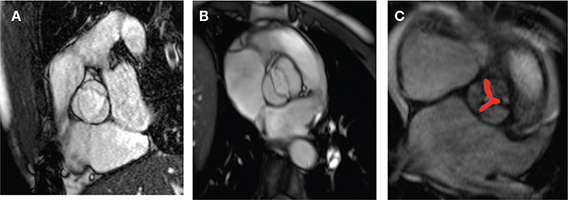
(A, B) The spatial resolution and signal-to-noise ratio of a modified SSFP sequence allows evaluation of the number of aortic cusps (A: tricuspid aortic valve, B: bicuspid aortic valve) and (C) determination of the aortic valve area by planimetry (red area) in this “en face” view. In this case, a valve area of 0.7 cm2 was measured.
In patients with severe LV systolic dysfunction, dobutamine administration may be added to the protocol to differentiate pseudo-aortic stenosis from real aortic stenosis when dobutamine echocardiography is inconclusive; in these cases, dobutamine is administered at the same dose stages as dobutamine echocardiography to a maximum dose of 20 mcg/kg for assessing contractile reserve.
Aortic Regurgitation
The strength of CMR for assessing valvular heart disease is its reproducibility of volume quantification.11 Aortic regurgitation is a valvular lesion that causes LV volume overload. This causes the LV to remodel eccentrically. Instead of measuring the end-diastolic and end-systolic diameter in one plane, the volume of the LV cavity can be determined directly with CMR. With a wider field of view, excellent signal-to-noise ratio, and the ability to perform angiography, CMR can help elucidate the mechanism of aortic regurgitation (annulus dilatation vs. organic), better assess aortic root dimension, and perform a full exam of the aorta.
Quantifying Aortic Regurgitation
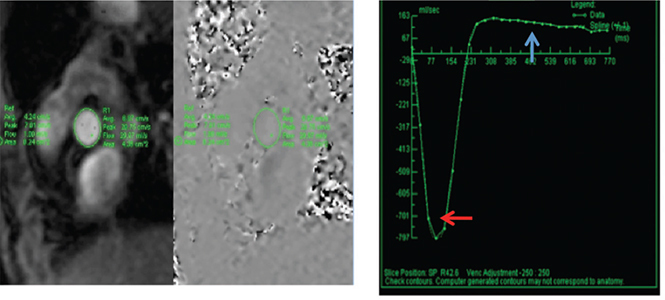
There are several methods of quantifying aortic regurgitation by CMR (Table 4). Phase-contrast velocity mapping just above the aortic valve (Figure 8) enables the user to determine the volume of blood moving in an anterograde and retrograde fashion within the cardiac cycle; thus, the regurgitant volume and regurgitant fraction can be calculated. If the stroke volume of the pulmonic forward flow is subtracted from the stroke volume of the aortic forward flow, the regurgitant volume and regurgitant fraction also can be calculated. In the absence of significant mitral regurgitation and right-sided lesions, regurgitant fraction can be calculated by subtracting the RV stroke volume from the LV stroke volume. These internal controls help to ensure consistency of volume quantification. The reproducibility of CMR in quantifying the severity of valvular regurgitation using phase-contrast velocity mapping is superior compared to well-validated TTE volumetric methods.12
Table 4.
| First Author (Year) | CMR Method | n | Reference Standard: Method | r | CMR Reproducibility |
| Globits (1990) | Spin Echo Cines. LV and RV volumes derived regurgitant | 20 | Cath determination of RF | 0.91 | Interobserver mean variation RVSV -7ml And LVSV -7.3 |
| Sondergaard (1993) | Velocity mapping (VENC) regurgitant volume | 9 | Angiographic grade by aortogram | 0.82 | n/a |
| Ley (2007) | VENC derived regurgitant fraction | 30 | TTE pulse wave Doppler AR quantification | 0.68 | n/a |
RF: regurgitant fraction; VENC: velocity encoding; TTE: transthoracic echocardiography; AR: aortic regurgitation; n/a: not available.
Figure 8.
In this phase-contrast sequence of a patient with aortic regurgitation, a region of interest (area) is traced at the aortic sinuses and for baseline correction at the subcutaneous fat (stationary tissue). The highest and lowest intensity pixels at the aortic sinuses represent the highest and lowest velocities. With area and velocity, a curve of flow vs. time can be plotted. The aortic stroke volume is calculated with the area under the curve (AUC) of the forward flow, and regurgitant volume can be determined with the AUC in diastole (blue arrow).
In aortic regurgitation, the anatomical regurgitant orifice (ARO) can be determined by obtaining an “en-face” view of the aortic valve using sequential SSFPs cines. The smallest diastolic regurgitant orifice in mid-diastole is traced. An ARO of 0.28 cm2 has a sensitivity and specificity of 90% and 91%, respectively, in detecting severe aortic regurgitation.13
Conclusion
CMR has emerged as a robust new imaging technique for assessing patients with valvular disease, and it has a number of unique advantages over other imaging modalities. CMR can help determine the mechanism of valve disease, quantify the severity of disease, and discern the consequences of the lesions including the effects on LV volume, LV systolic function, and left atrial volumes. CMR eliminates issues of image quality from inadequate imaging windows or body habitus. In most instances, information can be obtained noninvasively without the need for intravenous contrast agents or ionizing radiation. Low inter-study variability also makes it an optimal technique for serial assessment of valve disease in patients that are managed expectantly.
Funding Statement
Funding/Support: Dr. Shah receives research grant funding through Siemens Medical Solutions.
Footnotes
Conflict of Interest Disclosure: All authors have completed and submitted the Methodist DeBakey Cardiovascular Journal Conflict of Interest Statement and none were reported.
References
- 1.Pennell DJ, Sechtem UP, Higgins CB, Manning WJ, Pohost GM, Rademakers FE, et al. Society for Cardiovascular Magnetic Resonance; Working Group on Cardiovascular Magnetic Resonance of the European Society of Cardiology. Clinical indications for cardiovascular magnetic resonance (CMR): Consensus Panel report. Eur Heart J. 2004 Nov;25(21):1940–65. doi: 10.1016/j.ehj.2004.06.040. [DOI] [PubMed] [Google Scholar]
- 2.Carpentier A. Cardiac valve surgery--the “French correction”. J Thorac Cardiovasc Surg. 1983 Sept;86(3):323–37. [PubMed] [Google Scholar]
- 3.Fedak PW, McCarthy PM, Bonow RO. evolving concepts and technologies in mitral valve repair. Circulation. 2008 Feb 19;117(7):963–74. doi: 10.1161/CIRCULATIONAHA.107.702035. [DOI] [PubMed] [Google Scholar]
- 4.Cawley PJ, Maki JH, Otto CM. Cardiovascular magnetic resonance imaging for valvular heart disease: technique and validation. Circulation. 2009 Jan 27;119(3):468–78. doi: 10.1161/CIRCULATIONAHA.107.742486. [DOI] [PubMed] [Google Scholar]
- 5.Masci PG, Dymarkowski S, Bogaert J. Valvular heart disease: what does cardiovascular MRI add? Eur Radiol. 2008 Feb;18(2):197–208. doi: 10.1007/s00330-007-0731-x. [DOI] [PMC free article] [PubMed] [Google Scholar]
- 6.Dulce MC, Mostbeck GH, O’ Sullivan M, Cheitlin M, Caputo GR, Higgins CB. Severity of aortic regurgitation: understudy reproducibility of measurements with velocity-encoded cine MR imaging. Radiology. 1992 Oct;185(1):235–40. doi: 10.1148/radiology.185.1.1523315. [DOI] [PubMed] [Google Scholar]
- 7.Paelinck BP, Van Herck PL, Rodrigus I, Claeys MJ, Laborde JC, Parizel PM, et al. Comparison of magnetic resonance imaging of aortic valve stenosis and aortic root to multimodality imaging for selection of transcatheter aortic valve implantation candidates. Am J Cardiol. 2011 Jul 1;108(1):92–8. doi: 10.1016/j.amjcard.2011.02.348. [DOI] [PubMed] [Google Scholar]
- 8.Kilner PJ, Mohiaddin RH. Magnetic resonance jet velocity mapping in mitral and aortic valve stenosis. Circulation. 1993 Apr;87(4):1239–48. doi: 10.1161/01.cir.87.4.1239. [DOI] [PubMed] [Google Scholar]
- 9.Seitz J, Wild T. Quantification of blood flow in the carotid arteries: comparison of Doppler ultrasound and three different phase contrast magnetic resonance imaging sequences. Invest Radiol. 2001 Nov;36(11):642–7. doi: 10.1097/00004424-200111000-00003. [DOI] [PubMed] [Google Scholar]
- 10.Cawley PJ, Hamilton-Craig C, Owens DS, Krieger EV, Strugnell WE, Mitsumori L, et al. Prospective comparison of valve regurgitation quantitation by cardiac magnetic resonance imaging and transthoracic echocardiography. Circ Cardiovasc Imaging. 2013 Jan 1;6(1):48–57. doi: 10.1161/CIRCIMAGING.112.975623. [DOI] [PubMed] [Google Scholar]
- 11.Globits S, Mayr H, Frank H, Neuhold A, Glogar D. Quantification of regurgitant lesions by MRI. Int J Card Imaging. 1990-1991;6(2):109–16. doi: 10.1007/BF02398894. [DOI] [PubMed] [Google Scholar]
- 12.Chai P, Mohiaddin R. How do we perform cardiovascular magnetic resonance flow assessment using phase contrast velocity mapping. JCMR. 2005;7:705–16. doi: 10.1081/jcmr-65639. [DOI] [PubMed] [Google Scholar]
- 13.Debl K, Djavidani B, Buchner S, Heinicke N, Fredersdorf S, Haimerl J, et al. Assessment of the anatomical regurgitant orifice in aortic regurgitation: a clinical magnetic resonance study. Heart. 2008 Mar;94(3):e8. doi: 10.1136/hrt.2006.108720. [DOI] [PubMed] [Google Scholar]
- 14.Fujita N, Chazouilleres AF, Hartiala JJ, O’Sullivan M, Heidenreich P, Kaplan JD, et al. Quantification of mitral regurgitation by velocity-encoded cine nuclear magnetic resonance imaging. J Am Coll Cardiol. 1994 Mar 15;23(4):951–8. doi: 10.1016/0735-1097(94)90642-4. [DOI] [PubMed] [Google Scholar]
- 15.Hundley WG, Li HF, Willard JE, Landau C, Lange RA, Meshack BM, et al. Magnetic resonance imaging assessment of the severity of mitral regurgitation. Comparison with invasive techniques. Circulation. 1995 Sep 1;92(5):1151–8. doi: 10.1161/01.cir.92.5.1151. [DOI] [PubMed] [Google Scholar]
- 16.Kon MW, Myerson SG, Moat NE, Pennell DJ. Quantification of regurgitant fraction in mitral regurgitation by cardiovascular magnetic resonance: comparison of techniques. J Heart Valve Dis. 2004 Jul;13(4):600–7. [PubMed] [Google Scholar]
- 17.Kizilbash AM, Handley WG, Willett DL, Franco F, Peshock RM, Grayburn PA. Comparison of quantitative Doppler with magnetic resonance imaging for assessment of the severity of mitral regurgitation. Am J Cardiol. 1998 Mar 15;81(6):792–5. doi: 10.1016/s0002-9149(97)01024-2. [DOI] [PubMed] [Google Scholar]
- 18.Kilner PJ, Manzara CC, Mohiaddin RH, Pennell DJ, Sutton MG, Firmin DN, et al. Magnetic resonance jet velocity mapping in mitral and aortic valve stenosis. Circulation. 1993 Apr;87(4):1239–48. doi: 10.1161/01.cir.87.4.1239. [DOI] [PubMed] [Google Scholar]
- 19.Caruthers SD, Lin SJ, Brown P, Watkins MP, Williams TA, Lehr KA, et al. Practical value of cardiac magnetic resonance imaging for clinical quantification of aortic valve stenosis: comparison with echocardiography. Circulation. 2003 Nov 4;108(18):2236–43. doi: 10.1161/01.CIR.0000095268.47282.A1. [DOI] [PubMed] [Google Scholar]
- 20.John AS, Dill T, Brandt RR, Rau M, Ricken W, Bachmann G, et al. Magnetic resonance to assess the aortic valve area in aortic stenosis: how does it compare to current diagnostic standards? J Am Coll Cardiol. 2003 Aug 6;42(3):519–26. doi: 10.1016/s0735-1097(03)00707-1. [DOI] [PubMed] [Google Scholar]
- 21.Reant P, Lederlin M, Lafitte S, Serri K, Montaudon M, Corneloup O, et al. Absolute assessment of aortic valve stenosis by planimetry using cardiovascular magnetic resonance imaging: comparison with transesophageal echocardiography, transthoracic echocardiography, and cardiac catheterisation. Eur J Radiol. 2006 Aug;59(2):276–83. doi: 10.1016/j.ejrad.2006.02.011. [DOI] [PubMed] [Google Scholar]
- 22.Globits S, Mayr H, Frank H, Neuhold A, Glogar D. Quantification of regurgitant lesions by MRI. Int J Card Imaging. 1990-1991;6(2):109–16. doi: 10.1007/BF02398894. [DOI] [PubMed] [Google Scholar]
- 23.Søndergaard L, Lindvig K, Hildebrandt P, Thomsen C, Ståhlberg F, Joen T, et al. Quantification of aortic regurgitation by magnetic resonance velocity mapping. Am Heart J. 1993 Apr;125(4):1081–90. doi: 10.1016/0002-8703(93)90117-r. [DOI] [PubMed] [Google Scholar]
- 24.Ley S, Eichhorn J, Ley-Zaporozhan J, Ulmer H, Schenk JP, Kauczor HU, et al. Evaluation of aortic regurgitation in congenital heart disease: value of MR imaging in comparison to echocardiography. Pediatr Radiol. 2007 May;37(5):426–36. doi: 10.1007/s00247-007-0414-4. [DOI] [PubMed] [Google Scholar]


