Abstract
A sensitive method was developed and validated for the measurement of 17-(allylamino)-17-demethoxygeldanamycin (17AAG) and its active metabolite 17-amino-17-demethoxygeldanamycin (17AG) in human plasma using 17-(dimethylaminoethylamino)-17-demethoxygeldanamycin (17DMAG) as an internal standard. After the addition of internal standard, 200 µL of plasma was extracted using ice cold acetonitrile followed by analysis on a Thermo Finnigan triple-quadruple mass spectrometer coupled to an Agilent 1100 HPLC system. Chromatography was carried out on a 50 × 2.1 mm Agilent Zorbax SB-phenyl 5 µm column coupled to a 3mm Varian metaguard diphenyl pre-column using glacial acetic acid 0.1% and a gradient of acetonitrile and water at a flow rate of 500 µL/min. Atmospheric pressure chemical ionization and detection of 17AAG, 17AG and 17DMAG were accomplished using selected reaction monitoring of m/z 584.3 > 541.3, 544.2 > 501.2, and 615.3 >572.3 respectively in negative ion mode. Retention times for 17AAG, 17AG, and 17DMAG were 4.1, 3.5, and 2.9 minutes, respectively, with a total run time of 7 minutes. The assay was linear over the range 0.5–3000 ng/mL for 17AAG and 17AG. Replicate sample analysis indicated within- and between-run accuracy and precision within 15%. The recovery of 17AAG and 17AG from 200 µL of plasma containing 1, 25, 300, and 2500 ng/mL was 93% or greater. This high performance liquid chromatographic tandem mass spectroscopy (HPLC/MS/MS) method is superior to previous methods. It is the first analytical method reported to date for the quantitation of both 17AAG and its metabolite 17AG and can reliably quantitate concentrations of both compounds as low as 0.5 ng/mL.
1. Introduction
Heat shock protein 90 (Hsp90) is an ATP dependent molecular chaperone critical for the folding assembly, intracellular transport, and activity of multiple cellular proteins including numerous oncogenic proteins [1]. Hsp90 functions as a dimer and binds to an Hsp70-Hsp40-(client protein) bound complex through the intermediary Hop to form a heterocomplex. [2] ATP binds to this heterocomplex resulting in the transfer of the client protein to Hsp90 and the subsequent release of Hsp70-Hsp40 and Hop. This substrate-Hsp90 complex is stabilized by p23 and, upon ATP hydrolysis, the properly folded mature client protein is released and capable of activating specific signaling pathways. Hsp90 is an abundant protein representing 1–2% of all cytosolic proteins, but is a selective target for cancer therapy. [3] In tumor cells, Hsp90 is present in an activated multi-chaperone complex with high ATPase activity, whereas in normal tissues, Hsp90 is present in an inactive uncomplexed form with low ATPase activity.[4] The ATP-binding site of Hsp90 is required for its function and occupation of this site inhibits the protein’s conformational refolding reactions resulting in substrate degradation through the ubiquitin-proteasome system. [5]
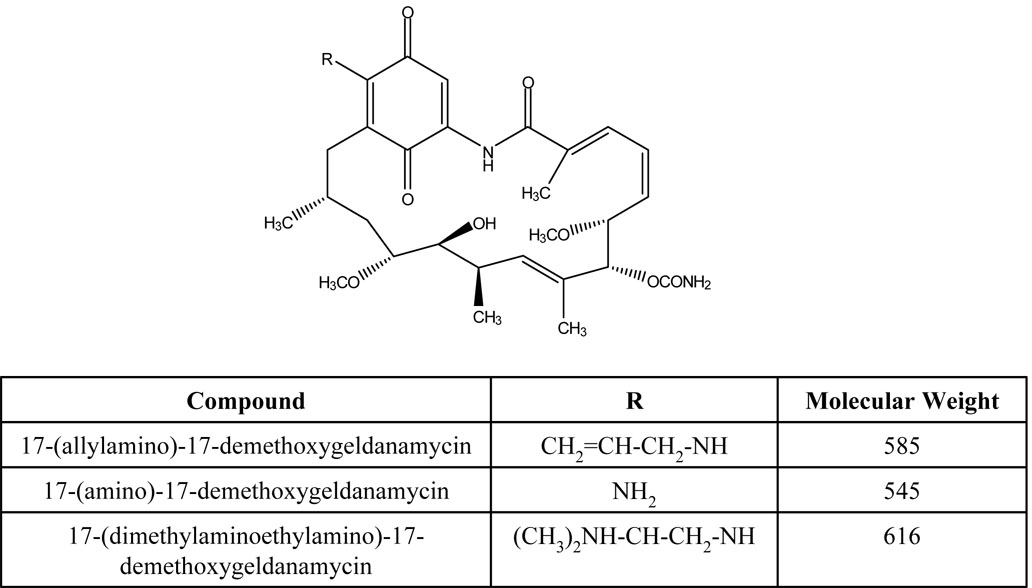
Benzoquinone ansamyacins such as geldanamycin are naturally occurring products produced by yeast that are capable of binding Hsp90 resulting in anti-tumor effects.[6,7] However, due to toxicity, geldanamycin was dropped from development and replaced with the less toxic geldanamycin analog 17-(allylamino)-17-demethoxygeldanamycin (17AAG) (Fig. 1) [8,9]. The cytochrome P450 isoform CYP3A4 metabolizes 17AAG to 17-amino-17-demethoxygeldanamycin (17AG) (Fig. 1) through the oxidative loss of the 17-allyl group from the ansamycin ring [10,11]. Both 17AAG and 17AG bind to and occupy the ATP-binding pocket of HSP90 preventing activity and resulting in client protein degradation [5]. 17AAG and 17AG bind to tumor Hsp90 with a 100-fold higher binding affinity compared to Hsp90 from normal cells [4]. Numerous Phase 1 and Phase II clinical trials involving 17-AAG as a single agent or in combination with other agents are currently ongoing [10,12–19].
Figure 1.
Structures of 17-(allylamino)-17-demethoxygeldanamycin (17AAG), its active metabolite 17-amino-17-demethoxygeldanamycin (17AG), and internal standard 17-(dimethylaminoethylamino)-17-demethoxygeldanamycin (17DMAG).
The objective of this study was to develop a validated, simple, rapid, sensitive, and specific LC/MS/MS analytical method for simultaneous measurement of 17AAG and its active metabolite 17AG in human plasma. Other analytical methods exist for the measurement of 17-AAG in human plasma, but to our knowledge this is the first validated LC/MS/MS method that measures both 17AAG and 17-AG in human plasma [11,20]. We developed this [21] method in conjunction with several ongoing phase I clinical trials and it has a lower limit of quantitation for both 17AAG and 17AG of 500 pg/mL.
2. Experimental
2.1 Solvents and chemicals
17AAG, 17AG, and 17-DMAG as a pure powder were all obtained from the National Cancer Institute (NCI) and used as received. Acetonitrile, DMSO, and water (HPLC grade) were purchased from Fisher Scientific. Analytical grade glacial acetic acid was obtained from Mallinckrodt Baker Inc. (Paris, KY, USA).
2.2 Standards
Stock solutions (1 mg/mL in DMSO) of 17-AAG, 17-AG, and 17-DMAG (IS) were prepared in 100 µL single use aliquots and stored at −80°C. Plasma calibration standards were prepared by adding different serial diluted stock solutions (in plasma) to give 200 µL of 0.1, 0.5, 1, 3, 25, 100, 300, 1000, and 3000 ng/mL of 17AAG and 17-AG in plasma. 20 µL of 2.5 µg/mL of 17-DMAG was added as internal standard to individual samples.
2.3 Instrumentation
Reconstituted samples were analyzed on an Agilent (Santa Clara, CA) 1100 HPLC system connected to a ThermoFisher TSQ Quantum Discovery Max mass spectrometer operated by LCQuan software. The HPLC system consisted of a G1312A dual pump with static mixer, a degasser, a heated column compartment and a G1313A well-plate autosampler.
2.4 Sample preparation
Standards and patient samples were prepared and processed in 1.5 mL eppendorf tubes (Sarstedt, Newton, NC). This procedure was validated by spiking human plasma with known concentrations of 17AAG and 17AG followed by internal standard 17DMAG (Fig. 1). Pooled human plasma was obtained from the local American Red Cross and stored frozen in aliquots at −80°C. Protein precipitation of 17AAG, 17AG, and 17DMAG was carried out by addition of ice cold acetonitrile. Acetonitrile (580 µl) was added to 220 µl of spiked human plasma. The sample was then vortexed and subsequently centrifuged on 18,000 rcf at 4°C for 10 minutes. The resulting supernatant (500 µL) was removed and added to 500 µL of HPLC grade water. The mixture was vortexed and 20 µL was injected for all calibration levels.
2.5 Chromatographic and mass spectrometer conditions
17AAG, 17AG, and 17DMAG were separated on a 50 × 2.1 mm Agilent Zorbax SB-phenyl 5 µm column (Agilent; Santa Clara, CA, USA) coupled to a 3mm Varian metaguard diphenyl pre-column (Varian Inc., Lake Forest, CA). The chromatography was performed at 40°C. The mobile phase consisted of water containing 0.1% (v/v) acetic acid as solvent A and acetonitrile containing 0.1% (v/v) acetic acid as solvent B. The components were eluted with a gradient system initially from 20% B to 85% B in 3 min, 1 minute at 95% B, 95% B to 20% B in 3 minutes and 3 minutes of equilibration at 20% B. The flow rate was 0.5 mL/min.
2.6. Validation
2.6.1 Selectivity
Plasma from pooled human donors whose medication status was unknown was extracted and analyzed for the assessment of potential interferences with endogenous substances.
2.6.2 Accuracy and precision
To validate the method, intra-day accuracy and precision for 17AAG and 17AG was evaluated at 1, 50, 800, and 2200 ng/mL. These concentrations were selected to cover the entire range of the calibration curve. Analysis was done by preparing five samples at each concentration level and concentrations were calculated from calibration curves. The between-day accuracy and precision was determined by 3 repetitions of the intra-day assay.
2.6.3 Recovery
The recovery of 17AAG and 17AG was performed by spiking 200 µL of plasma or 50% acetonitrile (unextracted samples) at four different concentration levels (1, 25, 300, and 2500 ng/mL). Plasma samples and unextracted samples were processed identically (see sample preparation) with the exception that for the unextracted samples all solvents were replaced with 50% acetonitrile. After processing an equal amount of IS was added to each sample and 20 µL was injected. The recovery was estimated by comparing the ratio of parent compound to internal standard of the extracted samples to the ratio of parent compound to internal standard of the unextracted samples at each concentration level. The analysis was performed in pentupulate and the mean value was reported.
2.6.4 Freeze/thaw analysis
Analyte stability was determined after three freeze-thaw cycles following storage at −80°C. Pentupulate analysis at four separate concentration levels (1, 50, 800, and 2200 ng/mL) was performed. Samples were thawed unassisted at room temperature. When completely thawed, the samples were refrozen at −80°C for 24 hours. This freeze-thaw cycle was repeated two additional times and the samples were analyzed on the third cycle. All determinations were made by comparing the freeze-thaw samples to samples prepared from freshly-made stock solutions.
2.6.5 Calibration and sample quantification
Linearity was evaluated by preparation of a single calibration curve in the range of 0.1–3000 ng/mL. Standard concentrations were 0.1, 0.5, 1, 3, 25, 100, 300, 1000, and 3000 ng/mL of 17AAG and 17-AG. The analysis was done using 17DMAG as the internal standard and the ratio of parent compound to internal standard was plotted against concentration per milliliter of plasma. The calibration curve was linearly fitted and weighted by 1/concentration. Concentrations of 17AAG and 17AG were calculated from this calibration curve.
2.6.6 Stability
2.6.6.1 Storage Stability
The stability of 17AAG and 17AG at −80°C was investigated at 0, 30 and 60 days using spiked plasma samples at four different concentrations (1, 50, 800, and 2200 ng/mL). Five aliquots at each concentration were thawed and analyzed at 30 and 60 days by comparison to a freshly prepared calibration curve.
2.6.6.2 Bench stability
The stability of 17AAG and 17AG in plasma at room temperature was investigated at 0, 1, 3, 24, and 48 hrs. Four separate concentrations (1, 25, 300, and 2500 ng/mL) were prepared in pentupulate and kept at room temperature. At each appropriate time the samples were processed and analyzed by comparison to a freshly prepared calibration curve.
2.6.6.3. Autoinjector stability
Stability of the samples in the autoinjector was carried out over a 24 hour period. A calibration curve and five samples per concentration level (1, 50, 800, and 2200 ng/mL) were prepared. The calibration curve was run first followed by injections of the same samples every four hours for 24 hours. The mean ratio of drug/IS over the 24 hour period was compared to the calibration curve.
3. Results
3.1 Mass spectral analysis
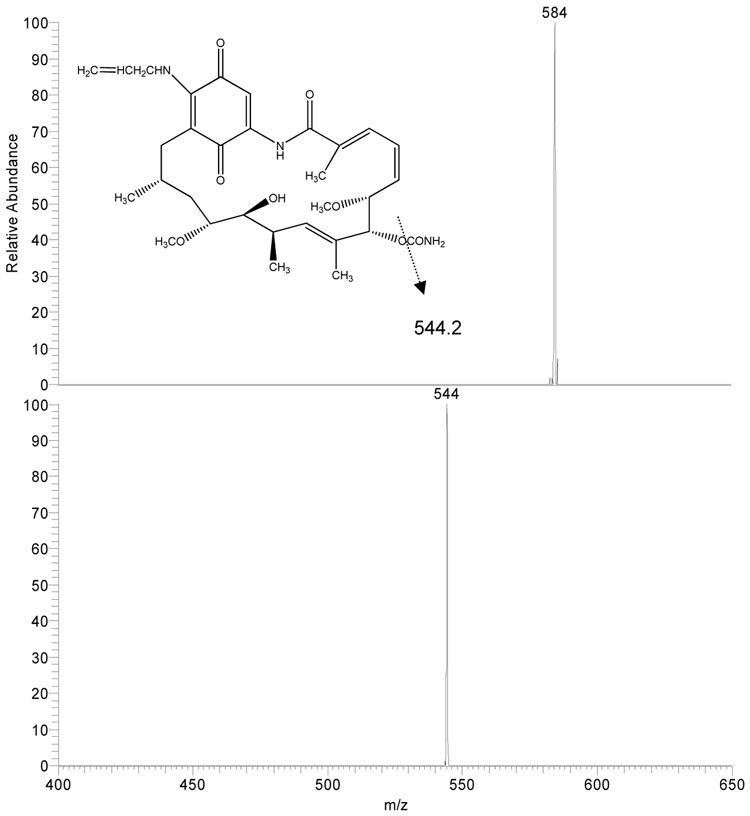
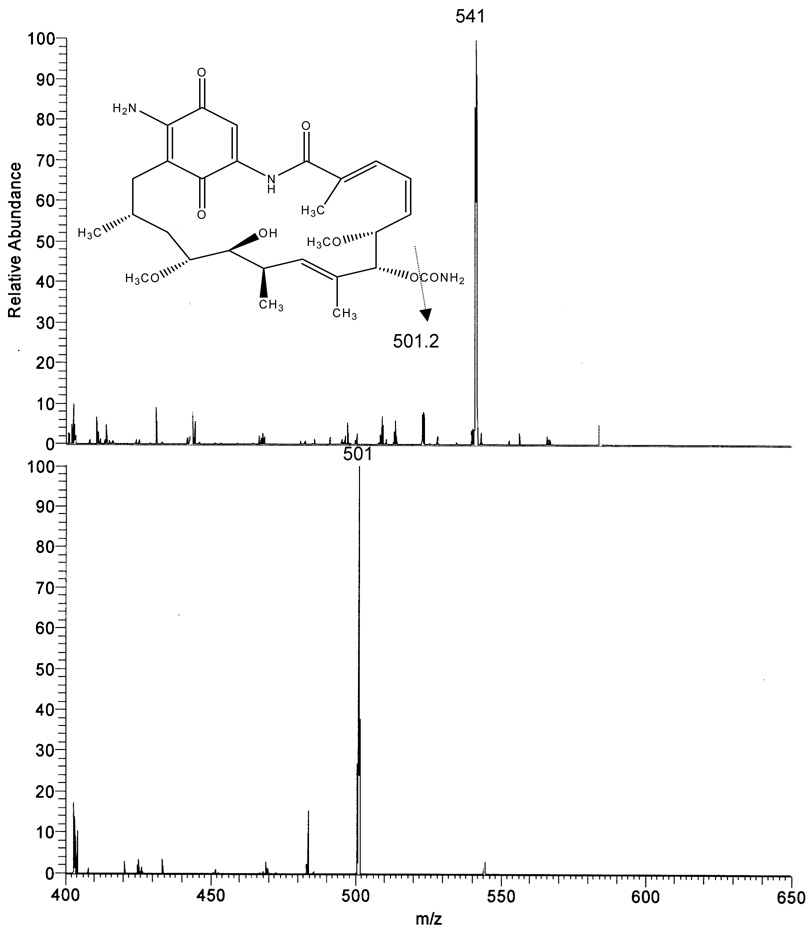
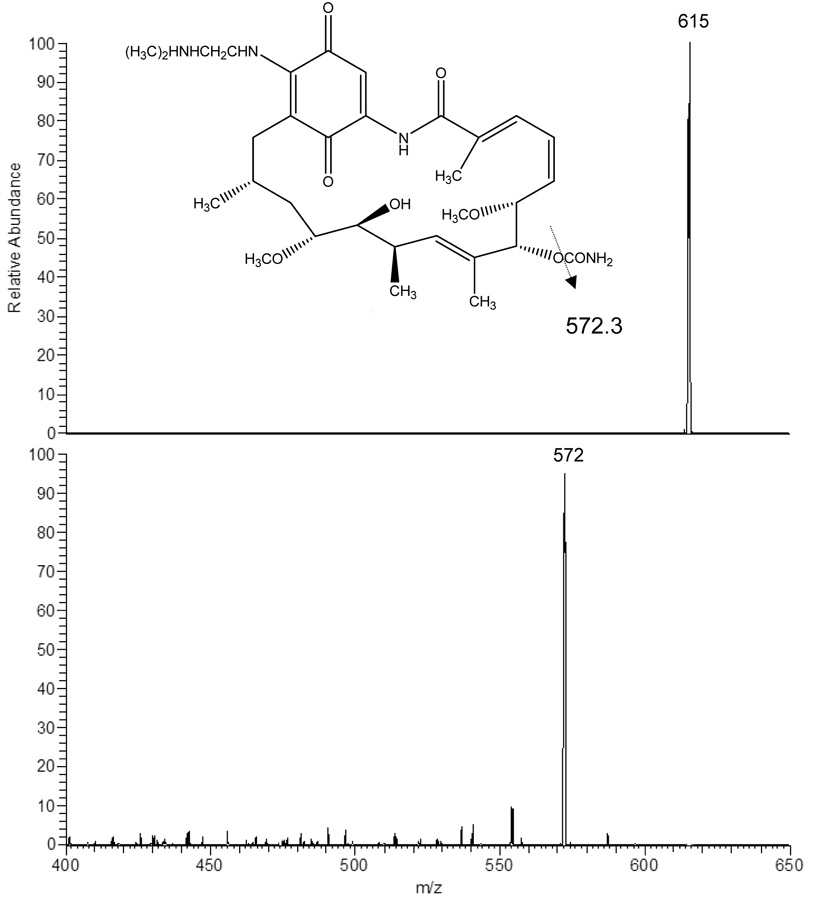
Using negative ion mode and APCI conditions 17AAG gave MH− at m/z 584.3 as the base ion (Fig 2A). This ion was selected for collision induced dissociation (CID) experiments which generated one major product ion at m/z 541.3 representing the cleavage of the CONH2 group from the ring. 17AG gave MH− at m/z 544.2 as the base ion (Fig 2B). This ion was selected for collision induced dissociation (CID) experiments which generated one major product ion at m/z 501.2 again representing the cleavage of the CONH2 group from the ring. The internal standard 17DMAG gave MH− at m/z 615.3 as the base ion (Fig 2C). This ion was selected for collision induced dissociation (CID) experiments which generated one major product ion at m/z 572.3 representing the same group loss as 17AAG and 17AG. The analysis conditions were optimized for 17AAG in SRM mode using precursor/product ion pair at m/z 584.3/541.3 for quantitation. Using the same analysis conditions, the precursor/product ion pairs at 544.2/501.2 and 615.3/572.3 were selected in SRM mode for analysis of 17AG and 17DMAG, respectively.
Figure 2.
Atmospheric pressure chemical ionization mass spectrum of 17AAG (2A), 17AG (2B), and 17DMAG (2C) accompanied by the collision induced dissociation mass spectrum of each compound (below parent). The inset represents the proposed fragmentation.
3.2. Separation and relative retention time
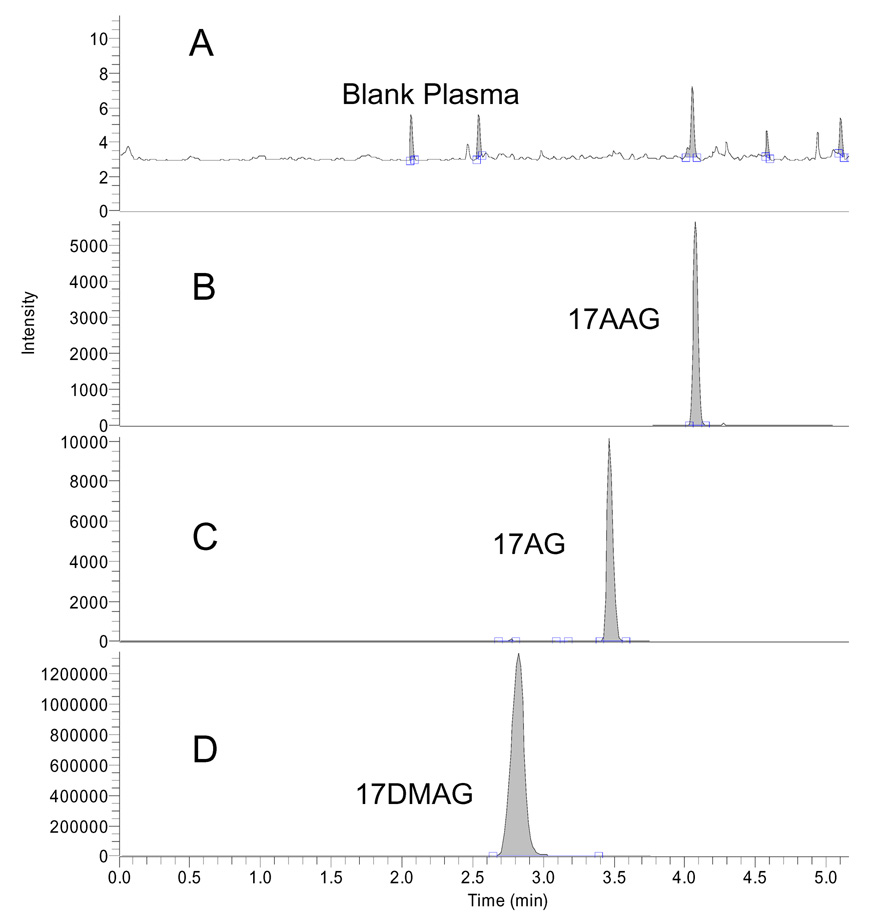
Retention times for 17AAG, 17AG, and 17DMAG were 4.1, 3.5, and 2.9 minutes respectively. The run time was 7 minutes. Blank plasma contained no interfering endogenous substances. Representative chromatograms are shown in Fig 3. Figure 3A shows a representative chromatogram of blank plasma whereas 3B shows 17AAG (0.5 ng/mL), 3C shows 17AG (0.5 ng/mL) and 3D shows 17DMAG at a concentrations of 250 ng/mL.
Figure 3.
Chromatograms of 20 µL injection of blank human plasma (A), 17AAG (0.5 ng/mL) and 17AG (0.5 ng/mL) (B) and 17DMAG (IS) (250 ng/mL) (C)
3.3. Linearity
17AAG and 17AG linearity was examined by analyzing calibration curves containing 7 standard concentrations of 17AAG and 17AG (0.5, 1, 3, 25, 100, 300, 1000, and 3000 ng/mL) over several months using weighted (1/concentration) linear regression. The results from 5 separate days are presented in Table 1 and were calculated using peak area ratios. Correlation coefficients from each curve were greater or equal to 0.998. The accuracy of the calibration curves is presented in Table 2 demonstrating that the measured concentration is within 15% of the actual concentration. The lower limit of quantitation was determined by the lowest standard with a signal to noise ratio of at least 5:1, a precision of at least 20% and an accuracy of 80–120% [21]. The 0.5 ng/mL concentration met these criteria for both 17AAG and 17AG. The average signal to noise ratio of both 17AAG and 17AG from 5 separate standard curves was > 1000:1. For 17AAG at a concentration of 0.5 ng/mL, the mean back calculated concentration was 0.505 ng/mL with a standard deviation of 0.10 ng/mL and a coefficient of variation of 19.8%. The deviation of mean value from nominal was 0.92%. For 17AG at a concentration of 0.5 ng/mL, the mean back calculated concentration was 0.489 ng/mL with a standard deviation of 0.016 ng/mL and a coefficient of variation of 3.3%. The deviation of mean value from nominal was −2.3%.
Table 1.
Assay linearity of method (n=5)
| Drug | Slope | y-intercept | Coefficient of correlation |
|---|---|---|---|
| 17-AAG | |||
| Calibration mean | 0.0080199 | −0.001364 | 0.9986 |
| 17-AG | |||
| Calibration mean | 0.005448 | 0.001781 | 0.9983 |
Results were calculated using peak area ratios. Calibration curves for 17-AAG were linear using weighted (1/concentration) linear regression in the concentration range of 0.1–3000 ng/mL.
Table 2.
Back calculated concentration from calibration curves (n=5)
| Nominal concentration (ng/mL) | 17-AAG Accuracy (%) | 17-AG Accuracy (%) |
|---|---|---|
| 0.5 | 100.9 | 97.7 |
| 1 | 95.0 | 91.9 |
| 3 | 87.9 | 95.6 |
| 25 | 92.0 | 94.2 |
| 100 | 94.6 | 90.6 |
| 300 | 94.9 | 94.2 |
| 1000 | 100.4 | 96.9 |
| 3000 | 101.6 | 102.0 |
Accuracy: 100% measured concentration/nominal concentration
Since patients would also be receiving bortezomib in the clinical trial, the effect of bortezomib in the assay was tested. Standard curves were prepared with (100 ng/mL) bortezomib and without bortezomib. The 100 ng/mL represents the approximate the peak plasma concentration reported for patients receiving 1.45 mg/m2 of bortezomib (patients in the current study received 0.7 mg/m2 of bortezomib) [22]. There was no interference from bortezomib and the standard curves overlapped with almost identical slopes and intercepts.
3.4 Recovery data
Absolute recovery of 17AAG and 17AG from plasma was compared to unextracted samples. The recovery of AAG from 200 µL of plasma containing 1, 25, 300, and 2500 ng/mL was 92.8%, 101.4%, 100.1%, and 96.4% respectively (n=5). The recovery of AG from 200 µL of plasma containing 1, 25, 300, and 2500 ng/mL was 93.2%, 101.4%, 101.5%, and 99.4% respectively (n=5). The recovery of DMAG from 200 µL of plasma containing 250 ng/mL was 104%
3.5 Accuracy and precision
The intra-day coefficients of variation for 17AAG samples (1, 50, 800, 2200 ng/mL) were 8.2%, 3.1%, 3.7% and 0.5%, and for 17AG samples (1, 50, 800, 2200 ng/mL) the results were 6.9%, 2.0%, 2.5% and 2.1%, respectively. Coefficients of variation of inter-day analysis of 17AAG samples (1, 50, 800, 2200 ng/mL) were 7.9%, 11.0%, 4.2% and 4.5%, and for 17AG (1, 50, 800, 2200 ng/mL) were 8.3%, 10.4%, 2.7% and 4.3%, respectively. The data obtained both for the 17AAG and 17AG adhered to guidelines for bioanalytical method validation [21]. Data for accuracy and precision are shown in Table 3.
Table 3.
Intra-day and inter-day precision and accuracy for 17-AAG and 17-AG in human plasma
| Theoretical concentration | 1 | 50 | 800 | 2200 |
|---|---|---|---|---|
| 17-AAG (ng/mL) | ||||
| Intra-day run | ||||
| Overall mean (n=5) | 0.928 | 47.3 | 818.5 | 2178.2 |
| S.D. | 0.07 | 1.6 | 24.8 | 29.5 |
| CV (%) | 7.5 | 3.4 | 3.0 | 1.4 |
| DMT (%) | −7.2 | −5.4 | 2.3 | −1.0 |
| Inter-day run | ||||
| Overall mean (n=15) | 0.927 | 49.5 | 837.7 | 2177.3 |
| S.D. | 0.074 | 5.4 | 35.0 | 98.8 |
| CV (%) | 7.9 | 11.0 | 4.2 | 4.5 |
| DMT (%) | −7.3 | −1.0 | 4.7 | −1.0 |
| 17-AG (ng/mL) | ||||
| Intra-day run | ||||
| Overall mean (n=5) | 0.941 | 48.1 | 837.9 | 2139.5 |
| S.D. | 0.06 | 0.94 | 21.0 | 44.3 |
| CV (%) | 6.86 | 1.96 | 2.51 | 2.07 |
| DMT (%) | −5.81 | −3.69 | 4.75 | −2.75 |
| Inter-day run | ||||
| Overall mean (n=15) | 0.980 | 49.8 | 827.0 | 2233.0 |
| S.D. | 0.082 | 5.2 | 22.4 | 95.2 |
| CV (%) | 8.33 | 10.44 | 2.71 | 4.26 |
| DMT (%) | −2.0 | −0.31 | 3.4 | 1.5 |
S.D., standard deviation; CV, coefficient of variation; DMT, deviation of mean value from nominal.
3.6. Storage stability data at −80C
The stability of 17AAG and 17AG at −80°C was evaluated in human plasma to establish optimal storage conditions for clinical samples. Incubation of 17AAG and 17AG at −80°C for 30 and 60 days prior to extraction resulted in no discernable difference as compared to freshly prepared samples. The coefficient of variation for AAG and AG ranged from 0.7% to 8.4% and 1.8% to 3.6%, respectively. Percent recovery ranged from 92.4% to 97.4% and 93.3% to 104.1% for AAG and AG respectively. Storage stability data for 17AAG and 17AG are presented in Table 4.
Table 4.
Stability data for 17-AAG and 17-AG at −80°C
| 17-AAG | 30 Days | 60 Days | ||||||
|---|---|---|---|---|---|---|---|---|
| Concentration (ng/mL) | 1 | 50 | 800 | 2200 | 1 | 50 | 800 | 2200 |
| Overall mean (n=5) | 0.991 | 44.8 | 837.0 | 2223.2 | 1.12 | 50.8 | 922.3 | 2452.7 |
| S.D. | 0.095 | 1.07 | 63.2 | 46.2 | 0.08 | 3.44 | 36.3 | 71.1 |
| CV (%) | 9.57 | 2.38 | 7.56 | 2.08 | 7.56 | 6.77 | 3.94 | 2.90 |
| Recovery (%) | 99.1 | 89.6 | 104.6 | 101.1 | 112.0 | 101.6 | 115.2 | 111.5 |
| 17-AG | ||||||||
| Overall mean (n=5) | 0.96 | 46.2 | 763.8 | 2143.3 | 0.93 | 46.6 | 828.0 | 2289.8 |
| S.D. | 0.08 | 0.32 | 18.3 | 50.4 | 0.03 | 1.3 | 15.3 | 73.9 |
| CV (%) | 8.41 | 0.70 | 2.39 | 2.35 | 3.6 | 2.9 | 1.8 | 3.2 |
| Recovery (%) | 96.1 | 92.4 | 95.5 | 97.4 | 93.4 | 93.3 | 103.5 | 104.1 |
The long term stability of 17-AAG at −80°C. Samples should be stored at −80°C.
3.7. Autoinjector stability
Stability of samples (1, 50, 800, 2200 ng/mL) stored in the autoinjector over a period of 24 hours was evaluated by injecting the same samples every 4 hours for 24 hours. The coefficient of variation ranged from 3.5% to 10.3% and 4.5% to 6.2% for AAG and AG respectively. The calculated concentration was within ± 10% and ± 11% of the nominal concentration for AAG and AG, respectively. The results demonstrate that the samples were stable in the autosampler for up to 24 hours. Results are shown in Table 5.
Table 5.
Autoinjector stability data for extracted 17-AAG and 17-AG samples over 24 hours in 50%ACN
| Theoretical Concentration (ng/mL) |
||||
|---|---|---|---|---|
| 17-AAG | 1 | 50 | 800 | 2200 |
| Overall mean (n=6) | 0.90 | 48.6 | 892.1 | 2349.6 |
| S.D. | 0.092 | 2.0 | 38.6 | 83.4 |
| CV (%) | 10.3 | 4.2 | 4.3 | 3.5 |
| Recovery (%) | 90.0 | 97.3 | 111.5 | 106.8 |
| 17-AG | ||||
| Overall mean (n=6) | 1.11 | 45.86 | 788.18 | 2419.56 |
| S.D. | 0.07 | 2.82 | 47.59 | 108.56 |
| CV (%) | 6.04 | 6.16 | 6.04 | 4.49 |
| Recovery (%) | 110.9 | 91.7 | 98.5 | 110.0 |
Stability of the samples stored in the autoinjector was carried out over a period of 24 hours by injecting the same sample at an interval of 4 hours.
3.8. Freeze/thaw analyis
To assess the stability of 17AAG and 17AG under freeze-thaw conditions, four separate concentrations (1, 50, 800, and 2200 ng/mL) were analyzed after being subjected to 3 separate freeze-thaw cycles. Both compounds were stable after 3 freeze-thaw cycles. The coefficient of variation was less than 15% for all measured concentrations of both 17AAG and 17AG. In addition, the measured concentrations were within 15% of the expected concentrations for both 17AAG and 17AG. The data is shown in Table 6.
Table 6.
Freeze thaw precision and accuracy for 17AAG and 17AG in human plasma
| Theoretical Concentration (ng/mL) |
|||||
|---|---|---|---|---|---|
| 1 | 50 | 800 | 2200 | ||
| 17AAG | |||||
| Mean (n=5) | 1.03 | 47.26 | 823.90 | 2290.74 | |
| S.D. | 0.04 | 0.56 | 10.07 | 109.04 | |
| CV (%) | 3.53 | 1.19 | 1.22 | 4.76 | |
| DMT (%) | 2.68 | −5.47 | 2.99 | 4.12 | |
| 17AG | |||||
| Mean (n=5) | 0.970 | 42.54 | 751.8 | 2122.7 | |
| S.D. | 0.14 | 0.65 | 18.3 | 240.4 | |
| CV (%) | 14.1 | 1.53 | 2.44 | 11.3 | |
| DMT (%) | −3.04 | −14.9 | −6.02 | −3.51 | |
3.9. Bench stability
Plasma samples at four concentration levels were kept at room temperature for 1, 3, 24, or 48 hours. At the indicated time points the samples were extracted and analyzed by comparison to freshly prepared standard curves. 17AAG and 17AG are stable in human plasma for up to 48 hours when kept at room temperature. The calculated concentrations ranged from 95%–112% of expected concentration as determined from the standard curve. The data is shown in Table 7.
Table 7.
Bench stability for 17-AAG and 17-AG in human plasma at room temperature (n=5)
| % Theoretical concentration (ng/mL) |
||||
|---|---|---|---|---|
| 17-AAG | 1.0 | 25 | 300 | 2500 |
| 0 hrs | 100 | 100 | 100 | 100 |
| 1 hrs | 111.7 | 97.2 | 91.2 | 108.6 |
| 3 hrs | 111.0 | 102.7 | 94.5 | 104.4 |
| 24 hrs | 100.0 | 89.2 | 108.7 | 102.5 |
| 48 hrs | 112.7 | 107.5 | 98.0 | 103.4 |
| 17-AG | ||||
| 0 hrs | 100 | 100 | 100 | 100 |
| 1 hrs | 107.5 | 98.8 | 105.9 | 106.9 |
| 3 hrs | 111.1 | 102.9 | 104.6 | 106.8 |
| 24 hrs | 100.8 | 96.9 | 99.9 | 99.7 |
| 48 hrs | 98.5 | 94.9 | 98.7 | 97.8 |
Values presented are percent control (time = 0 hr) (n=5)
3.10. Application to clinical sample analysis
The method was applied to a clinical study of 17AAG in combination with bortezomib for treating patients with relapsed or refractory hematologic cancer. A one hour infusion of 150 mg/m2 of 17AAG was administered to 8 patients with acute myeloid leukemia (AML). 17AAG was admistered on days 1, 4, 8, and 11 of a 21 day cycle. Patients with evidence of an objective response may continue therapy for up to 12 cycles. Twelve samples were collected per patient over a 48 hour period and analyzed using the described method. Patient samples were run with 8 calibration levels and 12 QC’s at the start, in the middle and at the end of each run. QC accuracy was within 15% of expected values for both 17AAG and 17AG.
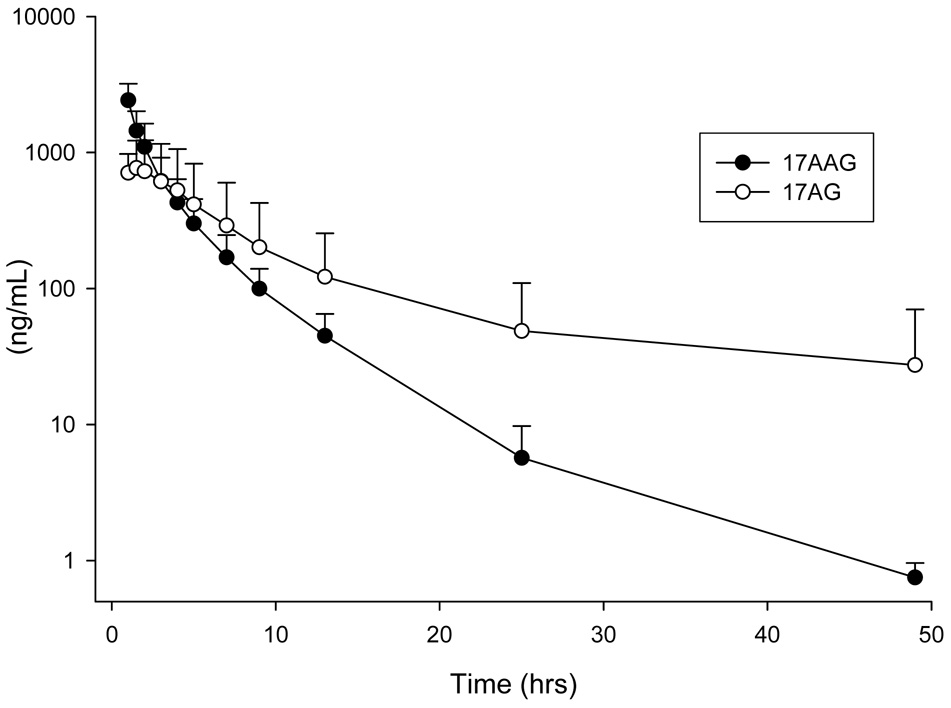
The analyzed data from eight patients was pooled and the plasma concentration versus time profile is presented in Figure 4. Pharmacokinetic parameters were calculated using WinNonlin (Pharsight, Mountain View, California) and noncompartmental analysis. At the dose level of 150 mg/m2 of 17AAG, the mean Cmax, AUC, volume of distribution, and clearance was 2420 ng/mL (standard deviation [SD], 785), 4738 ng mL−1 hr−1 (SD, 1964), 108 L (SD, 38), and 36.4 L/h (SD, 13.7) respectively. The mean Cmax, AUC, volume of distribution, and clearance was 821 ng/mL (SD, 450), 6600 ng mL−1 hr−1 (SD, 6935), 347.0 L (SD, 261.0), and 44.3 L/h (SD, 29.5) for 17AG respectively. Theses values are in line with previously published data [12–15,19,23]. Based on this data and other published results this assay is capable of quantifying 17AAG concentrations at a dose level of 150 mg/m2. Higher dosing levels may require dilution of the first few time points.
Figure 4.
Pooled plasma concentration versus time profiles from 8 patients receiving a 1 hour IV infusion of 150 mg/m2 17AAG.
4. Discussion
Although other methods exist for the measurement of 17AAG, this is the first report of a validated LC/MS/MS method for the simultaneous measurement of 17AAG and its active metabolite 17AG in human plasma. The lower limit of quantitation for both compounds is 0.5 ng/mL which represents a 15-fold increase in sensitivity over current methods. The method is simple, rapid and highly sensitive. Extraction using acetonitrile protein precipitation was performed yielding nearly 100% recoveries of 17AAG, 17AG, and internal standard thus eliminating the need for a complicated extraction procedure. Total run time per sample was 6 minutes and peaks for AAG, AG, and IS resolved at 4.1, 3.5, and 2.9 minutes respectively.
The assay was linear from 0.5 to 3000 ng/mL using pooled human plasma, with regression coefficient (r2)>0.998 for both 17AAG and 17AG after injection of a 20 µL sample. Analysis was performed under negative ion mode and APCI conditions using precursor/product ion pair at m/z 584.3/541.3, 544.2/501.2 and 615.3/572.3 for quantitation of 17AAG, 17AG, and IS (17DMAG). No interfering peaks were present within the run.
The intra and inter-day accuracy and precision were measured at four concentration levels (1, 50, 800, and 2200 ng/mL). The within day precision, expressed as %CV ranged from 1.4 to 7.5% for 17AAG and 2.0–6.9% for 17-AG. The between day precision values ranged from 4.2 to 11.0% for 17-AAG and 2.7 to 10.4% for 17-AG. The accuracy values for the assay varied from 92.8 to 104.7% for 17-AAG and 94.2 to 104.7% for 17-AG.
Numerous stability tests indicated that both 17-AAG and 17-AG were stable under all conditions encountered during processing and analysis. Plasma samples were subjected to a stability study performed at room temperature and at −80°C. Plasma samples containing 17-AAG and 17-AG at four different concentrations were stable up to 48 hours in plasma at room temperature and up to 60 days at −80°C. Repeated freeze-thaw cycles demonstrated that samples could be thawed and refrozen up to 3 times without compromising the integrity of the sample. Finally, the samples were stable in mobile phase for up to 30 hours suggesting that sample degradation would not occur during extended run times.
5. Conclusion
We have developed a sensitive and selective LC/MS/MS method for the quantitation of 17-AAG and its active metabolite 17-AG in human plasma using 17DMAG as the internal standard. The assay has been validated as reproducible and accurate. The extraction process is simple requiring only 200 µL of plasma and run times are relatively short allowing for high sample throughput as compared to previous methods. This LC/MS/MS method has a superior detection limit of 0.5 ng/mL not only for 17AAG but for the active metabolite 17AG as well.
Acknowledgements
This work was supported by grants from the National Cancer Institute U01CA76576 (MRG), CA016058, CA120708, and the College of Pharmacy. We acknowledge the support of Novartis Oncology provided through a CALGB Foundation Junior Faculty Award, PI: Kristie Blum.
Footnotes
Publisher's Disclaimer: This is a PDF file of an unedited manuscript that has been accepted for publication. As a service to our customers we are providing this early version of the manuscript. The manuscript will undergo copyediting, typesetting, and review of the resulting proof before it is published in its final citable form. Please note that during the production process errors may be discovered which could affect the content, and all legal disclaimers that apply to the journal pertain.
References
- 1.Dymock BW, Drysdale MJ, McDonald E, Workman P. Expert Opinion on Therapeutic Patents. 2004;14:837. [Google Scholar]
- 2.Pratt WB, Toft DO. Exp Biol Med (Maywood) 2003;228:111. doi: 10.1177/153537020322800201. [DOI] [PubMed] [Google Scholar]
- 3.Goetz MP, Toft DO, Ames MM, Erlichman C. Ann Oncol. 2003;14:1169. doi: 10.1093/annonc/mdg316. [DOI] [PubMed] [Google Scholar]
- 4.Kamal A, Thao L, Sensintaffar J, Zhang L, Boehm MF, Fritz LC, Burrows FJ. Nature. 2003;425:407. doi: 10.1038/nature01913. [DOI] [PubMed] [Google Scholar]
- 5.Burger AM. Cancer Lett. 2007;245:11. doi: 10.1016/j.canlet.2006.03.012. [DOI] [PubMed] [Google Scholar]
- 6.Whitesell L, Mimnaugh EG, De Costa B, Myers CE, Neckers LM. Proc Natl Acad Sci U S A. 1994;91:8324. doi: 10.1073/pnas.91.18.8324. [DOI] [PMC free article] [PubMed] [Google Scholar]
- 7.DeBoer C, Meulman PA, Wnuk RJ, Peterson DH. J Antibiot (Tokyo) 1970;23:442. doi: 10.7164/antibiotics.23.442. [DOI] [PubMed] [Google Scholar]
- 8.Supko JG, Hickman RL, Grever MR, Malspeis L. Cancer Chemother Pharmacol. 1995;36:305. doi: 10.1007/BF00689048. [DOI] [PubMed] [Google Scholar]
- 9.Schulte TW, Neckers LM. Cancer Chemother Pharmacol. 1998;42:273. doi: 10.1007/s002800050817. [DOI] [PubMed] [Google Scholar]
- 10.Grem JL, Morrison G, Guo XD, Agnew E, Takimoto CH, Thomas R, Szabo E, Grochow L, Grollman F, Hamilton JM, Neckers L, Wilson RH. J Clin Oncol. 2005;23:1885. doi: 10.1200/JCO.2005.12.085. [DOI] [PubMed] [Google Scholar]
- 11.Egorin MJ, Rosen DM, Wolff JH, Callery PS, Musser SM, Eiseman JL. Cancer Res. 1998;58:2385. [PubMed] [Google Scholar]
- 12.Solit DB, Ivy SP, Kopil C, Sikorski R, Morris MJ, Slovin SF, Kelly WK, DeLaCruz A, Curley T, Heller G, Larson S, Schwartz L, Egorin MJ, Rosen N, Scher HI. Clin Cancer Res. 2007;13:1775. doi: 10.1158/1078-0432.CCR-06-1863. [DOI] [PMC free article] [PubMed] [Google Scholar]
- 13.Ronnen EA, Kondagunta GV, Ishill N, Sweeney SM, Deluca JK, Schwartz L, Bacik J, Motzer RJ. Invest New Drugs. 2006;24:543. doi: 10.1007/s10637-006-9208-z. [DOI] [PubMed] [Google Scholar]
- 14.Ramanathan RK, Trump DL, Eiseman JL, Belani CP, Agarwala SS, Zuhowski EG, Lan J, Potter DM, Ivy SP, Ramalingam S, Brufsky AM, Wong MK, Tutchko S, Egorin MJ. Clin Cancer Res. 2005;11:3385. doi: 10.1158/1078-0432.CCR-04-2322. [DOI] [PubMed] [Google Scholar]
- 15.Ramanathan RK, Egorin MJ, Eiseman JL, Ramalingam S, Friedland D, Agarwala SS, Ivy SP, Potter DM, Chatta G, Zuhowski EG, Stoller RG, Naret C, Guo J, Belani CP. Clin Cancer Res. 2007;13:1769. doi: 10.1158/1078-0432.CCR-06-2233. [DOI] [PubMed] [Google Scholar]
- 16.Nowakowski GS, McCollum AK, Ames MM, Mandrekar SJ, Reid JM, Adjei AA, Toft DO, Safgren SL, Erlichman C. Clin Cancer Res. 2006;12:6087. doi: 10.1158/1078-0432.CCR-06-1015. [DOI] [PubMed] [Google Scholar]
- 17.Heath EI, Gaskins M, Pitot HC, Pili R, Tan W, Marschke R, Liu G, Hillman D, Sarkar F, Sheng S, Erlichman C, Ivy P. Clin Prostate Cancer. 2005;4:138. doi: 10.3816/cgc.2005.n.024. [DOI] [PubMed] [Google Scholar]
- 18.Goetz MP, Toft D, Reid J, Ames M, Stensgard B, Safgren S, Adjei AA, Sloan J, Atherton P, Vasile V, Salazaar S, Adjei A, Croghan G, Erlichman C. J Clin Oncol. 2005;23:1078. doi: 10.1200/JCO.2005.09.119. [DOI] [PubMed] [Google Scholar]
- 19.Banerji U, O'Donnell A, Scurr M, Pacey S, Stapleton S, Asad Y, Simmons L, Maloney A, Raynaud F, Campbell M, Walton M, Lakhani S, Kaye S, Workman P, Judson I. J Clin Oncol. 2005;23:4152. doi: 10.1200/JCO.2005.00.612. [DOI] [PubMed] [Google Scholar]
- 20.Agnew EB, Wilson RH, Grem JL, Neckers L, Bi D, Takimoto CH. J Chromatogr B Biomed Sci Appl. 2001;755:237. doi: 10.1016/s0378-4347(01)00113-x. [DOI] [PubMed] [Google Scholar]
- 21.Guidance for Industry, Bioanalytical Method Validation. US Department of Health and Human Services; 2001. May, [Google Scholar]
- 22.Papandreou CN, Daliani DD, Nix D, Yang H, Madden T, Wang X, Pien CS, Millikan RE, Tu SM, Pagliaro L, Kim J, Adams J, Elliott P, Esseltine D, Petrusich A, Dieringer P, Perez C, Logothetis CJ. J Clin Oncol. 2004;22:2108. doi: 10.1200/JCO.2004.02.106. [DOI] [PubMed] [Google Scholar]
- 23.Bagatell R, Gore L, Egorin MJ, Ho R, Heller G, Boucher N, Zuhowski EG, Whitlock JA, Hunger SP, Narendran A, Katzenstein HM, Arceci RJ, Boklan J, Herzog CE, Whitesell L, Ivy SP, Trippett TM. Clin Cancer Res. 2007;13:1783. doi: 10.1158/1078-0432.CCR-06-1892. [DOI] [PubMed] [Google Scholar]


