

Abstract
Objective
High frequency oscillations (HFOs) are a biomarker of epileptogenicity. Visual marking of HFOs is highly time-consuming and inevitably subjective, making automatic detection necessary. We compare four existing detectors on the same dataset.
Methods
HFOs and baselines were identified by experienced reviewers in intracerebral EEGs from 20 patients. A new feature of our detector to deal with channels where baseline cannot be found is presented. The original and an optimal configuration are implemented. Receiver operator curves, false discovery rate, and channel ranking are used to evaluate performance.
Results
All detectors improve performance with the optimal configuration. Our detector had higher sensitivity, lower false positives than the others, and similar false detections. The main difference in performance was in very active channels.
Conclusions
Each detector was developed for different recordings and with different aims. Our detector performed better in this dataset, but was developed on data similar to the test data. Moreover, optimizing on a particular data type improves performance in any detector.
Significance
Automatic HFO detection is crucial to propel their clinical use as biomarkers of epileptogenic tissue. Comparing detectors on a single dataset is important to analyze their performance and to emphasize the issues involved in validation.
Keywords: High frequency oscillations, HFO, Automatic detector, Intracerebral EEG
1. Introduction
High frequency oscillations (HFOs) are emerging as biomarkers of epileptogenic tissue that could help in the identification of epileptic or potentially epileptic regions during intracranial investigations. This could help the delineation of the surgical extent and in the prediction of surgical outcome (Jacobs et al., 2010).
HFOs are spontaneous EEG patterns in the range of 80–500 Hz, consisting of at least four oscillations that can be “clearly” distinguished from background. HFOs were first recorded with microelectrodes (20–40 μm in diameter) implanted in temporal regions (Bragin et al., 1999a), and recently with clinical macro-electrodes in temporal and neocortical regions (Jirsch et al., 2006; Urrestarazu et al., 2007; Worrell et al., 2008). When recorded with macro-electrodes, HFOs are characterized by a typical duration of 30–100 ms, an inter-event interval of at least 25 ms, and an amplitude of 10–100 μV. These EEG patterns occurring in the absence of specific stimuli, have been recorded during interictal (Staba et al., 2002; Urrestarazu et al., 2007), pre-ictal (Jacobs et al., 2009) and ictal (Jirsch et al., 2006) periods. Interictally, they can be identified more frequently during slow wave sleep than during wakefulness (Staba et al., 2004; Bagshaw et al., 2009).
During interictal periods, higher rates of HFOs were observed in the seizure onset zone (SOZ) than in other areas (Bragin et al., 1999b; Urrestarazu et al., 2007). Even though a large proportion of HFOs co-occur with spikes, HFOs can occur also in non-spiking channels or independently from spikes (Jacobs et al., 2008). The ranking of channels according to rate (Zelmann et al., 2009) indicated that HFOs remained confined to the same region during interictal and ictal periods, while spikes presented a wider spread during seizures than interictally (Zijlmans et al., 2011). Moreover, a postsurgical study showed a correlation between surgical outcome and removal of channels with high HFO rates (Jacobs et al., 2010). In summary, interictal HFOs seem to be a reliable biomarker of tissue capable of producing seizures.
Visual marking of HFOs provided a good understanding of the relation of HFOs with epilepsy (Urrestarazu et al., 2007; Zijlmans et al., 2009; Jacobs et al., 2010). However, visual marking is highly time consuming (it takes about 10 h to visually mark HFOs in a 10-channel 10-min recording) and subjectivity is inevitable. Thus, the development of automatic HFOs detectors is crucial for the systematic study of HFOs and for their eventual clinical application. The lack of a formal definition makes the detection of HFOs difficult and subjective.
Only a handful of automatic detectors based on different energy functions exist (Staba et al., 2002; Gardner et al., 2007; Crepon et al., 2010; Zelmann et al., 2010). In the first three the energy threshold is computed based on the segment of EEG under consideration, under the assumption that HFOs are rare events. On the contrary, the detector developed at the Montreal Neurological Institute (MNI) first detects baseline segments and then uses this information to compute the local energy threshold (Zelmann et al., 2010). Each detector was developed for a different frequency band (above 200 Hz, (Crepon et al., 2010), gamma band (Gardner et al., 2007)); a particular location (only temporal (Staba et al., 2002)); or electrode size (microelectrodes in (Staba et al., 2002), micro- and clinical macro-electrodes in (Worrell et al., 2008)), small clinical macro-electrodes (Zelmann et al., 2010). It is therefore important to test all the detectors on the same dataset.
In this study, we present the complete version of the MNI detector and provide a comparison between these four detectors on the same data. The new MNI detector includes a feature to deal separately with channels with very frequent or constant HF rhythmic activity. We hypothesize that all the detectors will behave similarly in those channels where HFOs are rare events, but that the MNI detector will outperform the others in channels with very frequent HFOs.
2. Methods
2.1. Patient information
Between September 2004 and April 2008, 45 patients with medically intractable epilepsy underwent depth macro-electrode (surface area 0.8 mm2) implantation at the Montreal Neurological Hospital. The depth EEG (SEEG), recorded with the Harmonie system (Stellate, Montreal, Canada), was low-pass filtered at 500 Hz and sampled at 2000 Hz, allowing for the identification of HFOs. Twenty patients were randomly selected, but one had to be excluded due to continuous artefacts. All patients gave informed consent in agreement with the Research Ethics Board of the Montreal Neurological Institute and Hospital (MNI).
2.2. Channel and event selection
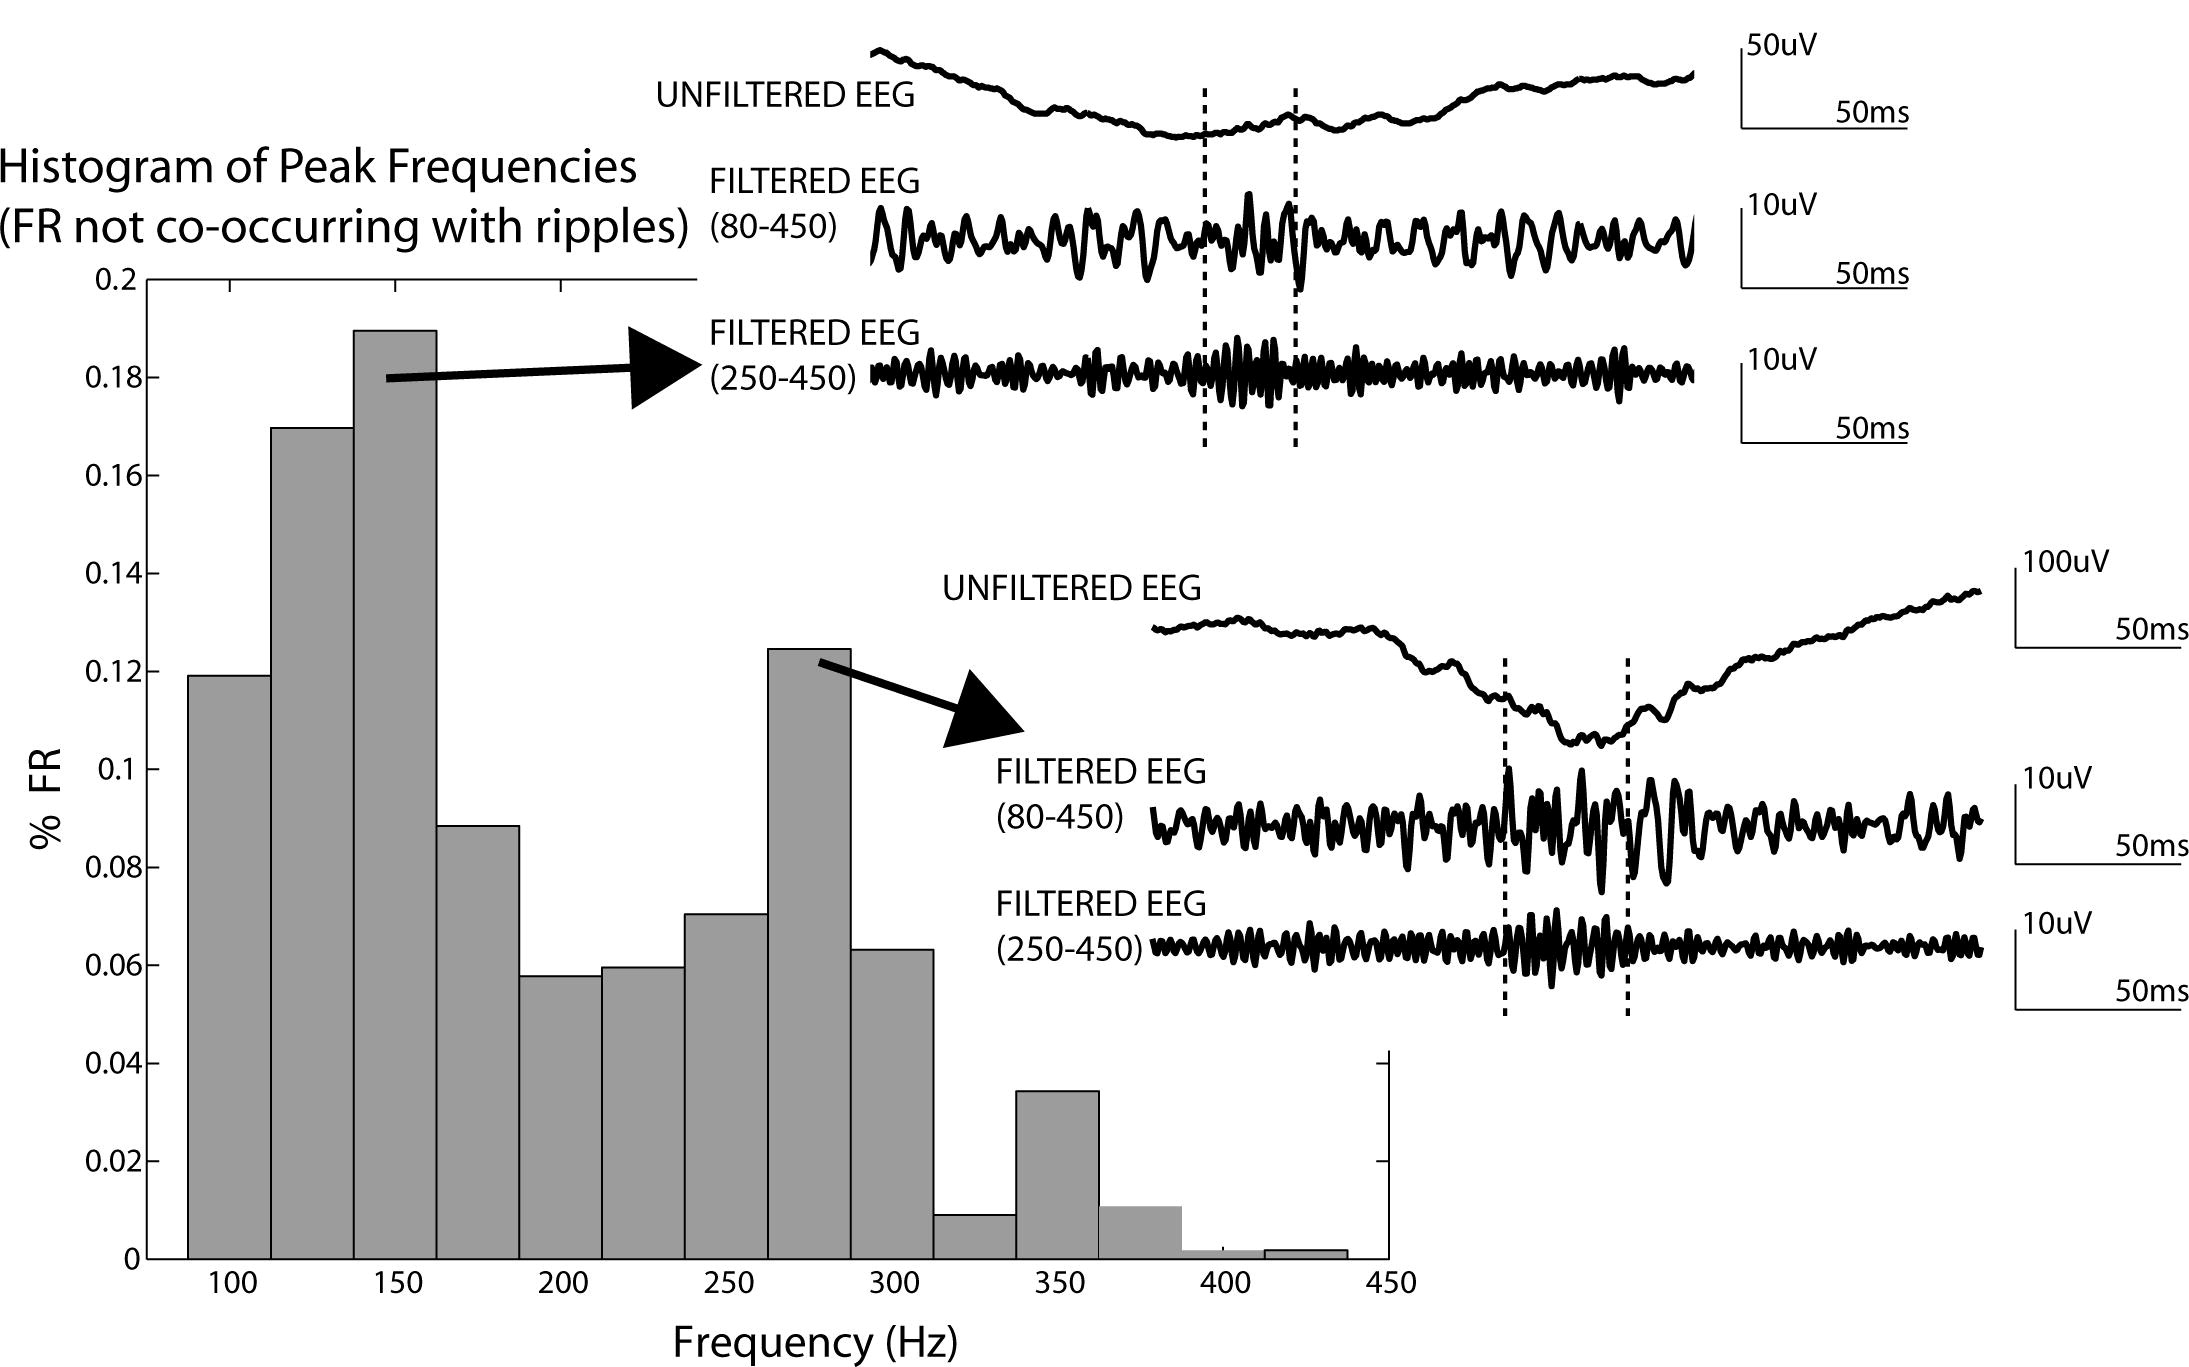
HFO events were identified independently by two experienced reviewers in all functioning channels during 1 min of slow wave sleep. Sleep stages were assessed using EOG and EMG signals, in addition to the intracranial EEG. Slow wave sleep was defined by high delta activity on the EEG, low EMG and no EOG activity (Bagshaw et al., 2009). The visual marking of HFOs was performed by splitting the screen vertically and using an 80 Hz high-pass filter on the left and a 250 Hz high-pass filter on the right. The time resolution was increased to 0.6 s across the monitor and only up to 10 channels were visualized simultaneously. A ripple (80–250 Hz) was marked if there was a clear oscillation on the left that was not visible or had a different morphology on the right. A fast ripple (FR; 250–500 Hz) was marked if it appears in the right screen (Jacobs et al., 2008). Three quarters of the FRs occurred during a ripple (74%) and the distribution of the peak of energy spectra of FRs comprises a broad frequency band (the whole 80–450 Hz; Supplementary Fig. S1). Indeed, for FRs without a visually-apparent co-occurring ripple, the distribution of peak frequencies is not limited to the 250–450 Hz band, but includes the 80–250 Hz band as well. Both ripples and FRs seem to be similarly associated with epileptogenic tissue (e.g. Urrestarazu et al., 2007; Jacobs et al., 2008, 2010; Worrell et al., 2008). Therefore, we decided to group ripples and FR and refer to them as HFO events.
To evaluate the performance of the detectors, we conducted a strict validation and a more open validation. In the strict validation only events of which we were absolutely sure that they were true positives and true negatives were considered. Thus, the positive gold standard HFO events were the HFOs marked by the two reviewers (PosAnd HFO events, Fig. 1A). Baseline segments (segments without oscillatory activity, unambiguously free of HFOs) were visually marked and considered as the negative gold standard (NegBase, Fig. 1A). This is a definition of baseline in the context of HFOs. It is useful as a comparison with HFO (which are oscillatory events), but does not intend to be a general definition of baseline activity. NegBase segments longer than 400 ms were split to obtain a mean length of 200 ms. In the more open validation we considered events and non-events more inclusively. All the events visually marked by any reviewer were considered as the positive gold standard (PosAny HFO events, Fig. 1B). Thus, Pos-Any HFOs included the events jointly marked or marked by only one reviewer. We considered HFOs marked by one reviewer for the more open validation, under the assumption that there is a possibility that these segments are HFOs, but with a lower probability than for segments jointly marked. In this case, the negative gold standard was any segment of EEG of 100 ms long at least 25 ms away from a visually marked HFO event. For the sensitivity and false positive rate (FPR = 1-specificity), we used the strict validation. To assess the false detection rate (FDR), the more open validation was used.
Fig. 1.
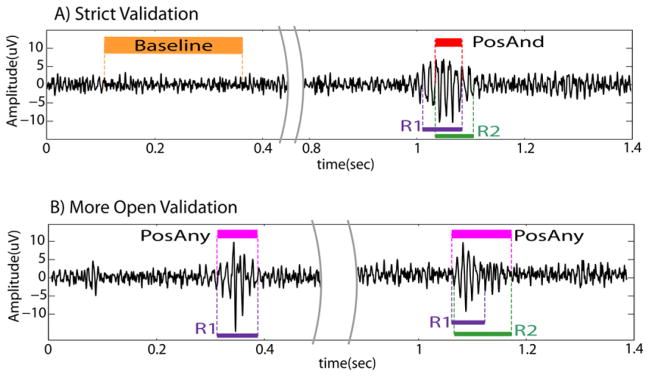
Example of reference events. (A) Strict validation. The PosAnd HFO is the intersection of the markings. Orange: marked baseline (NegBase); red: PosAnd HFO (intersection of markings). (B) More open validation. The 1st example presents an HFO only marked by reviewer 1. The 2nd example was marked by both reviewers. The PosAny HFO is the union of both markings. Magenta: PosAny HFO (event marked by at least one reviewer). Purple: HFOs marked by reviewer 1; green: HFOs marked by reviewer 2. (For interpretation of the references to color in this figure legend, the reader is referred to the web version of this article.)
Channels outside the brain, with clear continuous artifacts, or with less than one PosAnd HFO or less than one baseline were excluded from this study. Given that the variability within channels of a patient is as large as the variability across patients, all channels were considered independently. The database therefore consisted of 19 one-min sections, each with 10–39 channels, for a total of 373 channels. Out of the 373 channels, 20% (76) were randomly selected and used for training the MNI detector, resulting in 297 channels for comparing detector performance. Of these channels, 113 were mesio-temporal and 184 were neocortical; 89 were in the SOZ of the patient.
These channels included 7994 PosAnd HFO events, 13552 Pos-Any HFO events and 51061 NegBase baselines. These events were used as the gold standard events.
2.3. Automatic detectors of HFOs
Automatic HFO detectors are largely based on the comparison of the signal energy with the EEG epoch that includes the events. The main difference among these detectors is the type of energy function computed on the filtered signal and the post-processing used to prune false detections. Since the post-processing step involves human expert in some cases, it cannot be considered when comparing the performance of the detectors and will not be evaluated in this study. The detectors are presented in order of the year of original publication.
Staba et al. (2002) developed a detector based on the energy defined as the moving average of the root mean square amplitude of a filtered signal. Each channel was filtered (100–500 Hz) and segments with energy above five times the standard deviation (SD) of the mean energy of the whole EEG during more than 6 ms were considered HFOs. Events less than 10 ms apart were considered as a single event. Events required at least six oscillations above three SD. Because this last condition could be considered as a post-processing step, and to improve the sensitivity of this detector, it was not implemented. This detector was developed for microelectrode recordings in humans and rats in temporal regions (Staba et al., 2004, 2007). A sensitivity of 84% was reported (Staba et al., 2002). We will refer to this detector as the RMS detector.
The detector of Gardner et al. (2007) is based on the short-time line length (Esteller et al., 2001). Each channel was passed through a spectral equalizer (first order differential filter), then band-pass filtered (30–100 Hz in (Gardner et al., 2007), and 80–1 kHz in (Worrell et al., 2008)) and the energy threshold was computed as the 95 percentile of the empirical cumulative distribution function for the epoch (Worrell et al., 2008). Epochs lasted 3 min and included the possible events. For the post-processing, an interface for human verification was implemented. The sensitivity was 89.5% in a gamma band (30–100 Hz) study (Gardner et al., 2007). The specificity was not reported, but it was stated that ~85% of the candidate events were rejected as false positives (Worrell et al., 2008). It was applied to microelectrodes and macroelectrodes, but with the latter no FR were detected (Worrell et al., 2008). Parameters as reported in (Worrell et al., 2008) will be considered. We will refer to this detector as the LineLength detector.
Finally, in the detector of Crepon et al. (2010) the envelope of the signal was computed with a Hilbert transform. Each channel was band-pass filtered (180–400 Hz) and events were detected with a threshold five times the SD of the envelope over the whole EEG. Post validation by a reviewer with a visual interface was also implemented. The sensitivity was 100% with a specificity of 90.5%. However, only very clear events were detected and only in SOZ areas, emphasizing the lack of a common definition of HFOs across centers. Thus, care must be taken when comparing performances since not all detectors aim to identify the same “HFO event”. We will refer to this detector as the Hilbert detector.
2.4. The MNI detector
The MNI detector consists of a baseline detector; a detector of HFOs in channels with baseline (that incorporates the baseline information); and a detector of HFOs in channels with continuous High Frequency (HF) activity, for channels without sufficient baseline (Fig. 2). As the other detectors, the MNI detector aims to detect as many events as possible, even if a large number of false detections take place. The first 2 blocks of the detector are described in detail in (Zelmann et al., 2010).
Fig. 2.
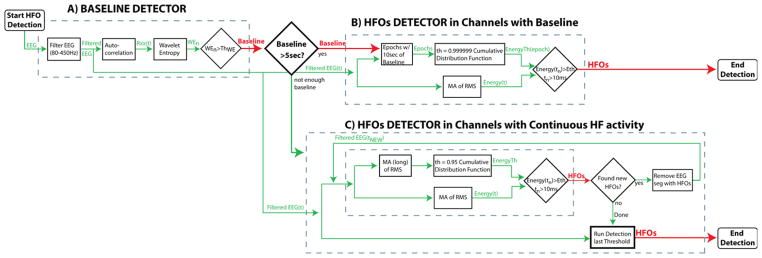
Diagram of the MNI detector. (A) baseline detector. (B) HFOs detection in channels with baseline. (C) HFOs detection in channels with continuous high frequency activity. If more than 5 s/min of baselines are found, HFOs are detected with respect to the baseline segments (B). If less than 5 s/min of baseline were detected, HFOs are detected with respect to the entire EEG segment in an iterative way (C). WE: wavelet entropy; Rxx: autocorrelation; th: Threshold.
2.4.1. Band-pass filter
The EEG was first band-pass filtered (80–450 Hz) using a FIR equirriple filter (fStop1 = 70 Hz; fPass1 = 80 Hz; fPass2 = 450 Hz; fStop2 = 460 Hz; stopband attenuation = −60 dB). The signal was filtered forward and backwards to obtain zero-phase. To minimize the effect of filtering in the detection, the impulse response of the filter was checked to oscillate less than the minimum number of oscillations (Benar et al., 2010). In addition, we randomly selected HFOs identified using this filter from the training dataset and verified that they were visible in the unfiltered EEG. Each detector was tested using this filter as well as their default filter.
2.4.2. Baseline detection (Fig. 2A)
We define as baselines, segments of EEG where there is no oscillatory activity of any kind. The baseline detector (Chander, 2007) is based on the wavelet entropy (WE) which measures the degree of randomness (vs. oscillatory behavior) in the signal (Rosso et al., 2001). To enhance the oscillatory characteristics of the signal, the WE was applied to the autocorrelation of the filtered signal (Chander, 2007). The EEG was divided into segments of 125 ms with 50% overlap. The normalized wavelet power of the autocorrelation was computed for each segment. A complex Morlet wavelet was used. The maximum theoretical wavelet entropy (WEmax) is obtained for white noise, when contributions at all scales are similar. Thus, a segment was considered as baseline (i.e. no oscillation present) when the minimum WE was larger than the threshold obtained from training (0.67 WEmax). Consecutive or overlapping segments were joined.
2.4.3. HFO detection in channels with baseline (Fig. 2B)
The EEG with detected baselines is evaluated to assess whether “a sufficient amount” of baseline (i.e.: at least 5 s/min) was detected. For channels with sufficient baseline, the next block detects possible HFOs based on the energy defined as the moving average of the root mean square amplitude of the filtered signal. Segments with energy above threshold during more than 10 ms were considered HFOs. Events less than 10 ms apart were considered as a single event. The energy threshold was obtained by computing the empirical cumulative distribution function of each 10 s baseline segment (or the entire baseline if shorter than 10 s), modeling the distribution with a gamma function, and returning the value at the 99.9999 percentile as the threshold. This block of the detector is similar to (Staba et al., 2002) in the energy function and to (Gardner et al., 2007) in the threshold computation, but unlike the other detectors, the MNI detector considers the threshold with respect to the detected baselines.
2.4.4. HFO detection in continuous HF channels (Fig. 2C)
If less than 5 s/min of available baseline was found, the channel was considered as continuous HF channel (i.e.: with continuous high frequency oscillatory activity). In these channels, the separation of HFOs from the oscillatory background cannot rely on the same methods as channels with random background. Thus, an iterative approach was implemented. At each iteration, the threshold was computed from the complete 1 min band-passed EEG as the 95 percentile of the cumulative distribution function (modeled with a gamma function). Segments with energy above threshold during more than 10 ms were considered HFOs. In this way, the events with the highest energy (mostly sharp spikes and HFOs riding on spikes) are first detected and removed for the following iterations. In subsequent iterations, these large events did not influence the calculation of the new threshold, allowing for the detection of HFOs that are larger than a threshold computed from the remaining background. This iterative process continues until no more HFOs are detected. In this way, a threshold is found for each 1-min recording for each channel. To avoid the effect of the successive removal of EEG segments in the length of detected HFOs, the detector was run again for that threshold. Thus, the detector is similar to the RMS detector if considering only the first iteration, but adapts the threshold to detect more events in successive iterations.
2.4.5. Parameter optimization
The parameters of the baseline block were optimized to maximize the duration of detected baseline that overlaps with the reference. Each channel “voted” their parameters to obtain the largest baseline overlap, and the set of parameters with most votes was selected (Zelmann et al., 2010). The HFO detection blocks were optimized to maximize sensitivity with respect to PosAnd events, while strongly limiting the detection of events within visually marked baselines and loosely limiting detections outside PosAny events.
Table 1 presents the parameters for each detector as reported in the original publications (Staba et al., 2002; Gardner et al., 2007; Crepon et al., 2010). All parameter values of the MNI detector were obtained from optimization.
Table 1.
Parameters of the detectors as indicated in the original publications. Only the MNI detector incorporates the detection of baseline. For the MNI detector, the parameters of the two HFO detection blocks are given separated by / (HFOs detector in channels with baseline / HFOs detector in channels with continuous HF activity).
| Parameters of the detectors as indicated in the original publications
|
||||
|---|---|---|---|---|
| RMS detector Staba et al. (2002) | LineLength detector Worrell et al. (2008) | Hilbert detector Crepon et al. (2010) | MNI detector | |
| PreProcessing | ||||
| Spectral equalization | – | 1st Order difference | – | – |
| BP filter band | 100–500 Hz | 80–1 kHz | 180–400 Hz | 80–450 Hz |
| BP filter type | FIR | 4th Order Butterworth | FIR (win) | FIR (equirriple) |
| Baseline Detection | WE(Rxx) | |||
| Threshold | – | – | – | 0.67 |
| Duration | – | – | – | 125 ms |
| Min duration baseline | – | – | – | 5sec |
| HFOs detection | ||||
| Energy measure | RMS amplitude | LineLength | Hilbert envelope | RMS amplitude |
| Window size | 3 ms | 85 ms | – | 10 ms/5 ms |
| Window size long | – | – | – | –/10 ms |
| Threshold energy | 5 SD | 95 Percentile | 5 SD | 99.9999/95 Percentile |
| Thres. measured from | All EEG | Epoch (3 min) | all EEG | 10 s Baseline/1 min EEG |
| Threshold duration | 6 ms | 80 ms | – | 10 ms/10 ms |
| Min inter event interval | 10 ms | – | – | 10 ms |
FIR: finite impulse response filter; RMS: root mean square; WE: wavelet entropy; Rxx: autocorrelation; SD: standard deviation; –: not applicable/not specified.
2.5. Performance metrics
Receiver operating characteristic (ROC) curves measure the performance of a detector when varying the energy threshold and were used for the comparison of detectors. PosAnd events were considered as the true positives and NegBase events as the true negatives. Segments of EEG where nothing was visually marked by both reviewers were not taken into account, under the assumption that there might be HFOs in those segments, which were not visible to the human reviewer and to account for variability across reviewers. Thus, a true positive (TP) was a visually marked HFO by the 2 reviewers that was identified by the automatic detector; a false positive (FP) was an automatically detected event that corresponded to a visually marked baseline; a false negative (FN) was an HFO visually marked by the 2 reviewers that was missed by the automatic detector; and a true negative (TN) was a visually marked baseline where no HFOs were identified. The ROC curve for each channel was computed and the average across channels obtained for each threshold value (Fawcett, 2006). The area under the curve (AUC) ranges from 0 to 1, with 1 representing the perfect decision maker. Since the diagonal in the ROC plane represent a random decision, no detector can have an AUC smaller than 0.5.
Cohen’s Kappa coefficient (Cohen, 1960) was also computed to compare each detector with the gold standard (PosAnd and NegBase) in each channel. This coefficient measures the degree of agreement between two reviewers (in this case one human and one automatic), taking into account the agreements made by chance. Kappa ≤ 0 reflects an agreement due purely to chance and Kappa = 1 indicates perfect agreement.
Given the strict definition of the PosAnd and NegBase gold standards used to compute the ROC curves, the FPR does not represent the number of automatic detections that lie outside a true detection, but rather the number of automatic detections that are within clear baselines. Thus, to also analyze the total number of detections that do not correspond to any visually marked event, we define the FDR as the number of automatically detected events that are outside any visually marked event (PosAny) divided by the total number of detected events. In this way, both the total number of false detections and those corresponding to baseline segments were studied.
The ultimate goal of an automatic detector is to provide the same conclusions as when visually marking the recording. The ranking distance (RKD; Zelmann et al., 2009) measures the cost of obtaining a different order of channels (ordered from more to fewer events) when detecting events automatically compared to the order obtained from visually identified PosAnd events. For instance, if channel A has 3 visually detected events, channel B 25 and channel C 5, we expect the automatic detector to detect more events in channel B than in the other two. RKD score ranges from 0 to 1, with 0 representing exactly the same ranking, and 1 corresponding to a ranking completely upside down. Thus, even though we accept a large number of false positives under the assumption that there might be events not seen by the reviewer, the relative number of false positives to true positives should be equivalent in all the channels of each patient. For this measure, all detected events were considered (i.e.: not only the true positives).
Statistical comparisons of the performance metrics were performed using balanced one-way ANOVA; post hoc comparisons were done using Tukey’s honestly significant differences (HSD) test. The level of significance was set at p < 0.05. All processing was implemented based on MATLAB.
3. Results
3.1. Original configurations
We compared our detector with the others considering the parameters, filter and thresholds in the original publications (see Table 1). Fig. 3 shows the ROC curves across channels. The MNI detector considers differently channels with more than 5 s/min of detected baselines (170 channels) and channels with less than 5 s/min of baseline (127 channels). Results are presented separately for the two groups. With the original configuration, the AUC for “Channels with Baseline” was: 0.994 for the RMS detector; 0.84 for the LineLength detector; 0.8 for the Hilbert detector; and 0.996 for the MNI detector. For “Channels with continuous HF activity” the AUCs were, respectively 0.98, 0.81, 0.77 and 0.991.
Fig. 3.
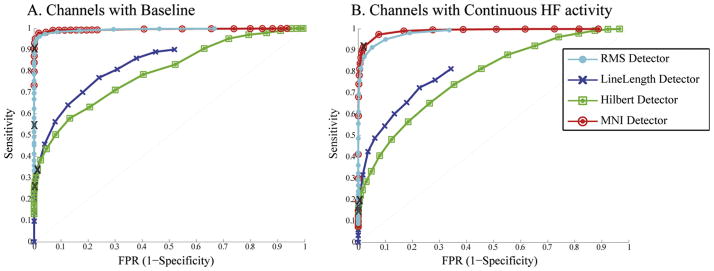
Average ROC curves for original configuration. Comparison of average ROC curves across channels considering the original parameters and filter (see Table 1). Channels where baseline can or cannot be found are separately shown. X: original thresholds.
When considering the energy threshold as reported in each publication (indicated as an X in Fig. 3), the FPR was below 1% for all detectors, but the sensitivity was low for all but the MNI detector, which was significantly higher than the others (Table 2). The difference is not surprising since the MNI detector was optimized for a similar dataset, while the others were developed for a different definition of HFO. For instance, the Hilbert detector only considers frequencies above 180 Hz and therefore cannot detect HFOs in lower frequencies. The FPR for the RMS and Hilbert detectors were significantly lower than for the LineLength or MNI detectors. The difference between these last two was not significant. The FDR was similar for all the detectors but the RMS detector, significantly lower than the others.
Table 2.
Statistics across channels for default configuration. Sensitivity, FPR and Kappa computed using PosAnd and NegBase as reference; FDR computed with respect to PosAny events.
| Default filter and threshold
|
||||||||
|---|---|---|---|---|---|---|---|---|
| Sensitivity (%)
|
FPR (%)
|
FDR (%)
|
kappa
|
|||||
| Mean ± SD | Median | Mean ± SD | Median | Mean ± SD | Median | Mean ± SD | Median | |
| RMS | 38.1 ± 37a | 28.6 | 0.0 ± 0 | 0.0 | 16.7 ± 25a | 0.0 | 0.43 ± 0.39a | 0.39 |
| LineLength | 27.6 ± 30a | 18.8 | 0.8 ± 1 | 0.6 | 59.6 ± 33 | 34.3 | 0.26 ± 0.26 | 0.21 |
| Hilbert | 21.1 ± 29a | 6.3 | 0.1 ± 0 | 0.0 | 50.2 ± 41 | 50.0 | 0.24 ± 0.30 | 0.05 |
| MNI | 91.0 ± 20a | 100.0 | 0.9 ± 3 | 0.0 | 55.0 ± 28 | 55.6 | 0.85 ± 0.25a | 0.97 |
Indicates significant difference with all the others (p < 0.05). Significance difference among only some of the detectors is not indicated in this table, but explained in the text.
SD: standard deviation; per: percentile.
The percentage of channels (out of 297) where all the PosAnd events were detected was: 17% (50) for the RMS detector; 6% (19) for the LineLength detector; 6% (18) for the Hilbert detector; and 68% (202) for the MNI detector.
The Kappa coefficient for all but the MNI detector was low since the sensitivity was low (Table 2). The Kappa for the MNI detector was significantly higher than the others. As a comparison the Kappa for reviewer 1 compared to PosAnd & NegBase was 0.99 ± 0.03 (median: 1) and for reviewer 2 was 0.97 ± 0.15 (median: 1). The Kappa between the 2 reviewers (considering NegBase events as the true negatives) was 0.83 ± 0.22 (median: 0.93).
3.2. Optimum configurations
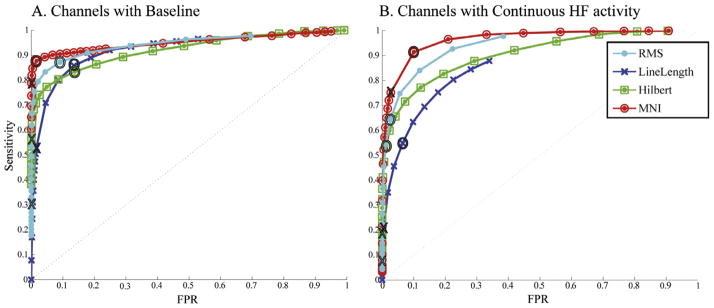
To better compare the four detectors and to improve their performance in this dataset, the same filter was implemented for all detectors. In addition, the spectral equalizer filter of the LineLength detector was removed, which further improved performance in this detector. By using a similar filter than the one used for the reference events, the performance improves (Fig. 4). The AUCs for “Channels with Baseline” were: 0.994 for the RMS detector; 0.98 for the LineLength detector; 0.989 for the Hilbert detector; and 0.996 for the MNI detector. For “Channels with continuous HF activity” the AUCs were, respectively 0.981, 0.943, 0.972, and 0.991.
Fig. 4.
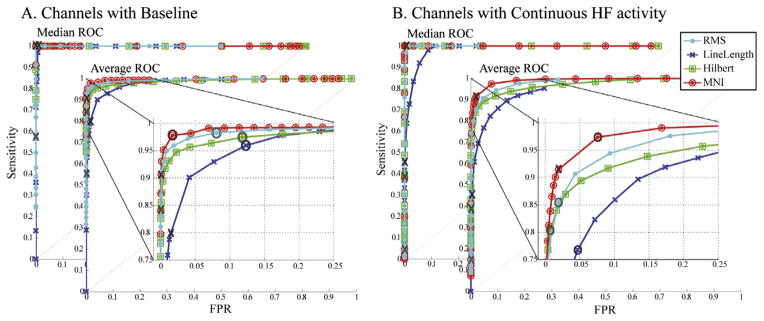
Median and average ROC across channels for the same 80–450 Hz FIR filter. Channels where baseline can or cannot be found are separately shown. Insight: zoom of the average ROC. X: original thresholds; O: optimum threshold (closest to left top corner). The performance of the detectors that originally used a different filter improves considerably.
In order to provide a comparable measure of performance across detectors, the “optimum” point in the ROC curves was selected. We define as the “optimum” energy threshold, the threshold closest to the left top corner in the ROC curves obtained with the same band-pass filter. For the MNI detector optimum thresholds were obtained separately for channels with or without baseline. For the other detectors, the optimum threshold was obtained from the ROC across all the 297 channels. The optimum thresholds are shown in the first column of Table 3 and are indicated as O in Fig. 4.
Table 3.
Statistics across channels for optimum configuration. Threshold column indicates the optimum energy threshold (closest to left top corner in average ROC curves). Sensitivity, FPR and Kappa computed using PosAnd and NegBase as reference; FDR computed with respect to PosAny events.
| Same filter 80–450 Hz and optimum thershold (average ROC)
|
|||||||||
|---|---|---|---|---|---|---|---|---|---|
| Threshold | Sensitivity (%)
|
FPR (%)
|
FDR (%)
|
kappa
|
|||||
| Mean ± SD | Median | Mean ± SD | Median | Mean ± SD | Median | Mean ± SD | Median | ||
| RMS | 1 STD | 92.7 ± 16 | 100.0 | 5.4 ± 9 | 1.6 | 72.4 ± 32 | 89.6 | 0.58 ± 0.34 | 0.66 |
| LineLength | 80per | 87.6 ± 21 | 100.0 | 9.0 ± 7 | 6.6 | 70.9 ± 26 | 79.6 | 0.40 ± 0.28a | 0.34 |
| Hilbert | 2.75 STD | 90.0 ± 20 | 100.0 | 7.0 ± 14 | 0.4 | 61.2 ± 36 | 75.8 | 0.60 ± 0.38 | 0.73 |
| MNI | 99.9/90per | 97.6 ± 10a | 100.0 | 4.3 ± 8 | 1.2 | 75.7 ± 24 | 82.9 | 0.75 ± 0.26a | 0.84 |
Indicates significant difference with all the others (p < 0.05). Significance difference among only some of the detectors is not indicated in this table, but explained in the text.
SD: standard deviation; per: percentile.
As shown in Table 3, the sensitivity of all detectors is good when choosing the optimum threshold and using a similar band-pass filter to the one used to mark the reference. The FPR is worse for all detectors than it was for the default threshold, but the Kappa coefficient is higher. The MNI detector had the highest sensitivity, the lowest FPR, and the highest Kappa coefficient. The sensitivity of the MNI detector was significantly higher than the others. The FPR was significantly lower than the FPR of the LineLength and Hilbert detectors but not different from the RMS detector. Kappa was significantly higher for the MNI detector and significantly lower for the LineLength detector compared to the others. The number of false detection was high. The median FDR was above 75% for all detectors, indicating that at least three quarters of the detections were false detections in most channels. The FDR of the Hilbert detector was significantly lower than that of the MNI or RMS detectors but not than that of the LineLength detector, and still high. These false detections must be removed in later steps for a detector to be used clinically.
With this optimum configuration, the percentage of channels (out of 297) where all PosAnd events were detected was: 72% (214) for the RMS detector; 59% (176) for the LineLength detector; 70% (209) for the Hilbert detector; and 85% (251) for the MNI detector. Furthermore, 166 channels (56%) had perfect detection by all the detectors, comparing to only 11 channels (4%) with original configurations.
3.3. Pooling all events together
The previous ROC curves were averaged across channels. By pooling all the events, the total number of detected HFOs can be studied. The difference among detectors becomes more evident (Fig. 5) than when averaging across channels, since only the MNI detector can detect most of the events in very active channels (where the rate of HFOs is also high). For all the events pooled together and using the same filter for all the detectors, the AUCs for “Channels with Baseline” were: 0.945 for the RMS detector; 0.924 for the LineLength detector; 0.921 for the Hilbert detector; and 0.951 for the MNI detector. For “Channels with continuous HF activity” the AUCs were, respectively 0.939, 0.855, 0.904, and 0.964.
Fig. 5.
ROC curves pooling events together for the same 80–450 Hz FIR filter. When pooling all the events together the difference in performance among detectors become more striking than when averaging across channels. Channels where baseline can or cannot be found are separately shown. X: original thresholds; O: optimum threshold (closest to left top corner in ROC average across channels). Thresholds are the same as in Fig. 4.
Table 4 presents the sensitivity, FPR and FDR for the default and optimum configurations when pooling all events. All detectors increased the number of detected events when using the optimum threshold, but at the expense of a higher FPR and FDR. Only the MNI detector detected 90% of the events, with the lowest FPR.
Table 4.
Performance for all events pooled together. Left part of the table: filter and threshold as published in original publication (see Table 1). Right part of the table: Same 80–450 Hz filter was used in all detectors and the optimum threshold obtained as in Fig. 4. Sensitivity and FPR computed using PosAnd and NegBase as reference; FDR computed with respect to PosAny events.
| Default filter and threshold
|
80–450 Hz filter and optimum threshold
|
|||||
|---|---|---|---|---|---|---|
| Sensitivity (%) | FPR (%) | FDR (%) | Sensitivity (%) | FPR (%) | FDR (%) | |
| RMS | 14.0 | 0.0 | 15.5 | 70.3 | 7.1 | 77.3 |
| LineLength | 19.2 | 1.0 | 45.4 | 62.9 | 11.3 | 66.3 |
| Hilbert | 17.2 | 0.1 | 20.7 | 61.1 | 9.9 | 71.4 |
| MNI | 76.1 | 0.9 | 56.9 | 90.5 | 4.3 | 71.8 |
Given that the very active channels contain a large rate of HFOs, by detecting more on those channels, the MNI detector detects a larger amount of total events compared to the other detectors. This type of analysis gives a better idea of the overall performance of the detector regardless of the type of channel (Gotman and Wang, 1992).
3.4. Ranking distance
The ranking distance (RKD) measures that the ranking of channels for each patient was similar to the one obtained from PosAnd reference. The mean, standard deviation and median across patients is reported (Table 5). The RKD of the LineLength detector improved for the optimum threshold, while the RKD for the RMS and Hilbert detectors was worse. The RKD of the MNI detector was similar in both cases. There were no significant differences among detectors for the default configuration; for the optimum configuration the RKD for the LineLength and MNI detectors was significantly lower than the RKD for the RMS and Hilbert detectors.
Table 5.
RKD across patients. Left part of the table: filter and threshold as published in original publication (see Table 1). Right part of the table: Same 80–450 Hz filter was used in all detectors and the optimum threshold obtained as in Fig. 4.
| RKD (across patients)
|
||||
|---|---|---|---|---|
| Default filter and threshold
|
80–450 Hz filter and optimum threshold
|
|||
| Mean ± SD | Median | Mean ± SD | Median | |
| RMS | 0.54 ± 0.25 | 0.55 | 0.78 ± 0.14 | 0.79 |
| LineLength | 0.43 ± 0.18 | 0.44 | 0.34 ± 0.17 | 0.39 |
| Hilbert | 0.40 ± 0.25 | 0.40 | 0.91 ± 0.08 | 0.92 |
| MNI | 0.38 ± 0.18 | 0.39 | 0.38 ± 0.17 | 0.39 |
As a comparison the RKD for reviewer 1 compared to the PosAnd events was 0.03 ± 0.05 (median: 0) and for reviewer 2 was 0.05 ± 0.18 (median: 0). When comparing reviewer 2 markings with reviewer 1 markings, the RKD was 0.07 ± 0.17 (median: 0.025). The large difference between the RKD for human reviewers and for any detector indicates that post-processing is fundamental to prune false detections and to obtain conclusions similar to the visual markings.
3.5. Analysis of the detected events
Half of the HFOs (50.5%) were detected by all the detectors when using the optimal configuration. This was particularly the case in channels were HFOs were rare, since this is an implicit assumption in all detectors except the MNI detector. In active channels however, low amplitude HFOs are only detected by the MNI detector. Fig. 6 presents examples of events found by all detectors and some identified only by some detectors in the same channels.
Fig. 6.

Examples of HFO detections. (A) SOZ channel in the hippocampus, with continuous background activity and many spikes as the one depicted in the raw EEG. All the detectors found the 2nd event, but only the MNI detector found also the 1st one. Baselines were not found, and therefore the detector for continuous channels block was used. In addition, a false detection is shown. (B) SOZ channel in the Amygdale. The 1st event was found by all detectors, the 2nd event only by the MNI detector. In this channel 10.6 s of baseline were found and HFOs were detected by the MNI detector based on that baseline. In addition, a false detection is shown. (C) NonSOZ, neocortical very active channel. The epileptiform activity that is observed is repeated periodically in the recording. In this channel 16.4 s of baseline were found. Therefore HFOs were detected by the MNI detector based on that baseline. Black: PosAnd reference HFOs; yellow: NegBase reference baseline; cyan: RMS detections; blue: LineLength detections; green Hilbert detections; and red: MNI detections. (For interpretation of the references in colour in this figure legend, the reader is referred to the web version of this article.)
A desirable property of any detector is to detect equivalently in all types of channels. Thus, by considering all events regardless of channel, we evaluated whether there was a difference in detection in different anatomical locations (Fig. 7).
Fig. 7.
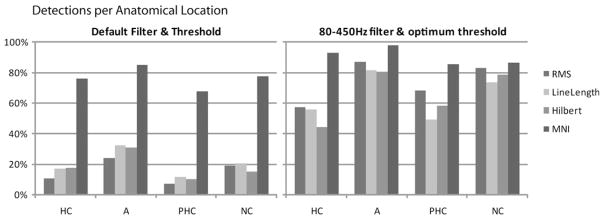
Detections per anatomical location. All detectors improve the sensitivity for all anatomical regions. HC: hippocampus, A: amygdale, PHC; parahippocampus, NC: neocortex.
Detections in all areas increased when moving to the optimum configuration, but were worse in hippocampus and parahipocampus than in other regions for all detectors but the MNI detector. With the MNI detector more than 80% of the HFOs were detected regardless of region.
4. Discussion
Visual markings of HFOs provided a good understanding of the relation of HFOs with epilepsy (Urrestarazu et al., 2007; Jacobs et al., 2008, 2010; Zijlmans et al., 2009). But this manual procedure is highly time consuming and subjective. For the systematic study of HFOs and for a future clinical application, robust automatic detection of HFOs is necessary. In this study, we presented a comparison of performance of HFO detectors based on energy on the same dataset.
In channels with rare HFOs, considering the entire EEG segment or only the detected baselines for calculating the energy threshold does not make an important difference. In these channels, all detectors (using the appropriate filter and the optimum threshold) behaved similarly. The main difference appears in very active channels. For instance, channels with baseline segments, but very active (Fig. 6C) benefit from the detection with respect to clear baseline segments (instead of the whole EEG) to detect not only the large amplitude events but also the ones with lower energy. Furthermore, some of these channels have continuous HF background activity without clear baseline sections (example in Fig. 6A). In these channels, only the clear, large amplitude HFOs are detected by all detectors since the threshold is computed based on the whole recording, including these large events. With an iterative approach, smaller HFOs can be detected. Since many hippocampal channels have continuous high frequency activity, it is not surprising that the difference in performance was clearest in hippocampal channels.
It is important to optimize a detector for a particular type of data instead of using directly a standard configuration. By modifying filters and thresholds the sensitivity of all the detectors was improved. Each detector was designed with an implicit definition of what an HFO is, since there is no consensus. For instance, the RMS detector was developed for hippocampal microelectrode recordings (Staba et al., 2002) and considered as HFO events with at least six oscillations above certain energy level; the LineLength detector developed for gamma activity, and later used for high frequency band (80–1000 Hz) activity in microelectrodes and subdural electrodes; the Hilbert detector only considered events in the 180–400 Hz band and was developed for a wake dataset (Crepon et al., 2010); the MNI detector was developed for a similar dataset than the one used here for testing. The improvement in performance of the detectors designed for a different type of signal is not surprising, but it should raise awareness of the danger of using a detector without validation.
The optimum threshold was selected based on the distance to the best possible point in an ROC curve. This was a useful criterion to compare the detectors. However, when implementing a detector for research or clinical applications, this threshold selection may not be best. One may consider using a threshold optimized for a small training dataset, imposing a constrain in the number of false detections. The optimization function used for the definition of parameters of the MNI detector is an example; imposing a maximum FPR in the ROC curves (as in Crepon et al., 2010) is another.
Only events that corresponded to visually detected HFOs or baselines were considered for the calculation of sensitivity and FPR. This strict definition of the true negative events can explain the extremely low FPR, which must be interpreted with caution: a low FPR does not necessarily imply a low number of false detections, but rather a low number of detections within visually marked baselines. Furthermore, given the large number of visually marked baselines (~50,000) a 1% FPR represents 500 false detections. However, given that some segments of EEG cannot unequivocally be considered as baseline or as HFOs, we believe that considering the FPR with respect to the NegBase is appropriate. Thus, even though detections occurred, a good proportion of the EEG data was not considered for the ROC curves and for the comparison of FPR across detectors. Analysis of events in these EEG segments could identify events not visible to the human reviewer or on the contrary indicate FP due to artefacts.
Although making false detections on 66–76% of the detections seems an enormous number, it is small compared to the reported values. For instance, Crepon and colleagues reported that only about 1% of automatically detected events were kept after postprocessing (Crepon et al., 2010), while Worrell and colleagues kept 15% of detected events (Worrell et al., 2008).
Automatic detectors consider each channel independently from each other. Therefore, the ideal gold standard should have been to review the channels in isolation. However, visual marking of HFOs is already highly time intensive. Reviewing channels in isolation would have taken too long to be feasible (since 10 consecutive channels were marked simultaneously, the time would increase considerably). In addition, since we only considered depth electrodes for this study, and since HFOs are usually visible only in a few channels simultaneously (Crepon et al., 2010), we believe that visually marking HFOs in isolation would have provided similar gold standard HFOs. In any case, since the same gold standard was used to measure the performance of all detectors, it does not affect their comparison.
The goal of an automatic detector is to provide the same conclusions that could be obtained with visual marking. Thus, even if we accept a large number of false positives, the relative number of false positives to true positives must be equivalent in all channels. This was measured with the RKD. The great variability in RKD across subjects was probably due to false positive detections, but this remains to be validated. If this is the case, the RKD would improve after post-processing. On the other hand, the variability across human reviewers was extremely low, as indicated by a high Kappa and low RKD, which was expected since visual markings were evaluated and corrected for consistency following the procedure of (Zelmann et al., 2009).
Most channels with continuous oscillatory HF activity, where baselines could not be identified, contained high rates of HFOs and were related to epileptogenic regions. Thus, an analysis of different types of background activity is under study to establish clearer definitions for automatic HFO detection in those channels (Mari et al., 2010). They were common in mesial temporal regions of patients with mesial temporal lobe epilepsy. When visually marking HFOs in these channels, only oscillatory events with one clear frequency component, at least four oscillations, and energy larger than the surrounding continuous oscillatory background are considered. The iterative approach in the MNI detector detected most HFOs in these channels.
The distinction between pathological and physiological HFOs remains uncertain (Engel et al., 2009). In microelectrode recordings, it is associated with a difference in frequency, with ripples regarded as normal and FR pathological (Bragin et al., 1999a; Staba et al., 2002). However, studies with macroelectrodes suggested that this distinction might be arbitrary. The rates of ripples and FR were higher in SOZ than outside (Urrestarazu et al., 2007; Jacobs et al., 2008; Worrell et al., 2008), ripples behaved similarly to FR with respect to surgical outcome (Jacobs et al., 2010) and medication withdrawal (Zijlmans et al., 2009). Thus, ripples and FR seem to be associated with tissue that generates seizures. Moreover, physiological HFO emerging from the visual cortex had similar spectral characteristics to the HFOs emerging from epileptogenic tissue (Nagasawa et al., 2011). These results indicate that frequency alone is not sufficient to discriminate between pathological and physiological HFOs. A recent study showed that events clustered into ripples and FR, but also with a third class of mixed components (Blanco et al., 2010). Even though two frequency peaks (Staba et al., 2002) or separate classes (Blanco et al., 2010) were found, detections were made on a broad frequency band similar to the one we chose. If a distinction between ripples and FR is demonstrated, detectors should be tailored to each.
For an automatic detector to be used clinically, false detections must be discarded. Different approaches can be considered for post-processing. A semi-automatic detector in which visual validation is performed by experienced reviewers can be implemented (as in Worrell et al., 2008; Crepon et al., 2010). This approach allows for the removal of artefacts, the possible modification of the duration of the detected HFO, and could be used for all types of recordings. Even though expert intervention is required, the time needed is greatly reduced. Another possibility is the automatic classification of detections in events or artefact (Blanco et al., 2010). After post-processing, it is important to assess whether the detections provide meaningful information for localization of the epileptogenic area. A comparison of the conclusions drawn from (semi-) automatically detected HFOs with those obtained from visual markings provides the ultimate validation for a robust detector.
In conclusion, the automatic detection of HFOs is crucial to propel the clinical use of HFOs as biomarkers of epileptogenic tissue. Automatic detectors were developed for different EEG recordings and with different aims. Given the lack of a formal definition of HFOs, comparing them in a single dataset is important to analyze their performance and to emphasize the issues involved in validation. The MNI detector performed better than the others in this dataset (higher sensitivity, lower FPR and similar FDR), but was developed on channels similar to those used for testing. The choice of energy function does not seem to be the most relevant difference, but the approach by which the energy threshold is computed may matter. Optimizing on a particular type of data improves performance in any detector.
Supplementary Material
HIGHLIGHTS.
The automatic detection of HFOs is crucial to propel the clinical use of HFOs as biomarkers of epileptogenic tissue.
A comparison of existing detectors on the same dataset is presented to analyze their performance and to emphasize the issues involved in validation.
Optimizing on a particular type of data could improve performance in any detector.
Acknowledgments
This work was supported by Grants MOP-10189 and MOP-102710 from the Canadian Institutes of Health Research. RZ was supported by National Science and Engineering Research Council (NSERC) Postgraduate Scholarship (PGSD).
References
- Bagshaw AP, Jacobs J, LeVan P, Dubeau F, Gotman J. Effect of sleep stage on interictal high-frequency oscillations recorded from depth macroelectrodes in patients with focal epilepsy. Epilepsia. 2009;50:617–28. doi: 10.1111/j.1528-1167.2008.01784.x. [DOI] [PMC free article] [PubMed] [Google Scholar]
- Benar CG, Chauviere L, Bartolomei F, Wendling F. Pitfalls of high-pass filtering for detecting epileptic oscillations: a technical note on “false” ripples. Clin Neurophysiol. 2010;121:301–10. doi: 10.1016/j.clinph.2009.10.019. [DOI] [PubMed] [Google Scholar]
- Blanco JA, Stead M, Krieger A, Viventi J, Marsh WR, Lee KH, et al. Unsupervised classification of high-frequency oscillations in human neocortical epilepsy and control patients. J Neurophysiol. 2010;104:2900–12. doi: 10.1152/jn.01082.2009. [DOI] [PMC free article] [PubMed] [Google Scholar]
- Bragin A, Engel J, Jr, Wilson CL, Fried I, Mathern GW. Hippocampal and entorhinal cortex high-frequency oscillations (100–500 Hz) in human epileptic brain and in kainic acid-treated rats with chronic seizures. Epilepsia. 1999a;40:127–37. doi: 10.1111/j.1528-1157.1999.tb02065.x. [DOI] [PubMed] [Google Scholar]
- Bragin A, Engel J, Jr, Wilson CL, Vizentin E, Mathern GW. Electrophysiologic analysis of a chronic seizure model after unilateral hippocampal KA injection. Epilepsia. 1999b;40:1210–21. doi: 10.1111/j.1528-1157.1999.tb00849.x. [DOI] [PubMed] [Google Scholar]
- Chander R. EEG [Thesis (M Eng)] 2007. Algorithms to detect high frequency oscillations in human intracerebral. [Google Scholar]
- Cohen J. A coefficient of agreement for nominal scales. Educ Psychol Meas. 1960;20:37–46. [Google Scholar]
- Crepon B, Navarro V, Hasboun D, Clemenceau S, Martinerie J, Baulac M, et al. Mapping interictal oscillations greater than 200 Hz recorded with intracranial macroelectrodes in human epilepsy. Brain. 2010;133:33–45. doi: 10.1093/brain/awp277. [DOI] [PubMed] [Google Scholar]
- Engel J, Jr, Bragin A, Staba R, Mody I. High-frequency oscillations: what is normal and what is not? Epilepsia. 2009;50:598–604. doi: 10.1111/j.1528-1167.2008.01917.x. [DOI] [PubMed] [Google Scholar]
- Esteller R, Echauz J, Tcheng T, Litt B, Pless B. Line length: an efficient feature for seizure onset detection. Conf Proc IEEE Eng Med Biol Soc. 2001;2:1707–10. [Google Scholar]
- Fawcett T. An introduction to ROC analysis. Pattern Recognit Lett. 2006:27. [Google Scholar]
- Gardner AB, Worrell GA, Marsh E, Dlugos D, Litt B. Human and automated detection of high-frequency oscillations in clinical intracranial EEG recordings. Clin Neurophysiol. 2007;118:1134–43. doi: 10.1016/j.clinph.2006.12.019. [DOI] [PMC free article] [PubMed] [Google Scholar]
- Gotman J, Wang LY. State dependent spike detection: validation. Electroencephalogr Clin Neurophysiol. 1992;83:12–8. doi: 10.1016/0013-4694(92)90127-4. [DOI] [PubMed] [Google Scholar]
- Jacobs J, LeVan P, Chander R, Hall J, Dubeau F, Gotman J. Interictal high-frequency oscillations (80–500 Hz) are an indicator of seizure onset areas independent of spikes in the human epileptic brain. Epilepsia. 2008;49:1893–907. doi: 10.1111/j.1528-1167.2008.01656.x. [DOI] [PMC free article] [PubMed] [Google Scholar]
- Jacobs J, Zelmann R, Jirsch J, Chander R, Dubeau CE, Gotman J. High frequency oscillations (80–500 Hz) in the preictal period in patients with focal seizures. Epilepsia. 2009;50:1780–92. doi: 10.1111/j.1528-1167.2009.02067.x. [DOI] [PMC free article] [PubMed] [Google Scholar]
- Jacobs J, Zijlmans M, Zelmann R, Chatillon CE, Hall J, Olivier A, et al. High-frequency electroencephalographic oscillations correlate with outcome of epilepsy surgery. Ann Neurol. 2010;67:209–20. doi: 10.1002/ana.21847. [DOI] [PMC free article] [PubMed] [Google Scholar]
- Jirsch JD, Urrestarazu E, LeVan P, Olivier A, Dubeau F, Gotman J. High-frequency oscillations during human focal seizures. Brain. 2006;129:1593–608. doi: 10.1093/brain/awl085. [DOI] [PubMed] [Google Scholar]
- Mari F, Zelmann R, Andrade-Valença L, Ayoubian L, Dubeau F, Gotman J. Continuous high frequency activity in mesial temporal lobe contacts: possible role as a neurophysiological marker of epileptogenicity. 2010 Annual Meeting of the American Epilepsy Society (AES2010); San Antonio, TX. 2010. [Google Scholar]
- Nagasawa T, Juhász C, Rothermel R, Hoechstetter K, Sood S, Asano E. Spontaneous and visually-driven high-frequency oscillations in the occipital cortex: intracranial recording in epileptic patients. Hum Brain Mapp. 2011 doi: 10.1002/hbm.21233. [DOI] [PMC free article] [PubMed] [Google Scholar]
- Rosso OA, Blanco S, Yordanova J, Kolev V, Figliola A, Schurmann M, et al. Wavelet entropy: a new tool for analysis of short duration brain electrical signals. J Neurosci Methods. 2001;105:65–75. doi: 10.1016/s0165-0270(00)00356-3. [DOI] [PubMed] [Google Scholar]
- Staba RJ, Wilson CL, Bragin A, Fried I, Engel J., Jr Quantitative analysis of high-frequency oscillations (80–500 Hz) recorded in human epileptic hippocampus and entorhinal cortex. J Neurophysiol. 2002;88:1743–52. doi: 10.1152/jn.2002.88.4.1743. [DOI] [PubMed] [Google Scholar]
- Staba RJ, Wilson CL, Bragin A, Jhung D, Fried I, Engel J., Jr High-frequency oscillations recorded in human medial temporal lobe during sleep. Ann Neurol. 2004;56:108–15. doi: 10.1002/ana.20164. [DOI] [PubMed] [Google Scholar]
- Staba RJ, Frighetto L, Behnke EJ, Mathern GW, Fields T, Bragin A, et al. Increased fast ripple to ripple ratios correlate with reduced hippocampal volumes and neuron loss in temporal lobe epilepsy patients. Epilepsia. 2007;48:2130–8. doi: 10.1111/j.1528-1167.2007.01225.x. [DOI] [PubMed] [Google Scholar]
- Urrestarazu E, Chander R, Dubeau F, Gotman J. Interictal high-frequency oscillations (100–500 Hz) in the intracerebral EEG of epileptic patients. Brain. 2007;130:2354–66. doi: 10.1093/brain/awm149. [DOI] [PubMed] [Google Scholar]
- Worrell GA, Gardner AB, Stead SM, Hu S, Goerss S, Cascino GJ, et al. High-frequency oscillations in human temporal lobe: simultaneous microwire and clinical macroelectrode recordings. Brain. 2008;131:928–37. doi: 10.1093/brain/awn006. [DOI] [PMC free article] [PubMed] [Google Scholar]
- Zelmann R, Zijlmans M, Jacobs J, Chatillon CE, Gotman J. Improving the identification of high frequency oscillations. Clin Neurophysiol. 2009;120:1457–64. doi: 10.1016/j.clinph.2009.05.029. [DOI] [PMC free article] [PubMed] [Google Scholar]
- Zelmann R, Mari F, Jacobs J, Zijlmans M, Chander R, Gotman J. Automatic detector of high frequency oscillations for human recordings with macroelectrodes. Conf Proc IEEE Eng Med Biol Soc. 2010;1:2329–33. doi: 10.1109/IEMBS.2010.5627464. [DOI] [PMC free article] [PubMed] [Google Scholar]
- Zijlmans M, Jacobs J, Zelmann R, Dubeau F, Gotman J. High-frequency oscillations mirror disease activity in patients with epilepsy. Neurology. 2009;72:979–86. doi: 10.1212/01.wnl.0000344402.20334.81. [DOI] [PMC free article] [PubMed] [Google Scholar]
- Zijlmans M, Jacobs J, Kahn Y, Zelmann R, Dubeau F, Gotman J. Ictal and Interictal high frequency oscillations in patients with focal epilepsy. Clin Neurophysiol. 2011;122(4):664–71. doi: 10.1016/j.clinph.2010.09.021. [DOI] [PMC free article] [PubMed] [Google Scholar]
Associated Data
This section collects any data citations, data availability statements, or supplementary materials included in this article.