

Abstract
Automatic detection of the nipple in mammograms is an important step in computerized systems that combine multiview information for accurate detection and diagnosis of breast cancer. Locating the nipple is a difficult task owing to variations in image quality, presence of noise, and distortion and displacement of the breast tissue due to compression. In this work, we propose a novel Hessian-based method to locate automatically the nipple in screen-film and full-field digital mammograms (FFDMs). The method includes detection of a plausible nipple/retroareolar area in a mammogram using geometrical constraints, analysis of the gradient vector field by mean and Gaussian curvature measurements, and local shape-based conditions. The proposed procedure was tested on 566 mammographic images consisting of 372 randomly selected scanned films from two public databases (mini-MIAS and DDSM), and 194 digital mammograms acquired with a GE Senographe 2000D FFDM system. A radiologist independently marked the centers of the nipples for evaluation of the results. The average error obtained was 6.7 mm (22 pixels) with reference to the center of the nipple as identified by the radiologist. Only two out of the 566 detected nipples (0.35 %) had an error larger than 50 mm. The method was also directly compared with two other techniques for the detection of the nipple. The results indicate that the proposed method outperforms other algorithms presented in the literature and can be used to identify accurately the nipple on various types of mammographic images.
Keywords: Digital mammography, Computer-aided detection and diagnosis, Breast imaging, Nipple detection, Image processing, Hessian
Introduction
Automatic identification of the nipple in mammograms is a fundamental step in the development of most algorithms that serve as an aid to radiologists in the interpretation of mammograms. Researchers have been developing advanced computerized techniques to achieve higher performance in terms of detection and diagnosis of subtle signs of breast cancer [1–9]. Such advanced approaches consist of multiple-view analysis of mammograms and can require point-based alignment and registration procedures in order to optimize comparison between image sequences. Possible applications of methods for detection of the nipple are as follows:
Matching candidate regions or objects for further analysis in different mammographic projections of the same subject [1–4].
Simultaneous analysis of the current and prior mammograms of the same subject to recognize changes in the breast [5, 10].
Bilateral comparison of the left and right breasts to analyze asymmetry and relative abnormalities as signs of breast cancer [6, 7].
Masking procedures aimed at reducing false-positive rates and maintaining high levels of sensitivity, via a systematic approach to the analysis of mammograms [11, 12].
Integration of lesion information acquired with different imaging modalities for improved diagnostic efficiency [8].
Content-based image retrieval for quantitative description of mammograms and for assessing measures of similarity [9].
The accuracy in the detection of the nipple is crucial, as it is the only consistent and stable landmark on a mammogram. Developing robust methods for identification of the nipple can improve the potential of multiview analysis of mammograms in improving the chances of survival of cancer patients. However, detection of the nipple is still a difficult task owing to variations in image quality, nipple position, and appearance in projected mammographic images. Compression applied during the examination can cause distortion of the breast tissue, resulting in retraction of the nipple. Changes in positioning of the breast can lead to displacement of the nipple. Moreover, the use of different mammographic acquisition techniques, such as screen-film mammography (SFM), full-field digital mammography (FFDM), and imaging devices that have different characteristics in terms of spatial resolution or contrast, can make the identification of the nipple difficult by using a single automatic procedure. Regardless, increasing usage of multiview systems indicates the need for a single algorithm that works with images acquired with different imaging modalities.
Prior Works
There are several methods proposed in the literature to identify the nipple in mammograms. One of the first attempts was made by Yin et al. [13], who considered the maximum of the average gray-level profile computed along a selected portion of the anterior border of the breast in order to locate the nipple and perform automated alignment of digitized mammograms. They reported a mean error of 10 mm over a total of 80 images.
Méndez et al. [14] combined the results obtained by maximizing the height of the breast border and the second derivative across the median-top section of the breast. The mean error reported in their study was 13.5 mm, using 156 images. Chandrasekhar and Attikiouzel [15] used a similar approach to locate the nipple. Even though they reported an error of less than 1 mm in 96 % of images, their method was tested on a small dataset consisting of 24 mammograms. They also mentioned that their method could fail when the nipple is noticeably recessed or when benign or malignant processes modify the intensity profile of the image.
Based on the convergence of the texture pattern towards the nipple, Zhou et al. [16] developed a method for texture orientation-field analysis to estimate the nipple location. They reported a mean error of 2.5 mm on 367 randomly selected digitized mammograms; however, 2.5 % of the cases had errors larger than 50 mm. Following a similar approach, Kinoshita et al. [17] developed a method for automatic detection of the nipple via image processing in the Radon domain. Their method was tested on a private dataset containing 1,080 digitized mammograms and provided an average error of 7.4 mm.
Iglesias and Karssemeijer [18] proposed a multiatlas algorithm capable of finding the nipple with a low number of outliers (0.13 % of cases had an error larger than 50 mm in a set of 2340 SFM images); they obtained a mean error of 12 mm. However, images that did not contain the nipple in their field of view were discarded during performance evaluation.
The location of the nipple, as proposed by van Engeland et al. [1], can be estimated as the point on the skin contour with the largest distance to the chest or the pectoral muscle. The method was described to have an average error of 14 mm on digitized mammograms [18], not considering images where the nipple was not in the field of view. To our knowledge, all of the available methods for the detection of the nipple have been developed only for and tested with digitized SFM images. However, FFDM is gradually replacing SFM, and the increasing need of comparison between mammograms will require robust procedures that are able to process mammograms acquired with different technologies.
Overview of the Method
This work proposes a method for automatic detection of the nipple which is applicable to any kind of mammographic image. Our procedure combines geometrical constraints with information on the gradient vector field (GVF). After automatic extraction of the breast region by identifying the breast skin profile in craniocaudal (CC) and mediolateral oblique (MLO) views, as well as the pectoral muscle in MLO views, the procedure for detection of the nipple is divided in two main steps: selection of a search region on the mammogram where the nipple is most likely to be located, and analysis of the second-order structure of the selected region by means of the eigenvalues of the Hessian matrix. The following assumptions, derived from observations on the location and pixel intensity distribution of the nipple/retroareolar area in mammograms, are made in this study:
The nipple is located near the breast skin line.
The nipple is located close to the farthest point on the skin line along the line perpendicular to the pectoral muscle (for MLO views) or to the chest wall approximated by the vertical edge of the breast image (for CC views).
The GVF locally converges at the center of the nipple.
The speed of convergence is approximately the same in every direction.
The first and second assumptions are used in the present work to extract a plausible nipple/retroareolar area (PNRA) on the mammogram by means of the breast skin line and the least-squares regression slope of the pectoral muscle (in MLO views). The last two assumptions on local GVF structure are used to select a cluster of pixels in the PNRA with certain specified properties in terms of intensity variations via mean and Gaussian curvature measurements as well as the condition number of the Hessian matrix. The centroid of the selected pixels is finally identified as the center of the nipple. Further details on the proposed procedure are provided in the following sections.
Materials
Three different databases of mammograms were used in this study. Digital mammographic images can be obtained directly using FFDM or by conventional SFM after digitalization. Such mammographic images exhibit different properties in terms of the relationship between pixel intensity and exposure of the X-ray detector, contrast, spatial resolution, and noise. In this work, a total of 566 mammographic images have been randomly selected from multiple sources, including FFDM and SFM.
The first database consists of 194 digital mammograms acquired with a GE Senographe 2000D FFDM system at the Diagnostic Radiology Unit, San Paolo Hospital of Bari, Italy. The dataset contains 102 CC views and 92 MLO views. The images have a resolution of 94 μm/pixel and 12 bits per pixel (bpp). Informed consent for anonymous use of sensitive data for scientific purposes has been obtained from all patients.
The second set consists of SFM images taken from two publicly available databases: the mini-MIAS database [19] and the DDSM database [20].
The mini-MIAS database includes 320 films (only MLO views) taken from the UK National Breast Screening Program and digitized originally to 50 μm/pixel and a gray-scale resolution equal to 8 bpp, with a Joice-Loebl scanning microdensitometer. The original database was then down-sampled to a resolution of 200 μm/pixel.
The DDSM database contains a total of 2620 images obtained from the Massachusetts General Hospital, Wake Forest University School of Medicine, Sacred Heart Hospital, and Washington University School of Medicine in St. Louis. The images have been digitized using four different scanners: the DBA M2100 ImageClear, Howtek 960, the Lumisys 200 Laser, and the Howtek MultiRad850, which have sampling rates equal to 42, 43.5, 50, and 43.5 μm/pixel, respectively, and gray-scale resolution equal to 12 bpp for the Howtek 960, Lumisys 200 Laser, and Howtek MultiRad850, and 16 bpp for the DBA M2100 ImageClear. Each study contains two MLO and two CC views. In the present work, 90 mammograms (MLO views) from the mini-MIAS database and 282 from the DDSM database, including 142 CC views and 140 MLO views, were randomly selected to test the proposed algorithm.
Table 1 summarizes the characteristics of the dataset, while Fig. 1 shows examples of mammograms from each of the three databases used in this work.
Table 1.
Dataset of mammograms used in this study
| SFM | FFDM | ||
|---|---|---|---|
| Database | mini-MIAS | DDSM | SAN PAOLO |
| Projections | MLO | CC and MLO | CC and MLO |
| Spatial resolution | 50 μm/pixel | {43.5, 50, 42} μm/pixel | 94 μm/pixel |
| Gray-level quantization | 8 bits | {12, 16} bits | 12 bits |
| Dimension | 1024 × 1024 pixels | variable | 2294 × 1914 pixels |
| Number of images | 90 | 282 | 194 |
Fig. 1.

Examples of mammograms from a the mini-MIAS, b DDSM, and c FFDM databases
The selected mammograms were annotated by an expert radiologist, who provided the ground truth for the nipple position using a graphical user interface; in cases where the nipple was nearly invisible, the radiologist provided an estimate of the location of the nipple.
Methods
The proposed procedure, as outlined in the flowchart in Fig. 2, can be divided into six steps, which are described in detail in the following six subsections.
Fig. 2.

Flowchart of the procedures used to detect the nipple in mammograms. GVF: gradient vector field, PNRA: plausible nipple/retroareolar area
STEP 1: Image down-sampling
In order to process the mammograms in the same way, all of the images were down-sampled to a spatial resolution of 300 μm/pixel using a bicubic interpolation method. The algorithm assigns to each of the output pixels a weighted average of pixel values in the nearest four-by-four neighborhood. The procedure could produce some values slightly outside the range [0, 1]; such pixels were set to the corresponding extreme value of the interval [0, 1].
STEP 2:Extraction of the PNRA
Even if the exact location of the nipple is not yet known, it is possible to define a region of the breast where the nipple is most likely to appear on the mammogram. Defining a small search region on the mammogram can reduce the chance of false detection of the nipple caused by noise, artifacts, or the presence of benign or malignant processes, as will be shown in “Results and Comparative Analysis”. We refer to this search region as the PNRA and define it so as to include the position of the nipple even in cases of retraction or displacement of breast structures. As mentioned in “Overview of the Method”, our hypothesis is that the nipple is located close to the farthest point on the skin line along the line perpendicular to the pectoral muscle (in MLO views) or to the chest wall (in CC views). Hence, localization of the PNRA requires extraction of the breast skin contour as well as estimation of the orientation of the pectoral muscle (for MLO views).
The method proposed by Ferrari et al. [21] was used in this work to detect the pectoral muscle profile using Gabor wavelets at 3 scales and 36 orientations. The strength of this method is the ability to detect curvilinear profiles, thus producing accurate estimation of the straight-line regression of the pectoral muscle. An approximate breast boundary was extracted by histogram-thresholding and the morphological operation of closing. Only the largest area in the result was retained, thus eliminating labels and other unwanted structures in the background. A localized version of the active contour model without edges, proposed by Chan and Vese [22], was used to refine the rough boundary of the obtained binary mask, thus producing the breast skin contour. An evaluation of the results of this procedure is provided by Mencattini et al. [23].
By knowing the orientation of the pectoral muscle (for MLO views) and the laterality of the mammograms, images of right breasts were mirrored about the vertical axis. All of the images and their binary masks were then rotated so that the chest wall or the pectoral muscle was at the bottom of the image and parallel to the horizontal axis. This step resulted in a 90° rotation for CC views and a (90 + α)° rotation for MLO views, where α is the angle between the vertical axis and the straight-line regression of the pectoral muscle. Figure 3a illustrates the result of extraction of the breast contour after the rotation step is applied. The area between the inner and the outer portions of the estimated breast skin line was selected by two 40-pixel vertical shifts applied to the breast contour (see Fig. 3b). The obtained region was further bounded by a horizontal line passing through the highest point of the inner contour, as shown in Fig. 3c.
Fig. 3.

a Rotation of the image and the relative breast contour with reference to the pectoral muscle orientation. The straight-line fit to the pectoral muscle is shown by the black dashed line. b Selection of the inner and the outer contours. c Extraction of the PNRA. d Result of top-hat filtering. e Result of Gaussian smoothing filtering (σ = 10 pixels). f Magnitude of the gradient
STEP 3: Morphological top-hat filtering
The morphological white top-hat filter was applied to the rotated mammograms in order to enhance the circular structures present in the breast while darkening the rest of the breast tissue. A disk-shaped structuring element with a radius of 30 pixels (9 mm) was used for this purpose (see an example in Fig. 3d).
STEP 4: Gaussian smoothing filtering
Images were filtered using a Gaussian filter with a standard deviation of 10 pixels (3 mm) to retain only low-frequency information (such as the core region of the nipple) and remove noise and fine structures (see Fig. 3e).
STEP 5: Analysis of the GVF
A common approach to analyze the local intensity behavior of a given image, I, is to consider the Taylor expansion in the neighborhood of a pixel x0:
 |
where Δx is a small increment about the pixel x0,  is the gradient vector, and ℋ is the Hessian matrix embedding the second partial derivatives of I as
 |
.
The second-order local structure of the image can be evaluated by analysis of the eigenvalues of the Hessian matrix.
The method described in this paper is inspired by the work of Wei et al. [24] and Mencattini and Salmeri [25], who used Hessian features to detect mass candidates. In this work, we developed a novel approach by considering measurements of the mean curvature (H) and the Gaussian curvature (K), which are the sum and the product of the two eigenvalues (k1 and k2) of the Hessian matrix.
Based on the signs of H and K, the local topographic structure of a given image can be determined as follows:
If K = 0 and H < 0 the topographic structure is ridge-shaped,
If K = 0 and H > 0 the topographic structure is valley-shaped,
If K = 0 and H = 0 the topographic structure is planar,
If K > 0 and H < 0 the topographic structure is ellipsoidal and peaked,
If K > 0 and H > 0 the topographic structure is ellipsoidal and cupped,
If K < 0 and H < 0 the topographic structure is a saddle, which is predominantly ridge-shaped,
If K < 0 and H > 0 the topographic structure is a saddle, which is predominantly valley-shaped.
In order to characterize the topographic structure of the PNRA, the magnitude of the gradient was first computed from the filtered image (see Fig. 3f), and then measurements of H and K were derived for each pixel of the PNRA. Moreover, the singular values of the Hessian matrix were also computed for each pixel of the PNRA with the aim of determining the isotropicity of the level lines of I in the neighborhood of x0, by means of the so-called condition number (CN), which is the ratio of the largest to the smallest singular values of the Hessian matrix:
 |
In particular, the condition CN = 1 corresponds to the center of a perfectly radially symmetric structure, while an elongated topographic structure has CN ≫ 1. Note that even though applying the filters only to the PNRA is computationally less expensive, in this work, the filters were applied to the whole image and then the measurements were derived for the PNRA, hence avoiding the problems related to the definition of its border and the extent of its effects. In fact, since the images were previously down-sampled and the optimization procedure is not the focus of this work, the difference in terms of computing time would be not significant.
STEP 6: Local shaped-based constraints
Based on the last two assumptions given in “Overview of the Method”, the nipple results in a locally ellipsoidal and peaked structure in which the local intensity of the gradient increases uniformly toward the center of the structure. Figure 4a illustrates a scaled version of the PNRA and the corresponding GVF that locally converges at the nipple. Note that the speed of convergence is almost uniform in every direction. In Fig. 4b, an example of the GVF for an elongated benign structure is given, in which the speed of convergence varies with the direction, decreasing along the direction of the maximum elongation of the structure.
Fig. 4.

a,b Zoomed view of the GVF superimposed on the structure of the nipple (a) and on a benign elongated structure in the mammogram (b). c,d Pixels satisfying conditions K > 0 and H < 0 (white and gray) and CN < 3 (white)
These assumptions led to the definition of local shaped-based constraints to select a cluster of pixels with the specified properties. In particular, constraints were placed so that the candidates had K > 0 and H < 0, hence belonging to a locally ellipsoidal and peaked structure. All of the pixels satisfying these two conditions are colored in white and gray within the white frame in Fig. 4c–d. Since the image value increases toward the center of the nipple but the slope is approximately the same in every direction, only pixels with CN < 3 were considered as possible candidates. In this way, pixels belonging to elongated and peaked benign structures, such as the one shown in Fig. 4b–d, were mostly rejected, retaining most of the ellipsoidal structures characteristic of the nipple. The constrained method yielded a map of disjoint regions, whose pixels satisfied all of the previously stated conditions. Such selected regions are shown in Fig. 5a. In order to reject candidates with a small area, the areas of all of the selected regions were computed and only the top 50 % in a ranked list in decreasing order of area were selected (see the selected areas in Fig. 5b). Among the remaining regions, the one with the maximum average Gaussian curvature was selected and its centroid was taken as the center of the nipple.
Fig. 5.
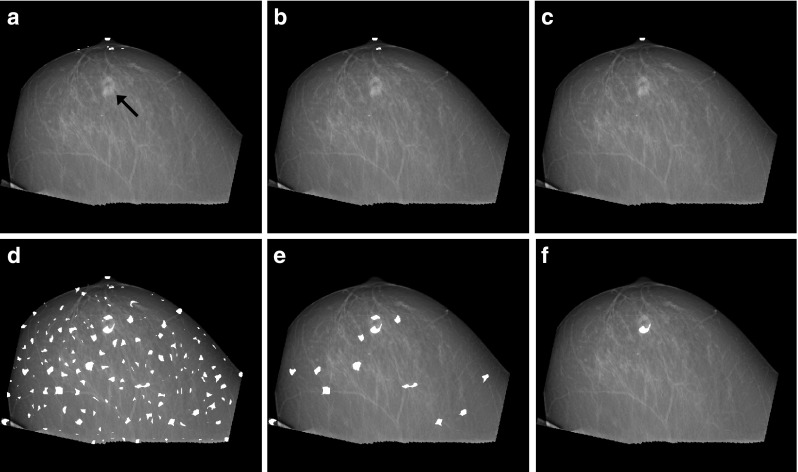
Maps of disjoint regions whose pixels satisfied the local shape-based conditions superimposed on the rotated version of mammogram with a malignant mass (indicated by the arrow). Results obtained with (a,b,c) and without (d,e,f) defining the PNRA. a,d Areas satisfying conditions K > 0 and H < 0 and with CN < 3. b,e Candidates after rejection of small regions. c,f Final candidate. The result in c is the desired response
Results and Comparative Analysis
The proposed algorithm was applied to three different types of mammograms, including SFM (mini-MIAS and DDSM) and FFDM images, taking into account the presence of noise, artifacts, and benign or malignant processes. As an example, results on the experiments performed on a mammogram in the presence of a malignant mass are shown in Fig. 5 in order to understand the key role of the PNRA in reducing the chance of false detection of the nipple. The local shape-based conditions were applied to the whole breast region after filtering, and the obtained results (see Fig. 5d) are compared with the results obtained by defining the PNRA (see Fig. 5a). The results show that while the geometrical constraints introduced with the PNRA reduce the number of candidates and lead to the detection of the nipple (Fig. 5c), in the case without the definition of a selected search area, the final candidate corresponds to the mass (Fig. 5f).
To evaluate the efficiency of the method, the Euclidean distance between the detected position and the center of the nipple as identified by the radiologist was computed. Figure 6 demonstrates the automatically obtained results with the proposed method for three images, along with the position of the nipple as marked by the radiologist. As it can be noticed, the proposed algorithm was able to locate the nipple both inside the breast profile (Fig. 6a) and on the profile (Fig. 6b–c). In cases where the nipple was nearly invisible and the radiologist provided an approximate position, our method was able to identify the nipple position within 10 mm from the manually marked center. This was mainly due to the efficacy of the geometric constrains placed on the PNRA.
Fig. 6.

Examples of detected nipples with the proposed method, one from each of the three databases of mammograms used in the present study: a FFDM image, error = 0 mm, b mini-MIAS image, error = 1.92 mm, and c DDSM image, error = 1.34 mm. Two points are shown on each mammogram corresponding to the nipple position detected automatically (square) and manually marked by the radiologist (star)
The results of the proposed method were compared with those provided by two other algorithms proposed by Kinoshita et al. [17] and van Engeland et al. [1], using the same dataset of images. Table 2 summarizes the comparative analysis. The results of the three methods are slightly better with CC views as compared to MLO views. This is due to the fact that all of the methods depend on accurate segmentation of the pectoral muscle in MLO views. Moreover, variations in the orientation of image acquisition (placement of the compressed breast in relation to the imaging platform) tend to make MLO images prone to alignment errors.
Table 2.
Performance of the automated nipple detection method
| Method | View | Number of images | Mean error (mm) | Maximal error (mm) | Detection accuracy | Number of outliers |
|---|---|---|---|---|---|---|
| The present study | MLO | 322 | 7.29 | 56.97 | 77.6 % (250/322) | 0.6 % (2/322) |
| van Engeland et al. [1] | MLO | 322 | 9.51 | 63.92 | 69.6 % (224/322) | 0.3 % (1/322) |
| Kinoshita et al. [16] | MLO | 322 | 16.52 | 88.31 | 44.4 % (143/322) | 3.4 % (11/322) |
| The present study | CC | 244 | 5.92 | 49.48 | 81.6 % (199/244) | – |
| van Engeland et al. [1] | CC | 244 | 6.68 | 32.15 | 80.7 % (197/244) | – |
| Kinoshita et al. [16] | CC | 244 | 8.90 | 48.73 | 72.2 % (176/244) | – |
| The present study | CC and MLO | 566 | 6.70 | 56.97 | 79.3 % (449/566) | 0.4 % (2/566) |
| van Engeland et al. [1] | CC and MLO | 566 | 8.28 | 63.92 | 74.4 % (421/566) | 0.2 % (1/566) |
| Kinoshita et al. [16] | CC and MLO | 566 | 13.23 | 88.31 | 56.4 % (319/566) | 1.9 % (11/566) |
The accuracy and the outliers are quantified as percentages of images in which the detected nipple location was, respectively, within 10 mm and over 50 mm of the center of the nipple as identified by the radiologist
Table 2 indicates the mean and the maximal errors, the detection accuracy, and the number of outliers in the results obtained. The detection accuracy refers to the percentage of images in which the nipple was identified within 10 mm from the manually marked center. Images that had an error larger than 50 mm are defined as outliers, but are included in the derived statistics.
The absolute error obtained by our method was, on the average, 6.7 mm over the 566 images processed, with a maximal error of 56.97 mm. Accurate identification of the nipple was achieved for 79.3 % of images.
Further comparison of the results of the three methods is provided in Figs. 7 and 8, as the histogram and cumulative distribution, respectively, of the Euclidean distance between the automatically detected nipple location and the manually marked center. It can be observed that the proposed method outperforms the method of van Engeland et al. [1] and the method of Kinoshita et al. [17]. The number of outliers is slightly higher (only one image) for the proposed method as compared to the results of the method of van Engeland et al. [1], but significantly lower compared to the results of the method of Kinoshita et al. [17]. Out of the 566 mammograms processed, the proposed method failed to detect the nipple in two cases (0.35 %), whereas the method of van Engeland et al. [1] and the method of Kinoshita et al. [17] failed to detect the nipple in 1 case (0.18 %) and 11 cases (1.94 %), respectively. The two images with the incorrectly detected nipple location are shown in Fig. 9. Both failures are due to substantial deformation of the breast in MLO views, which caused a mismatch between the true nipple position and the estimated PNRA.
Fig. 7.

Histogram of the Euclidean distance between the detected location of the nipple and the center of the nipple as identified by the radiologist. Results obtained using the methods of van Engeland et al. [1] and Kinoshita et al. [11] are included for comparison
Fig. 8.

Cumulative distribution function for the Euclidean distance between the detected location of the nipple and the center of the nipple as identified by the radiologist. Results obtained with the methods of van Engeland et al. [1] and Kinoshita et al. [16] are included for comparison
Fig. 9.

Two cases of failure of the proposed method: a error = 51.40 mm, b error = 56.97 mm. Two points are shown on each mammogram corresponding to the position of the nipple detected automatically (square) and manually marked by the radiologist (star)
A direct comparison with the other methods in the literature is not possible due to the use of different databases. However, a comparison in terms of performance is still possible. Yin et al. [13], Méndez et al. [14], and Iglesias and Karssemaijer [18] reported average errors larger than the error of 6.7 mm obtained in this study. The method by Zhou et al. [16], despite having a mean error of 2.5 mm, which is the best result quoted in the literature, results in an unacceptable number of outliers with large errors (2.5 % of the total compared to 0.35 % obtained in this work). Finally, Chandrasekhar and Attikiouzel [15] tested their method on only 24 mammograms.
Discussion
This paper presents a unique and fully automatic procedure that is capable of detecting the nipple on various types of mammographic images (SFM and FFDM images from multiple sources) without requiring any type of mapping specific to the imaging protocol (except spatial resolution). FFDM is gradually replacing SFM, and robust methodologies for multiview systems should consider both digital and digitized images; this requires the development of a unique procedure. The proposed method was evaluated in terms of the Euclidean distance between the automatically detected position and the center of the nipple as identified by the radiologist. Results and comparative analysis indicate that our method outperforms other algorithms presented in the literature.
The strength of our procedure is that it can detect the nipple even when the nipple is positioned within the breast profile. Another strength is the robustness of the proposed procedure to adverse conditions. The method was tested on a large set of mammograms, including the presence of noise, artifacts, and malignant processes. Experiments showed that the preliminary extraction of the PNRA reduces the chance of false detection of the nipple. Moreover, even when the nipple is nearly invisible on the mammogram, the PNRA provides a reasonable estimation of the nipple position. The main disadvantage of the proposed method is that it requires accurate estimation of the orientation of the pectoral muscle for MLO views to locate properly the PNRA. Substantial distortions of the breast during the imaging procedure can cause failure of the method because of mismatch between the true nipple position and the estimated PNRA. However, improper positioning of the breast during the imaging procedure is also the most frequently encountered problem by radiologists when interpreting mammograms.
Conclusions
A novel Hessian-based method for the detection of the nipple has been presented in this work. The local topographical structure of the PNRA was explored by means of the eigenvalues of the Hessian matrix. Measures of the mean and Gaussian curvature together with the condition number of the Hessian facilitate localization of the center of the nipple. The proposed algorithm was tested with images from three different databases of mammograms (mini-MIAS, DDSM, and FFDM). The high performance obtained on a large and diversified dataset indicates the robustness of the method. The proposed approach outperforms several previously reported methods in terms of the mean absolute error and accuracy, and can contribute to improved performance of advanced CAD systems.
Acknowledgments
We thank the Diagnostic Radiology Unit, San Paolo Hospital of Bari, Italy, for providing the digital mammograms used in this work and Dr. Paulo Mazzoncini de Azevedo Marques of the University of São Paulo, Ribeirão Preto, Brasil, for providing the code of the method of Kinoshita et al. [17] used for comparison.
Contributor Information
Paola Casti, Phone: +39-6-72597368, FAX: +39-6-62276659, Email: casti@ing.uniroma2.it, www.simplify.it.
Arianna Mencattini, Phone: +39-6-72597368, FAX: +39-6-62276659, Email: mencattini@ing.uniroma2.it.
Marcello Salmeri, Phone: +39-6-72597368, FAX: +39-6-62276659, Email: salmeri@ing.uniroma2.it.
Antonietta Ancona, Email: senologia.sanpaolo@asl.bari.it.
Fabio Felice Mangieri, Email: mangeri.fabio@libero.it.
Maria Luisa Pepe, Email: marialuisapep@libero.it.
Rangaraj Mandayam Rangayyan, Phone: +1-403-2206745, FAX: +1-403-2826855, Email: ranga@ucalgary.ca, http://www.enel.ucalgary.ca/People/Ranga/.
References
- 1.Van Engeland S, Timp S, Karssemeijer N. Finding corresponding regions of interest in mediolateral oblique and craniocaudal mammographic views. Med Phys. 2006;33(9):3203–3212. doi: 10.1118/1.2230359. [DOI] [PubMed] [Google Scholar]
- 2.Yuan Y, Giger ML, Li H, Sennett C. Correlative feature analysis on FFDM. Med Phys. 2008;35(12):5490–5500. doi: 10.1118/1.3005641. [DOI] [PMC free article] [PubMed] [Google Scholar]
- 3.Zheng B, Tan J, Ganott MA, Chough DM, Gur D. Matching breast masses depicted on different views: a comparison of three methods. Acad Radiol. 2009;16(11):1338–1347. doi: 10.1016/j.acra.2009.05.005. [DOI] [PMC free article] [PubMed] [Google Scholar]
- 4.Paquerault S, Petrick N, Chan HP, Sahiner B, Helvie MA. Improvement of computerized mass detection on mammograms: fusion of two-view information. Med Phys. 2002;29(2):238–247. doi: 10.1118/1.1446098. [DOI] [PubMed] [Google Scholar]
- 5.Rangayyan RM, Banik S, Desautels JEL. Computer-aided detection of architectural distortion in prior mammograms of interval cancer. J Digit Imag. 2010;23(5):611–631. doi: 10.1007/s10278-009-9257-x. [DOI] [PMC free article] [PubMed] [Google Scholar]
- 6.Rangayyan RM, Ferrari RJ, Frère AF. Analysis of bilateral asymmetry in mammograms using directional, morphological, and density features. J Electron Imaging. 2007;16(01):013003:1–013003:12. doi: 10.1117/1.2713759. [DOI] [Google Scholar]
- 7.Tzikopoulos SD, Mavroforakis ME, Georgiou HV, Dimitropoulos N, Theodoridis S. A fully automated scheme for mammographic segmentation and classification based on breast density and asymmetry. Comput Methods Programs Biomed. 2011;102(1):47–63. doi: 10.1016/j.cmpb.2010.11.016. [DOI] [PubMed] [Google Scholar]
- 8.Yuan Y, Giger ML, Li H, Bhooshan N, Sennett CA. Correlative analysis of FFDM and DCE-MRI for improved breast CADx. J Med Biol Eng. 2012;32(1):42–50. doi: 10.5405/jmbe.833. [DOI] [Google Scholar]
- 9.Kinoshita SK, de Azevedo-Marques PM, Pereira RR, Jr, Rodrigues JA, Rangayyan RM. Content-based retrieval of mammograms using visual features related to breast density patterns. J Digital Imaging. 2007;20(2):172–190. doi: 10.1007/s10278-007-9004-0. [DOI] [PMC free article] [PubMed] [Google Scholar]
- 10.Thomson JZ, Evans AJ, Pinder SE, Burrel HC, Wilson AR, Ellis IO. Growth pattern of ductal carcinoma in situ (DCIS): a retrospective analysis based on mammographic findings. Br J Cancer. 2001;85(2):225–227. doi: 10.1054/bjoc.2001.1877. [DOI] [PMC free article] [PubMed] [Google Scholar]
- 11.Tabàr L, Tot T, Dean P. Breast cancer, the art and science of early detection with mammography: perception, interpretation, histopathologic correlation. Stuttgart, Germany: Thieme; 2005. [Google Scholar]
- 12.Casti P, Mencattini A, Salmeri, M, Pepe ML, Mangieri F, Ancona A: Characterization of the breast region for computer assisted Tabar masking of paired mammographic images. CBMS 2012 25th International Symposium on
- 13.Yin FF, Giger ML, Doi K, Vyborny CJ, Schmidt RA. Computerized detection of masses in digital mammograms: analysis of bilateral subtraction images. Med Phys. 1991;18(5):955–963. doi: 10.1118/1.596610. [DOI] [PubMed] [Google Scholar]
- 14.Méndez AJ, Tahoces PG, Lado MJ, Souto M, Correa JL, Vidal JJ. Automatic detection of breast border and nipple in digital mammograms. Comput Methods Programs Biomed. 1996;49(3):253–262. doi: 10.1016/0169-2607(96)01724-5. [DOI] [PubMed] [Google Scholar]
- 15.Chandrasekhar R, Attikiouzel Y. A simple method for automatically locating the nipple on mammograms. IEEE Trans Med Imag. 1997;16(5):483–494. doi: 10.1109/42.640738. [DOI] [PubMed] [Google Scholar]
- 16.Zhou C, Chan HP, Paramagul C, Roubidoux MA, Sahiner B, Hadjiiski LM, Petrick N. Computerized nipple identification for multiple image analysis in computer-aided diagnosis. Med Phys. 2004;31(10):2871–2882. doi: 10.1118/1.1800713. [DOI] [PMC free article] [PubMed] [Google Scholar]
- 17.Kinoshita SK, Azevedo-Marques PM, Pereira RR, Rodrigues JAH, Rangayyan RM. Radon-domain detection of the nipple and the pectoral muscle in mammograms. J Digit Imaging. 2008;21(1):37–49. doi: 10.1007/s10278-007-9035-6. [DOI] [PMC free article] [PubMed] [Google Scholar]
- 18.Iglesias JE, Karssemeijer N. Robust initial detection of landmarks in film-screen mammograms using multiple FFDM atlases. IEEE Trans Med Imag. 2009;28(11):1815–1824. doi: 10.1109/TMI.2009.2025036. [DOI] [PubMed] [Google Scholar]
- 19.Suckling J, Parker J, Dance DR, Astley S, Hutt I, Boggis CRM, Ricketts I, Stamakis E, Cerneaz N, Kok SL, Taylor P, Betal D, Savage J. The Mammographic Image Analysis Society digital mammogram database. Exerpta Med Int Congr Ser. 1994;1069:375–378. [Google Scholar]
- 20.Heath M, Bowyer KW, Kopans D, Moore R, Kegelmeyer P Jr: The Digital Database for Screening Mammography. In: Proceedings of the 5th International Workshop on Digital Mammography (Toronto, Canada, 2000) Medical Physics Publishing, 2001, 212–218
- 21.Ferrari RJ, Rangayyan RM, Desautels JE, Borges RA, Frère AF. Automatic identification of the pectoral muscle in mammograms. IEEE Trans Med Imag. 2004;23(2):232–245. doi: 10.1109/TMI.2003.823062. [DOI] [PubMed] [Google Scholar]
- 22.Chan TF, Vese LA. Active contours without edges. IEEE Trans Image Process. 2001;10(2):266–277. doi: 10.1109/83.902291. [DOI] [PubMed] [Google Scholar]
- 23.Mencattini A, Salmeri M, Casti P, Pepe ML, Mangieri F, Ancona A. Local active contour models and Gabor wavelets for an optimal breast region segmentation. Int J Comput Assist Radiol Surg. 2012;7(1):256–257. [Google Scholar]
- 24.Wei J, Chan HP, Sahiner B, Zhou C, Hadjiiski LM, Roubidoux MA, Helvie MA. Computer-aided detection of breast masses on mammograms: dual system approach with two-view analysis. Med Phys. 2009;36(10):4451–4460. doi: 10.1118/1.3220669. [DOI] [PMC free article] [PubMed] [Google Scholar]
- 25.Mencattini A, Salmeri M. Breast masses detection using phase portrait analysis and fuzzy inference systems. Int J Comput Assist Radiol Surg. 2012;7(4):573–583. doi: 10.1007/s11548-011-0659-0. [DOI] [PubMed] [Google Scholar]