

Abstract
Context
Previous functional neuroimaging studies have identified a network of brain regions that process aversive stimuli, including anger. A polymorphism near the cyclic adenosine monophosphate response element binding protein gene (CREB1) has recently been associated with greater self-reported effort at anger control as well as risk for antidepressant treatment–emergent suicidality in men with major depressive disorder, but its functional effects have not been studied.
Objective
To determine whether this genetic variant is associated with altered brain processing of and behavioral avoidance responses to angry facial expressions.
Design and Participants
A total of 28 white participants (mean age, 29.2 years; 13 women) were screened using the Structured Clinical Interview for DSM-IV to exclude any lifetime Axis I psychiatric disorder and were genotyped for rs4675690, a single-nucleotide polymorphism near CREB1.
Main Outcome Measures
Blood oxygenation level–dependent signal by functional magnetic resonance imaging in the amygdala, insula, anterior cingulate, and orbitofrontal cortex during passive viewing of photographs of faces with emotional expressions. To measure approach and avoidance responses to anger, an off-line key-press task that traded effort for viewing time assessed valuation of angry faces compared with other expressions.
Results
The CREB1-linked single-nucleotide polymorphism was associated with significant differential activation in an extended neural network responding to angry and other facial expressions. The CREB1-associated insular activation was coincident with activation associated with behavioral avoidance of angry faces.
Conclusions
A polymorphism near CREB1 is associated with responsiveness to angry faces in a brain network implicated in processing aversion. Coincident activation in the left insula is further associated with behavioral avoidance of these stimuli.
A distributed set of brain structures has been implicated by functional neuroimaging studies1–4 in the processing of negative environmental stimuli,5 including facial expressions of anger, which healthy individuals exert significant efforts to avoid.5 Brain regions active during the visual processing of aversive stimuli include the amygdala,6–11 orbitofrontal cortex (FOC),1,2,5,8,11 insula,12 and anterior cingulate cortex.2,5,8,11 Amygdala involvement in the assessment of threat and stimulus relevance to survival is important for automatic unconscious processing.13 Densely interconnected with the amygdala and FOC,14,15 the insula has also been proposed to play a crucial role in processing and responding to aversive states.12
How activity across this network of brain structures that process aversion might be modulated is unknown. Converging lines of evidence suggest a role for the transcription factor cyclic adenosine monophosphate response element binding protein (CREB) in structures related to reward and aversion. The CREB gene product was initially shown to be central to the rewarding effects of cocaine and other drugs of abuse,16–21 including alcohol.22 More recently, a role in response to aversive stimuli has been proposed. For example, animal studies show that CREB-mediated transcription is increased in response to stressful stimuli.23,24 In humans, decreased CREB expression and activity has been reported in the prefrontal cortex of suicide victims.25,26
Consistent with a possible role in aversion, we have previously reported an association between a variation near the gene coding for CREB (CREB1; OMIM 123831) and greater effort at control of internal and external anger among men with major depressive disorder.27 A subsequent study found the allele associated with greater effort to control anger to be associated with a 3-fold increase in risk of suicidality during acute antidepressant treatment in patients with major depressive disorder. This single-nucleotide polymorphism (SNP) and those within CREB1 that are in linkage disequilibrium with it do not have obvious effects on transcription of the CREB protein.28
Examining intermediate phenotypes derived from neuroimaging has been proposed as a means of understanding the way in which a genetic variation mediates neural functioning.29 Therefore, we sought to examine the functional implication of this common variation in vivo. If participants with the T allele have reported greater effort to control their internal experience of anger, would this manifest as increased or decreased effort to avoid perceived anger during a behavioral task? In parallel, would perception of anger be associated with an increased or decreased blood oxygenation level-dependent (BOLD) signal by functional magnetic resonance imaging (fMRI) in those brain regions that have been shown to influence response to negative or aversive stimuli? While changes in CREB expression have been most directly demonstrated in the shell of the nucleus accumbens (NAc), amygdala, and (in humans) the prefrontal cortex, we hypothesized that the functional effects of these changes would not necessarily be limited to those structures, but via their projections be observed in other regions that process aversion. To compare these postulated effects with results from prior studies, we also examined the differential activation associated with a serotonin transporter (SLC6A4) promoter polymorphism (5HTTLPR) that has previously been shown to modulate amygdala activation to aversive faces.10
METHODS
PARTICIPANTS
The participants were 28 white adults (mean [SD] age, 29.2 [9.6] years; mean [SD] educational history, 15.3(0.43) years; 13 of 28 [46%] women; 27 of 28 [96%] right-handed) who were recruited by advertisements. Key-press data were available for a subgroup of these participants (n=16) with similar demographics (http://pgp.mgh.harvard.edu/PGP/Perlisetal_Aug2008.html, appendices, appendix 1). All participants underwent a clinical interview with a doctoral-level clinician that included the Structured Clinical Interview for Diagnosis for DSM-IV Axis I.30 Race was determined by self-identification on a standardized form.31 Participants also completed the Inventory of Depressive Symptoms–Self-Rated,32,33 the Edinburgh Handedness Inventory,34 and the Symptom Questionnaire (SQ),35 which includes a scale for hostile/angry symptoms. Eligible participants were aged 18 to 55 years, without any current or lifetime DSM-IV Axis I disorder or major medical illness known to influence brain structure or function, including neurologic disease, human immunodeficiency virus, or hepatitis C. All participants gave written informed consent prior to participation, and the protocol was approved by the institutional review board of Massachusetts General Hospital. Female participants underwent scanning during their midfollicular phase based on self-reported menstrual history, with confirmation at the time of scan based on an absence of progesterone surge on a urine assay. All participants were scanned at normal or corrected normal vision.
DATA ACQUISITION
Experimental Paradigm and Off-line Behavioral Testing
Two fMRI scans were acquired (8 minutes, 40 seconds each), consisting of 20-second blocks for 7 experimental conditions: angry, fearful, sad, neutral, and happy expressions, along with phase-scrambled stimuli and fixation. During each scan, the 7 conditions (blocks) were presented in a counterbalanced order (http://pgp.mgh.harvard.edu/PGP/Perlisetal_Aug2008.html, appendices, appendix 2). Each facial expression block included standardized images of the faces of 8 individuals (4 men)36 in pseudorandom order, displayed using parameters reported previously.5,6 Face stimuli were previously normalized at the Massachusetts Institute of Technology Media Laboratory6 (http://pgp.mgh.harvard.edu/PGP/Perlisetal_Aug2008.html, appendices, appendix 3).
Face stimuli were projected into the magnet bore as described previously.5,6 Participants were instructed to look at the faces, focusing on the center of the picture at the location of the crosshair. After scanning, participants performed 3 memory tasks to identify faces and facial expressions they had or had not seen (http://pgp.mgh.harvard.edu/PGP/Perlisetal_Aug2008.html, appendices, appendix 4). To be included in the cohort for fMRI analysis, participants had to score better than chance on all tests.
An off-line key-press task used the same set of faces as during imaging (http://pgp.mgh.harvard.edu/PGP/Perlisetal_Aug2008.html, appendices, appendix 5). This task examined the positive and negative valuation of emotionally expressive faces, which defined a participant’s relative preferences4 for these stimuli (ie, his or her utility for the set of faces3). It followed procedures resembling those reported previously with model and nonmodel faces4 and with angry and other facial expressions,5 with the key-press procedures implemented using Mat-Lab software (The MathWorks Inc, Natick, Massachusetts) on a PC device.
The dependent measure of interest was the amount of work in number of key presses, which participants traded for face-viewing time. Participants had a choice to do nothing (default condition), increase viewing time, decrease viewing time, or a combination of the 2 responses.3 Key-press results could be amalgamated as total viewing time relative to the default baseline, then used for regression analysis with fMRI data or for an analysis of variance with CREB1 genotype.
Magnetic Resonance Imaging
Magnetic resonance imaging (MRI) was performed on a 3-T MAGNETOM Trio (Siemens, Malvern, Pennsylvania) system using an 8-channel phased-array receive-only radiofrequency coil. Participants’ heads were stabilized using foam pads and adjustable paddles fixed to the radiofrequency coil assembly. The BOLD functional images were acquired using gradient-echo echoplanar imaging (time to repetition/echo time/α,2.5 seconds/30 milliseconds/90°; resolution, 3.125 mm × 3.125 mm× 3 mm) with slices situated parallel to the intercommissural line and parallel to the inside curve of the FOC to minimize signal distortion in this region.37 Structural images were acquired using a high-resolution T1-weighted magnetization-prepared rapid acquisition gradient echo sequence (192 sagittal slices over the full head volume; matrix, 224×256; field of view, 224×256 mm2; thickness, 1 mm; no gap) before functional scanning.
Genotyping
Genomic DNA was extracted from blood samples through use of a Nucleon II DNA extraction kit (Amersham Pharmacia Biotech, Piscataway, New Jersey), quantified using a NanoDrop ND-1000 Spectrophotometer (NanoDrop Technologies Inc, Wilmington, Delaware), and diluted to 3.0 ng/μL before creating 96-well polymerase chain reaction source plates.
Genotyping of the rs4675690 SNP was performed using the methods previously described.38 Primers were designed using SpectroDESIGNER software (Sequenom, San Diego, California). Polymerase chain reaction amplification was performed, followed by homogeneous MassEXTEND reaction (Sequenom). Samples were analyzed in automated mode by a MassARRAY RT mass spectrometer (Sequenom).39 The resulting spectra were analyzed by SPECTROTYPER software (Sequenom) after baseline correction and peak identification. The degree of linkage disequilibrium between this SNP and additional SNPs within CREB1 have been previously described.28
Genotyping of 5HTTLPR was performed by polymerase chain reaction at the Center For Human Genetic Research Genotyping Resource (http://pgp.mgh.harvard.edu/PGP/Perlisetal_Aug2008.html, appendices, appendix 6). Data were analyzed with GeneMapper version 3.7 software (Applied Biosystems, Foster City, California). Genotyping of HTTLPR yielded fragments of 483 and 529 base pairs, representing short (s) and long (l) alleles, respectively. All participants were genotyped successfully at both 5HTTLPR and rs4675690, and allele frequencies did not deviate significantly from Hardy-Weinberg equilibrium. Concordance for duplicate DNA was 100%; previous work in our laboratory using intraplate and interplate control samples yielded error rates of less than 0.1%.
DATA ANALYSIS
Primary analyses used 2-group contrasts based on rs4675690 genotype groups (TT vs C carriers) (1) to ensure balanced groups, given known allele frequencies in white Europeans, (2) to be consistent with multiple possible models of effect, and (3) to maximize comparability with prior work and with our SLC6A4 analyses.
Sociodemographic, Clinical, and Memory Measures
The genotype groups were compared in terms of sociodemographic or clinical features and performance on the face-recall task using the Fisher exact test for dichotomous measures or the Mann-Whitney U test for continuous measures.
Magnetic Resonance Imaging
We first performed 3 2-way associations between (1) CREB1 (rs4675690) or 5HTTLPR genotype with fMRI data (CREB1-fMRI), (2) key-press behavior of relative preference with fMRI data (RP-fMRI), and (3) CREB1 or 5HTTLPR genotype with key-press behavior. The MRI associations from the CREB1-fMRI and RP-fMRI analyses were then assessed to determine if these 2-way associations were related (ie, a 3-way association between genotype, fMRI, and key-press data [http://pgp.mgh.harvard.edu/PGP/Perlisetal_Aug2008.html, appendices, appendix 7]).
MRI Signal Processing
After automated tissue stripping and discarding of dummy volumes, estimated residual motion artifacts in the form of voxel unalignment were assessed for all runs using the Analysis of Functional NeuroImages motion-correction module. Residual misalignment had to meet 2 conservative criteria, and remaining participants then had to meet criteria, ruling out susceptibility artifacts in the FOC, amygdala, and NAc (http://pgp.mgh.harvard.edu/PGP/Perlisetal_Aug2008.html, appendices, appendix 8).
The remaining participants were entered into a set of signal-processing steps using a workflow-control system (http://pgp.mgh.harvard.edu/PGP/Perlisetal_Aug2008.html, appendices, appendix 9) wrapping the platform of the Functional Magnetic Resonance Imaging of the Brain (FMRIB) software library (FSL version 3.3; University of Oxford FMRIB Analysis Group, Oxford, England). Data from these participants underwent 3 steps: (1) image realignment through the motion correction using FBRIB’s Linear Image Registration Tool within FSL, (2) spatial smoothing with a 3-dimenisonal Gaussian kernel (full-width at half maximum, 7 mm3), and (3) temporal smoothing using a high-pass filter. The FMRI Expert Analysis Tool within the FSL platform was used for steps 2 and 3.
MRI Statistical Analysis
Per participant, each image series was fit using a linear signal model with regressors of interest for which intervals of face presentation were represented by square pulses (blocks) relative to fixation (http://pgp.mgh.harvard.edu/PGP/Perlisetal_Aug2008.html, appendices, appendix 10). For RP-fMRI, the height and valence of each block was scaled for each participant to be proportional to his or her deviation from default viewing time (which could be positive or negative, depending on the key used) for that face expression category. Customized square waveforms were then convolved with a double-γ hemodynamic response function and used in FMRIB’s Improved Linear Model with local autocorrelation correction to estimate hemodyamic parameters for 1 explanatory variable (for the angry vs fixation conditions) along with regressors of no interest (ie, other emotional expressions vs fixation).
For CREB1-fMRI, each image series was fit per participant, with regressors of interest representing the intervals of face presentation by square pulses (blocks) relative to fixation (independent of the participant’s key-press results). These invariant square waveforms were then convolved with a double-γ hemodynamic response function and used in FMRIB’s Improved Linear Model to estimate hemodyamic parameters for 1 explanatory variable and regressors of no interest (other emotional expressions).
Each participant’s echoplanar imaging scans were spatially normalized using his or her T1-weighted structural scans, the International Consortium for Brain Mapping (ICBM)–152 T1 template and FMRIB’s Linear Image Registration Tool. After transformation to ICBM152 space, the effect standard error pairs for both image series were pooled using a fixed-effects model to produce a single pair of statistical images. For the RP-fMRI analysis, the summary statistical results from all participants in the cohort were then pooled using a mixed-effects model by FMRIB’s Local Analysis of Mixed Effects Stage 1 module. For the CREB1-fMRI analysis, this process involved a level 2 contrast of the TT vs CT or CC genotype groups for CREB1 and contrast of the “long/long” vs “long/short” or “short/short” groups for 5HTTLPR.
MRI Analysis of A Priori Anatomic Regions of Interest
Within 4 a priori regions of interest (amygdala, insula, anterior cingulate, and FOC), foci of BOLD response were identified from CREB1-fMRI and RP-fMRI analyses with the angry face condition as an a priori target and 4 other face expressions as post hoc concerns (http://pgp.mgh.harvard.edu/PGP/Perlisetal_Aug2008.html, appendices, appendix 11). Gaussian random field theory40 was used to estimate the cluster volume and voxelwise thresholding needed to survive a clusterwise P<.05 (corrected); namely, 40 voxels with an effective threshold of P<.003 per voxel (0.05/16 [4 a priori regions × 2 hemispheres × 2-tailed comparisons]). For post hoc analysis of the 4 other face expressions, cluster volume and thresholding needed to survive a more conservative clusterwise P <.05/4 = 1.25 × 10⁻² (corrected).
To determine whether clusters with 2-way interactions found for CREB1-fMRI and RP-fMRI were independent or related, 4 further analyses were performed. First, colocalization of CREB1-fMRI foci and RP-fMRI foci was quantified in a priori regions. Second, the effect size of the CREB1-fMRI association at foci colocalizing between CREB1-fMRI and RP-fMRI was quantified to verify the CREB1-fMRI interaction using nomial-by-interval association η.41 The third procedure estimated effect size between CREB1-fMRI signal and relative preference behavior using Pearson product moment correlations. If an effect size supporting a 3-way association was observed, a fourth procedure was performed using the output of the RP-fMRI analysis as an input to a contrast of the TT vs CT or CC genotype groups for CREB1. Combined, these criteria represent a conservative extension of association procedures in imaging genetics.10,42–44 An analogous approach was applied to examine the association between fMRI of emotional expressions and 5HT-TLPR and its overlap with RP-fMRI.
The probability range affiliated with colocalization of distinct statistical maps was estimated as described in appendix 11 (http://pgp.mgh.harvard.edu/PGP/Perlisetal_Aug2008.html, appendices). If 2 colocalizing regions share 5 contiguous voxels, this amounts to a probability range of (1.3×10⁻⁴)5<P<1.3×10⁻⁴ regarding the likelihood of this being a false-positive result.
Anatomic Localization of A Priori Anatomic Regions of Interest
Foci of significant change in the RP-fMRI and the CREB1-fMRI analyses were identified within semiautomated segmentation volumes of the ICBM152 T1 brain (http://pgp.mgh.harvard.edu/PGP/Perlisetal_Aug2008.html, appendices, appendix 12). A priori and post hoc brain regions were segmented and parcellated as individual structures,45–50 producing core files that could be overlaid on statistical volumes for localization purposes.
RESULTS
Data are organized in 7 sections for 2-way associations (first through fourth), 3-way associations (fifth), and follow-up analyses with clinical indices or 5HTTLPR.
ASSOCIATION OF CREB1 WITH CLINICAL MEASURES
Distribution of genotypes at rs4675690 among participants was 10 of 28 (36%) TT, 12 of 28 (43%) TC, and 6 of 28 (21%) CC; minor allele frequency (for T) was 46%, comparable with that of the entire neuroimaging cohort (45%). The TT vs C carriers (TC and CC) were not statistically different in age, sex, handedness, years of education, or severity of depressive symptoms by Quick Inventory of Depressive Symptomatology (Self-Reported) (all P>.05). The TT group had significantly greater scores on the anger/hostility subscale of the SQ (Table 1).
Table 1.
Clinical and Sociodemographic Features of Participants by rs4675690 Genotype
| Feature | Mean (SD)
|
Mann-Whitney U | P Value | |
|---|---|---|---|---|
| CC or CT (n=18) | TT (n=10) | |||
| Female, No. (%) | 7 (39) | 6 (60) | Exact | .43 |
| Right-handed, No. (%) | 17 (94) | 10 (100) | Exact | .99 |
| Age, y | 30.1 (10.9) | 27.6 (6.9) | 88.5 | .94 |
| Education, y | 14.8 (1.9) | 16.6 (2.4) | 45.0 | .07 |
| QIDS-SR score | 3.1 (3.1) | 4.1 (4.4) | 77.0 | .71 |
| SQ hostility score | 0.5 (1.0) | 2.5 (2.5) | 36.5 | .01 |
| SQ anxiety score | 1.1 (1.2) | 2.4 (2.4) | 61.5 | .18 |
Abbreviations: QIDS-SR, Quick Inventory of Depression Symptoms; SQ, symptom questionnaire.
ASSOCIATION BETWEEN CREB1 AND fMRI (CREB1-fMRI)
Contrast between genotypes for activation to angry faces revealed significant BOLD signal differences in the bilateral insula (Figure 1A; Table 2) but not in other regions of interest. These foci reflected lower BOLD signal in the C-carrier group vs the TT group. Post hoc analysis of the NAc showed no significant effects in right (z=−1.92; uncorrected P=.05) or left (z=−1.70; uncorrected P=.09) nuclei.
Figure 1.

Results of relative preference–functional magnetic resonance imaging (RP-fMRI) and CREB1-fMRI analyses. A, Contrast by rs4675690 genotype for fMRI data (threshold uncorrected voxelwise P <.01). B, Regression of key-press data to fMRI data (threshold uncorrected voxelwise P <.01). Averaged T1 structural images that have been normalized into the International Consortium for Brain Mapping–152 space are shown in gray tone beneath segmentation templates for the left insula (dark blue), as coronal slices with the anterior-posterior y-coordinate show. Superimposed on these segmentation templates are pseudocolor statistical maps (red and yellow). Explicit overlap in these pseudocolor statistical maps across multiple slices can be observed in the insula snapshots on the lower right, indicating a 3-way association. C, Percentage of signal change in the left insula by rs4675690 genotype.
Table 2.
Peak Differential Activation to Emotional Faces in Regions of Interest
| ROI | fMRI and CREB1
|
fMRI and RP
|
||||||||||||||
|---|---|---|---|---|---|---|---|---|---|---|---|---|---|---|---|---|
| Condition | x a | y a | z a | z Scoreb | P Value | Valence of Subtraction | APc vs PHd | Condition | x a | y a | z a | z Scoreb | P Value | Valence of Regression | APc vs PHd | |
| Left amygdala | Happy | −22 | −6 | −20 | 4.41 | 1 × 10⁻⁵ | − | AP | … | |||||||
| Left FOC | … | Fearful | −32 | 18 | −16 | 4.55 | 5 × 10⁻⁶ | + | AP | |||||||
| Left INS | Angry | −38 | −4 | 0 | 3.97 | 7.1 × 10⁻⁵, e | − | PH | Angry | −40 | −6 | −2 | 3.86 | 1.13 × 10⁻⁴, e | + | AP |
| Fearful | −36 | −10 | 16 | 3.84 | 1.22 × 10⁻⁴ | − | PH | Fearful | −28 | 12 | −14 | 4.00 | 6.2 × 10⁻⁵ | + | AP | |
| Sad | −34 | −10 | 16 | 4.40 | 1.0 × 10⁻⁵ | − | AP | … | ||||||||
| Left anterior cingulate | … | Happy | −8 | 12 | 34 | 3.91 | 1.0 × 10⁻⁴ | + | AP | |||||||
| Right amygdala | … | … | ||||||||||||||
| Right FOC | … | Fearful | 26 | 16 | −16 | 4.29 | 1.8 × 10⁻⁵ | + | AP | |||||||
| Sad | 26 | 16 | −16 | 3.56 | 3.7 × 10⁻⁴ | + | AP | |||||||||
| Neutral | 48 | 32 | −16 | 3.55 | 3.9 × 10⁻⁴ | + | AP | |||||||||
| Right INS | Angry | 38 | 0 | 2 | 3.39 | 7.02 × 10⁻⁴ | − | AP | … | |||||||
| Fearful | 38 | 2 | 2 | 3.79 | 1.5 × 10⁻⁴, e | − | PH | Fearful | 30 | 24 | −2 | 3.59 | 3.32 × 10⁻⁴, e | − | AP | |
| Neutral | 38 | 0 | 2 | 3.65 | 2.65 × 10⁻⁴ | − | AP | … | ||||||||
| Right anterior cingulate | … | Sad | 8 | 38 | 20 | 3.96 | 1.0 × 10⁻⁴ | + | AP | |||||||
Abbreviations: AP, a priori; CREB1, cyclic adenosine monophosphate response element binding protein gene; ellipses, no data; fMRI, functional magnetic resonance imaging; FOC, orbitofrontal cortex; ICBM, International Consortium for Brain Mapping; INS, insula; PH, post hoc; ROI, region of interest; RP, relative preference; −, negative valence to the genotype-based subtraction or key press–based regression; +, positive valence to the genotype-based subtraction or key press–based regression.
Variables x, y, and z refer to coordinates of peak differential activation in ICBM152 space.
Absolute z score.
Activation survives clusterwise AP correction, P <.05.
Activation survives clusterwise PH correction, P <.05/4.
These indicate colocalizing activations beyond 5 voxels.
Meeting the post hoc threshold, the rs4675690 genotype was associated with lower BOLD signal for C-carrier participants than for those with the TT genotype for fearful expressions in the bilateral insula (Figure 2). Similar effects that only met the a priori correction were noted in response to sad faces in the left insula, neutral faces in the right insula, and happy faces in the left amygdala (Table 2).
Figure 2.
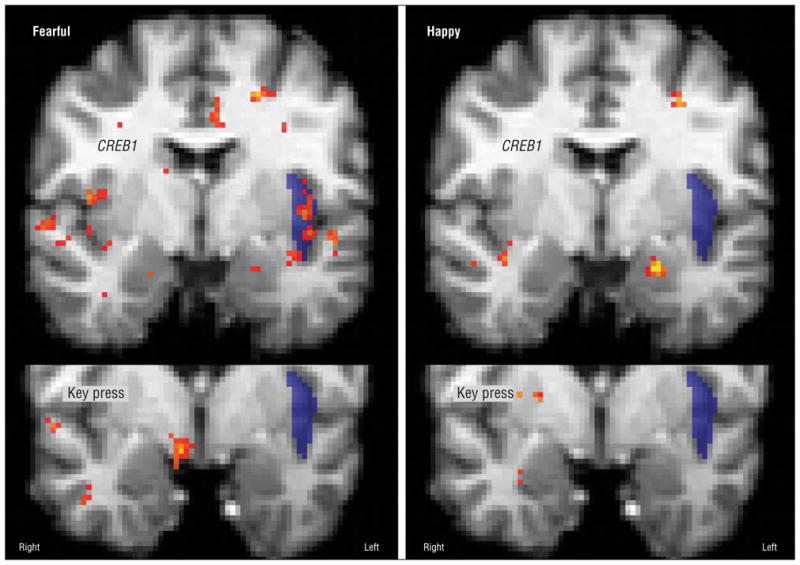
Key-press regression and genotype subtraction with functional magnetic resonance imaging data for fearful and happy faces. Note the lack of colocalization in the left insula.
No significant differences in recall accuracy (all P>.1) were detected between genotype groups for face identity, identity and expression, or expression alone (http://pgp.mgh.harvard.edu/PGP/Perlisetal_Aug2008.html, appendices, appendix 4).
ASSOCIATION BETWEEN RELATIVE PREFERENCE KEY PRESSING AND fMRI (RP-fMRI)
Regression of key-press responses to angry faces (Figure 3) with fMRI BOLD signal revealed significant effects in the left insula (Table 2; Figure 1B). Effects in the left insula reflected increasing negative key presses (to avoid viewing a stimulus) in association with more negative BOLD signal change. Post hoc analysis of the NAc showed no significant effects in right (z=−2.05; uncorrected P=.04) or left (z=−1.56; uncorrected P=.12) nuclei.
Figure 3.

Experimental design of key-press procedure. Drawing at top and plots below schematize the experimental design, its output data, and 1 type of data summary. The drawing illustrates the 4 potential responses to increase, decrease, variably increase or decrease, or accept the default viewing time of 8 seconds. The default condition controls for those who intended to press the key to increase or decrease viewing time, but who did not act on this intention. This model integrates the stimulus presentation and the time course of potential responses by participants. The traces of individual responses to each picture are shown with raster plots from an anonymous participant in the lower left. Each time interval during which this subject viewed a particular stimulus is indicated by a pink color bar, above which is a blue trace of actual key-press data set to the default baseline for viewing. The bar graph shows summary data (location and standard errors) for the different facial expressions. All responses in the graph are coded as time alterations from the default. * Indicates fixation point.
Eight other foci of association were noted in the 4 regions, although these foci only met the a priori and not the post hoc correction (Table 2). Seven of these reflected increasing negative key-press responses in association with a more negative BOLD signal.
ASSOCIATION BETWEEN CREB1 AND RELATIVE PREFERENCE KEY PRESSING
No significant association was observed between rs4675690 genotype and measures from the relative preference task for angry faces (total viewing time, key-press increases, or key-press decreases [all F<1.5; P>.05]). Estimation of effect size between rs4675690 genotype and anger viewing time was less than 1% (η2,16=0.1; P >0.1). Although qualitative differences were apparent (Figure 4), no significant relationships, after correction for multiple comparisons, were noted between CREB1 genotype and viewing time or key-press responses for fearful, sad, neutral, or happy faces (all F<1.5; P>.05, excepting happy viewing time where F2,16=2.23; P =.02).
Figure 4.

Viewing time changes in seconds from the default condition are shown for each of 5 facial expressions. The effects of CREB1 genotype are juxtaposed for each category of facial expression. Qualitatively, C-carrying participants tend to key press more to avoid aversive expressions (angry, fearful, sad) and to approach positive expressions (happy).
THREE-WAY ASSOCIATION BETWEEN CREB1 GENOTYPE, fMRI, AND RELATIVE PREFERENCE KEY PRESSING
Two foci demonstrated significant colocalization of CREB1-fMRI and RP-fMRI outcomes. In the left insula, 8 coinciding voxels displayed significant association with both genotype and key-press efforts to reduce the viewing of angry faces (Figure 1A and B). The probability of random overlap of this size across a priori regions is (1.3×10⁻⁴)8<P<1.3×10⁻⁴. Inspection of the data revealed that C carriers have more negative fMRI signals to angry faces relative to fixation in the left insula than participants with the TT genotype (Figure 1C). There is a mean negative signal shift from baseline for angry faces across the total cohort of 28 participants. The regression of key-press to angry-face fMRI response shows that increasing negative key pressing (to reduce viewing of angry faces) is associated with decreasing BOLD signal from baseline.
In the right insula, 11 coinciding voxels (broken into 1 group of 5 voxels and a second group of 6 voxels) displayed significant association with both genotype and effort to reduce the viewing of fearful faces. The probability of a random overlap of this size across a priori regions is (1.3×10⁻⁴)6<P<1.3×10⁻⁴. For this region of overlap, C carriers have a lower fMRI signal to fearful faces than participants with the TT genotype, producing a negative subtraction result (ie, −z). The regression of key pressing to fearful-face fMRI response indicates that key pressing to reduce the viewing of fearful faces is associated with increasing BOLD signal from baseline.
The effect size for the left insula (angry) focus was 21.2% (η2,26=0.460; P <.014), whereas for the right insula (fearful) focus, it was 36.5% (η2,26=0.604; P <.001). Estimation of the effect size of interaction between CREB1-fMRI signal and key-press behavior (ie, as between data in the graph in Figure 1 and key-press data in Figure 4) was approximated by Pearson product moment correlations. These showed an effect size of 21.9% for the left insula (angry) focus (r2,16=0.47; P <.068) and less than 1% for the right insula (fearful) focus (r2,16<0.1; P >0.1). Thus, the CREB1-fMRI and RP-fMRI colocalization was supported for the left insula (angry) site but not for the right insula (fearful) site.
As a follow-up analysis of 3-way association, we used the output of the RP-fMRI analysis as an input to a contrast of the TT vs CT or CC genotype groups for CREB1, and found 1 significant focus (z = 3.56; uncorrected P <3.7 × 10⁻⁴), which colocalized with the left insula (anger) results from the CREB1-fMRI and RP-fMRI analyses.
To assess potential sensitization of fMRI signals in the insula5 (as opposed to habituation in the amygdala6,51), we assessed fMRI adaptation dynamics to angry faces in the left insula. Both C-carriers and those with a TT genotype evidenced sensitization of signal in the left insula to angry faces over the course of the experiment (both <1%), and there was not a significant difference between groups (t2,26<1.0; P >.1).
RELATIONSHIP BETWEEN COLOCALIZING REGIONS OF CREB1-fMRI AND RP-fMRI, WITH CLINICAL VARIABLES
Across 3 clinical variables (Inventory of Depressive Symptoms–Self-rated, SQ depression, and SQ anger), activation in the left insula (angry) focus was associated only with SQ depression (r2,26 = 0.495; P < .007) after correction for multiple comparisons (P <.05/6 tests [.008]). In the right insula (fearful) focus, correlations were observed for the SQ depression (r2,26 = 0.571; P <.002) and SQ anger (r2,26 = 0.549; P < .003) measures. Independent correlation of SQ anger with anger key pressing across participants was not significant (r2,16=−0.127; P >.05).
COMPARATIVE ANALYSES WITH SLC6A4
In the comparison of individuals with 2 copies of the “long” allele (n=13) to all others (n=15), consistent with prior studies,10 no subtraction foci for SLC6A4 met the clusterwise threshold used with CREB1 data, although trends toward significant effects were noted in the left amygdala (z=3.49; P=5×10⁻⁴ [uncorrected]; −20, −4, −24 [x, y, z]; 13 voxels at P <.003) and right insula (z=3.31; P=9×10⁻⁴ [uncorrected]; 36, −6, 2 [x, y, z]; 13 voxels at P<.003). These foci suggested a higher BOLD signal for the participants with at least 1 “short” allele. Also, as expected, there was no association between genotype at SLC6A4 and CREB1 (Fisher exact P=.42).
COMMENT
Our results suggest that a CREB1-linked polymorphism is associated with the responsiveness of a network of brain regions that have been implicated in detection of and response to aversive stimuli. Individuals who are homozygous for the T allele of rs4675690 display less negative BOLD signals than C carriers in the insula bilaterally for angry and fearful faces. Although not surviving post hoc correction, similar effects between TT and C carriers were observed for happy expressions in the amygdala and sad and neutral ones in the insula. Likewise, an association between more negative BOLD signal and stronger key-press responses to avoid angry faces was observed in a left insular focus that colocalized with a focus of BOLD signal difference by CREB1 genotype. The interaction of these colocalizing foci was confirmed (1) by a correlation analysis showing an effect size of 21.9% between (a) key-press behavior and (b) fMRI signal from the contrast activation associated with CREB1 genotype, and (2) by a significant 3-way association between anger key-press data, left insula BOLD signal, and CREB1 genotype. Together these observations point to a finding that is specific to anger and not to other facial expressions.
The insula has been shown to exhibit differential activation in response to emotionally expressive faces52 and angry hand gestures.53 A recent review proposes that the insula and connected regions (ie, amygdala and FOC) are central to a network that detects and responds to aversive stimuli.12 This network is associated with anticipation of aversive states related to pain54 or the viewing of aversive pictures.11 It is also implicated in the neuroanatomy of anxiety.55–57
In a post hoc analysis, we did not identify significant CREB1 interaction with NAc activation. A number of recent studies connect preference assessments with both NAc and insula activation58,59 during human decision making. Changes in CREB expression or phosphorylation in the NAc have been consistently associated with models of dysphoria or aversive states in animals.60–62 However, our results are still consistent with a model in which changes in CREB in the NAc may be reflected in the activity of other structures within the reward/aversion network.1–4
The present findings build on 2 previous association studies that reported consistent effects for rs4675690 near CREB1. The T allele in rs4675690 was associated with greater internal effort at anger control,27 greater risk of treatment-emergent suicidality in major depressive disorder,28 and in the present study, reduced negative BOLD signal in the left insula when viewing angry faces, with reduced key pressing to avoid exposure to them. In general, TT homozygotes produced fewer approach or avoidance key-press responses for any emotion. Together, these findings suggest a hypothesis of increased suppression of neural and behavioral responses to anger with the T allele.
In this study, a genetic variation also implicated in stress response and mood reactivity, 5HTTLPR,10 was modestly associated with effects that were unrelated to CREB1 effects. Increased right amygdala activation has been reported in individuals with the “short” allele when viewing aversive faces.10 Our results are qualitatively similar though of lesser magnitude.
The insula and amygdala have been implicated with both reward and aversion processing.63,64 The interaction of CREB1 genotype with BOLD signal in the insula, overlapping and correlating with the association of key-press responses to angry faces and insula BOLD signal, represents a genetic association with a microeconomic task.63,64 In general terms, this means that variation in CREB1 is associated with judgment and decision making2,3,58,63,64 during a paradigm that requires normal controls to weigh different options and express specific preferences based on relative valuation of stimuli.4
A limitation in the present study is that the function at a molecular level of rs4675690 has not been established. We hypothesize that, because CREB1 is such a central gene in signal transduction, common polymorphisms with large effects on expression would likely have diverse effects not limited to phenotypes such as response to aversive faces. We know that rs4675690 is in linkage disequilibrium with multiple other SNPs in and near CREB1, which may exert more subtle effects on regulation, regional expression, or translation.28,65 The importance of a network involving CREB, the responsive element silencing transcription factor, and microRNA in regulating neuronal gene expression has recently been described,66 highlighting the complex regulation of this system and thus the many ways in which CREB1 polymorphisms could influence it. To examine cis-acting effects of rs4675690, we queried 2 lymphoblastoid cell line data sets for participants from the Centre Etude Polymorphisme Humaine families, genotyped in the International Haplotype Map Project.67,68 No significant association with CREB1 expression or the adjacent gene LOC151194 was detected (results not shown). As the correlation between expression in transformed lymphoblastoid cell lines and neurons is imperfect, we cannot rule out neuronal effects on expression. Finally, we note other recent studies of apparently nonfunctional SNPs with a significant effect on gene products.69 In the face of this complexity, we elected to pursue in vivo function in parallel with in vitro function, for which fMRI is particularly well suited.
Given the limited sample size of this study, replication with a larger cohort will be required to examine possible sex differences. Men and women may differ in response to or expression of anger in some paradigms, including in studies with CREB1.27,28 While power considerations precluded formal statistical testing for gene-by-sex interaction, after stratifying by sex, peak bilateral insula activation remained salient (results not shown) in both groups.
We find that a polymorphism in linkage disequilibrium with CREB1, previously implicated in self-report–based phenotypes related to negative affect in 2 independent cohorts,27,28 is associated with differential BOLD signal in a network of structures related to the processing of aversive information. Activation of adjacent or overlapping areas within that network is independently associated with key-press behavior in a task involving angry faces. These results suggest that CREB1 plays a role in moderating neural responsiveness to aversive stimuli in the environment, with detectable behavioral consequences.
Acknowledgments
Funding/Support: This study was supported by National Institute of Mental Health grant 06706 (Dr Perlis), National Institute on Drug Abuse grant 14118 (Dr Breiter), and The Phenotype Genotype Project in Addiction and Depression grant DABK39-03-C-0098 from the Office of National Drug Control Policy Counterdrug Technology Assessment Center (Dr Breiter). Further support was provided in part by the Massachusetts General Hospital Department of Radiology (Dr Breiter), grant P41RR14075 from the National Center for Research Resources, and the Mental Illness and Neuroscience Discovery Institute.
Footnotes
Group Information: A list of the Phenotype Genotype Project on Addiction and Mood Disorders Investigators appears at http://pgp.mgh.harvard.edu/PGP/People.html.
Financial Disclosure: Dr Perlis reported serving on advisory or speakers’ boards and receiving honoraria from AstraZeneca, Bristol-Myers Squibb, Eli Lilly and Company, GlaxoSmithKline, Proteus, and Pfizer and being a stockholder in Concordant Rater Systems LLC. Dr Smoller reported receiving honoraria from Hoffman-La Roche Inc, serving on an advisory board for Roche Diagnostics Corporation, and consulting for Eli Lilly and Company. Dr Fava reported receiving research support from Abbott Laboratories, Alkermes, Aspect Medical Systems, Astra-Zeneca, Bristol-Myers Squibb Company, Cephalon, Eli Lilly & Company, Forest Pharmaceuticals Inc, GlaxoSmithKline, J & J Pharmaceuticals, Lichtwer Pharma GmbH, Lorex Pharmaceuticals, Novartis, Organon Inc, PamLab LLC, Pfizer Inc, Pharmavite, Roche, Sanofi-Aventis, Solvay Pharmaceuticals Inc, Synthelabo, and Wyeth-Ayerst Laboratories. He also reported performing advising/consultation with Amarin, Aspect Medical Systems, Astra-Zeneca, Auspex Pharmaceuticals, Bayer AG, Best Practice Project Management Inc, Biovail Pharmaceuticals Inc, BrainCells Inc, Bristol-Myers Squibb Company, Cephalon, CNS Response, Compellis, Cypress Pharmaceuticals, DOV Pharmaceutical, Eli Lilly & Company, EPIX Pharmaceuticals, Fabre-Kramer Pharmaceuticals Inc, Forest Pharmaceuticals Inc, GlaxoSmithKline, Grunenthal GmBH, Janssen Pharmaceutica, Jazz Pharmaceuticals, J & J Pharmaceuticals, Knoll Pharmaceutical Company, Lundbeck, MedAvante Inc, Merck, Neuronetics, Novartis, Nutrition 21, Organon Inc, PamLab LLC, Pfizer Inc, PharmaStar, Pharmavite, Precision Human Biolaboratory, Roche, Sanofi-Aventis, Sepracor, Solvay Pharmaceuticals Inc, Somaxon, Somerset Pharmaceuticals, Synthelabo, Takeda, Tetragenex, Transcept Pharmaceuticals, Vanda Pharmaceuticals Inc, and Wyeth-Ayerst Laboratories. He reported performing speaking for Astra-Zeneca, Boehringer-Ingelheim, Bristol-Myers Squibb Company, Cephalon, Eli Lilly & Company, Forest Pharmaceuticals Inc, GlaxoSmithKline, Novartis, Organon Inc, Pfizer Inc, PharmaStar, Primedia, Reed-Elsevier, and Wyeth-Ayerst Laboratories. He reported having equity holdings in Compellis and MedAvante, receiving patent license returns for SPCD and a combination of azapirones and bupropion in major depressive disorder, and receiving copyright royalties for rating scales not used in this investigation, MGH CPFQ, DESS, and SAFER. Dr Rosenbaum reported having been on the advisory boards of Forest Pharmaceuticals Inc, Eli Lilly & Company, MedAvante Inc, Novartis, Sanofi-Aventis, and Wyeth-Ayerst Laboratories. He has consulted for Neuronetics, Organon Inc, Somaxon, and Supernus. He reported being a speaker for Boehringer Ingelheim Italia and regarding educational content development for Primedia Health Care. He reported having equity holdings in Compellis, Medavante, Somaxon.
References
- 1.Becerra L, Breiter HC, Wise R, Gonzalez RG, Borsook D. Reward circuitry activation by noxious thermal stimuli. Neuron. 2001;32(5):927–946. doi: 10.1016/s0896-6273(01)00533-5. [DOI] [PubMed] [Google Scholar]
- 2.Breiter HC, Aharon I, Kahneman D, Dale A, Shizgal P. Functional imaging of neural responses to expectancy and experience of monetary gains and losses. Neuron. 2001;30(2):619–639. doi: 10.1016/s0896-6273(01)00303-8. [DOI] [PubMed] [Google Scholar]
- 3.Breiter HC, Gasic GP, Makris N. Imaging the neural systems for motivated behavior and their dysfunction in neuropsychiatric illness. In: Deisboeck TS, Kresh JY, editors. Complex Systems Science in Biomedicine. New York, NY: Springer Verlag; 2006. pp. 763–810. [Google Scholar]
- 4.Aharon I, Etcoff N, Ariely D, Chabris CF, O’Connor E, Breiter HC. Beautiful faces have variable reward value: fMRI and behavioral evidence. Neuron. 2001;32 (3):537–551. doi: 10.1016/s0896-6273(01)00491-3. [DOI] [PubMed] [Google Scholar]
- 5.Strauss MM, Makris N, Aharon I, Vangel MG, Goodman J, Kennedy DN, Gasic GP, Breiter HC. fMRI of sensitization to angry faces. Neuroimage. 2005;26 (2):389–413. doi: 10.1016/j.neuroimage.2005.01.053. [DOI] [PubMed] [Google Scholar]
- 6.Breiter HC, Etcoff NL, Whalen PJ, Kennedy WA, Rauch SL, Buckner RL, Strauss MM, Hyman SE, Rosen BR. Response and habituation of the human amygdala during visual processing of facial expression. Neuron. 1996;17(5):875–887. doi: 10.1016/s0896-6273(00)80219-6. [DOI] [PubMed] [Google Scholar]
- 7.Morris JS, Frith CD, Perrett DI, Rowland D, Young AW, Calder AJ, Dolan RJ. A differential neural response in the human amygdala to fearful and happy facial expressions. Nature. 1996;383(6603):812–815. doi: 10.1038/383812a0. [DOI] [PubMed] [Google Scholar]
- 8.Phillips ML, Young AW, Scott SK, Calder AJ, Andrew C, Giampietro V, Williams SC, Bullmore ET, Brammer M, Gray JA. Neural responses to facial and vocal expressions of fear and disgust. Proc Biol Sci. 1998;265(1408):1809–1817. doi: 10.1098/rspb.1998.0506. [DOI] [PMC free article] [PubMed] [Google Scholar]
- 9.Whalen PJ, Rauch SL, Etcoff NL, McInerney SC, Lee MB, Jenike MA. Masked presentations of emotional facial expressions modulate amygdala activity without explicit knowledge. J Neurosci. 1998;18(1):411–418. doi: 10.1523/JNEUROSCI.18-01-00411.1998. [DOI] [PMC free article] [PubMed] [Google Scholar]
- 10.Hariri AR, Mattay VS, Tessitore A, Kolachana B, Fera F, Goldman D, Egan MF, Weinberger DR. Serotonin transporter genetic variation and the response of the human amygdala. Science. 2002;297(5580):400–403. doi: 10.1126/science.1071829. [DOI] [PubMed] [Google Scholar]
- 11.Nitschke JB, Sarinopoulos I, Mackiewicz KL, Schaefer HS, Davidson RJ. Functional neuroanatomy of aversion and its anticipation. Neuroimage. 2006;29 (1):106–116. doi: 10.1016/j.neuroimage.2005.06.068. [DOI] [PubMed] [Google Scholar]
- 12.Paulus MP, Stein MB. An insular view of anxiety. Biol Psychiatry. 2006;60(4):383–387. doi: 10.1016/j.biopsych.2006.03.042. [DOI] [PubMed] [Google Scholar]
- 13.LeDoux J. The emotional brain, fear, and the amygdala. Cell Mol Neurobiol. 2003;23(4–5):727–738. doi: 10.1023/a:1025048802629. [DOI] [PubMed] [Google Scholar]
- 14.Reynolds SM, Zahm DS. Specificity in the projections of prefrontal and insular cortex to ventral striatopallidum and the extended amygdala. J Neurosci. 2005;25(50):11757–11767. doi: 10.1523/JNEUROSCI.3432-05.2005. [DOI] [PMC free article] [PubMed] [Google Scholar]
- 15.Ongür D, Price JL. The organization of networks within the orbital and medial prefrontal cortex of rats, monkeys and humans. Cereb Cortex. 2000;10(3):206–219. doi: 10.1093/cercor/10.3.206. [DOI] [PubMed] [Google Scholar]
- 16.McClung CA, Nestler EJ. Regulation of gene expression and cocaine reward by CREB and DeltaFosB. Nat Neurosci. 2003;6(11):1208–1215. doi: 10.1038/nn1143. [DOI] [PubMed] [Google Scholar]
- 17.Shaw-Lutchman TZ, Impey S, Storm D, Nestler EJ. Regulation of CRE-mediated transcription in mouse brain by amphetamine. Synapse. 2003;48(1):10–17. doi: 10.1002/syn.10172. [DOI] [PubMed] [Google Scholar]
- 18.Carlezon WA, Jr, Thome J, Olson VG, Lane-Ladd SB, Brodkin ES, Hiroi N, Duman RS, Neve RL, Nestler EJ. Regulation of cocaine reward by CREB. Science. 1998;282(5397):2272–2275. doi: 10.1126/science.282.5397.2272. [DOI] [PubMed] [Google Scholar]
- 19.Self DW, Genova LM, Hope BT, Barnhart WJ, Spencer JJ, Nestler EJ. Involvement of cAMP-dependent protein kinase in the nucleus accumbens in cocaine self-administration and relapse of cocaine-seeking behavior. J Neurosci. 1998;18(5):1848–1859. doi: 10.1523/JNEUROSCI.18-05-01848.1998. [DOI] [PMC free article] [PubMed] [Google Scholar]
- 20.Widnell KL, Self DW, Lane SB, Russell DS, Vaidya VA, Miserendino MJ, Rubin CS, Duman RS, Nestler EJ. Regulation of CREB expression: in vivo evidence for a functional role in morphine action in the nucleus accumbens. J Pharmacol Exp Ther. 1996;276(1):306–315. [PubMed] [Google Scholar]
- 21.Guitart X, Thompson MA, Mirante CK, Greenberg ME, Nestler EJ. Regulation of cyclic AMP response element-binding protein (CREB) phosphorylation by acute and chronic morphine in the rat locus coeruleus. J Neurochem. 1992;58(3):1168–1171. doi: 10.1111/j.1471-4159.1992.tb09377.x. [DOI] [PubMed] [Google Scholar]
- 22.Pandey SC, Zhang H, Roy A, Xu T. Deficits in amygdaloid cAMP-responsive element-binding protein signaling play a role in genetic predisposition to anxiety and alcoholism. J Clin Invest. 2005;115(10):2762–2773. doi: 10.1172/JCI24381. [DOI] [PMC free article] [PubMed] [Google Scholar]
- 23.Barrot M, Olivier JD, Perrotti LI, DiLeone RJ, Berton O, Eisch AJ, Impey S, Storm DR, Neve RL, Yin JC, Zachariou V, Nestler EJ. CREB activity in the nucleus accumbens shell controls gating of behavioral responses to emotional stimuli. Proc Natl Acad Sci U S A. 2002;99(17):11435–11440. doi: 10.1073/pnas.172091899. [DOI] [PMC free article] [PubMed] [Google Scholar]
- 24.Barrot M, Wallace DL, Bolaños CA, Graham DL, Perrotti LI, Neve RL, Chambliss H, Yin JC, Nestler EJ. Regulation of anxiety and initiation of sexual behavior by CREB in the nucleus accumbens. Proc Natl Acad Sci U S A. 2005;102(23):8357–8362. doi: 10.1073/pnas.0500587102. [DOI] [PMC free article] [PubMed] [Google Scholar]
- 25.Dwivedi Y, Rao JS, Rizavi HS, Kotowski J, Conley RR, Roberts RC, Tamminga CA, Pandey GN. Abnormal expression and functional characteristics of cyclic adenosine monophosphate response element binding protein in postmortem brain of suicide subjects. Arch Gen Psychiatry. 2003;60(3):273–282. doi: 10.1001/archpsyc.60.3.273. [DOI] [PubMed] [Google Scholar]
- 26.Pandey GN, Dwivedi Y, Ren X, Rizavi HS, Roberts RC, Conley RR. Cyclic AMP response element-binding protein in post-mortem brain of teenage suicide victims: specific decrease in the prefrontal cortex but not the hippocampus. Int J Neuropsychopharmacol. 2006;10(5):621–629. doi: 10.1017/S1461145706007231. [DOI] [PubMed] [Google Scholar]
- 27.Perlis RH, Purcell S, Fagerness J, Cusin C, Yamaki L, Fava M, Smoller JW. Clinical and Genetic Dissection of Anger Expression and CREB1 Polymorphisms in Major Depressive Disorder. Biol Psychiatry. 2007;62(5):536–540. doi: 10.1016/j.biopsych.2006.10.034. [DOI] [PubMed] [Google Scholar]
- 28.Perlis RH, Purcell S, Fava M, Fagerness J, Rush AJ, Trivedi MH, Smoller JW. Association between treatment-emergent suicidal ideation with citalopram and polymorphisms near cyclic adenosine monophosphate response element binding protein in the STAR*D study. Arch Gen Psychiatry. 2007;64(6):689–697. doi: 10.1001/archpsyc.64.6.689. [DOI] [PubMed] [Google Scholar]
- 29.Meyer-Lindenberg A, Weinberger DR. Intermediate phenotypes and genetic mechanisms of psychiatric disorders. Nat Rev Neurosci. 2006;7(10):818–827. doi: 10.1038/nrn1993. [DOI] [PubMed] [Google Scholar]
- 30.First MB, Spitzer R, Gibbon M. Structured Clinical Interview for DSM-IV Axis I Disorders. New York, NY: Biometrics Research Department, New York State Psychiatric Institute; 1996. [Google Scholar]
- 31.Benson V, Marano MA. Current estimates from the National Health Interview Survey, 1995. Vital Health Stat 10. 1998;(199):1–428. [PubMed] [Google Scholar]
- 32.Bernstein IH, Rush AJ, Carmody TJ, Woo A, Trivedi MH. Clinical vs. self-report versions of the quick inventory of depressive symptomatology in a public sector sample. J Psychiatr Res. 2007;41(3–4):239–246. doi: 10.1016/j.jpsychires.2006.04.001. [DOI] [PMC free article] [PubMed] [Google Scholar]
- 33.Rush AJ, Trivedi MH, Ibrahim HM, Carmody TJ, Arnow B, Klein DN, Markowitz JC, Ninan PT, Kornstein S, Manber R, Thase ME, Kocsis JH, Keller MB. The 16-Item Quick Inventory of Depressive Symptomatology (QIDS), clinician rating (QIDS-C), and self-report (QIDS-SR): a psychometric evaluation in patients with chronic major depression. Biol Psychiatry. 2003;54(5):573–583. doi: 10.1016/s0006-3223(02)01866-8. [DOI] [PubMed] [Google Scholar]
- 34.Oldfield RC. The assessment and analysis of handedness: the Edinburgh inventory. Neuropsychologia. 1971;9(1):97–113. doi: 10.1016/0028-3932(71)90067-4. [DOI] [PubMed] [Google Scholar]
- 35.Kellner R. A symptom questionnaire. J Clin Psychiatry. 1987;48(7):268–274. [PubMed] [Google Scholar]
- 36.Ekman P, Friesen W. Pictures of Facial Affect. Palo Alto, CA: Consulting Psychologists Press; 1976. [Google Scholar]
- 37.Deichmann R, Gottfried JA, Hutton C, Turner R. Optimized EPI for fMRI studies of the orbitofrontal cortex. Neuroimage. 2003;19(2 pt 1):430–441. doi: 10.1016/s1053-8119(03)00073-9. [DOI] [PubMed] [Google Scholar]
- 38.Sklar P, Gabriel SB, McInnis MG, Bennett P, Lim YM, Tsan G, Schaffner S, Kirov G, Jones I, Owen M, Craddock N, DePaulo JR, Lander ES. Family-based association study of 76 candidate genes in bipolar disorder: BDNF is a potential risk locus: brain-derived neutrophic factor. Mol Psychiatry. 2002;7(6):579–593. doi: 10.1038/sj.mp.4001058. [DOI] [PubMed] [Google Scholar]
- 39.Buetow KH, Edmonson M, MacDonald R, Clifford R, Yip P, Kelley J, Little DP, Strausberg R, Koester H, Cantor CR, Braun A. High-throughput development and characterization of a genomewide collection of gene-based single nucleotide polymorphism markers by chip-based matrix-assisted laser desorption/ionization time-of-flight mass spectrometry. Proc Natl Acad Sci U S A. 2001;98(2):581–584. doi: 10.1073/pnas.021506298. [DOI] [PMC free article] [PubMed] [Google Scholar]
- 40.Friston KJ, Holmes A, Poline JB, Price CJ, Frith CD. Detecting activations in PET and fMRI: levels of inference and power. Neuroimage. 1996;4(3 pt 1):223–235. doi: 10.1006/nimg.1996.0074. [DOI] [PubMed] [Google Scholar]
- 41.Siegel S. Nonparametric Statistics for the Behavioral Sciences. New York, NY: McGraw-Hill; 1956. [Google Scholar]
- 42.Bookheimer SY, Strojwas MH, Cohen MS, Saunders AM, Pericak-Vance MA, Mazziotta JC, Small GW. Patterns of brain activation in people at risk for Alzheimer’s disease. N Engl J Med. 2000;343(7):450–456. doi: 10.1056/NEJM200008173430701. [DOI] [PMC free article] [PubMed] [Google Scholar]
- 43.Egan MF, Goldberg TE, Kolachana BS, Callicott JH, Mazzanti CM, Straub RE, Goldman D, Weinberger DR. Effect of COMT Val108/158 Met genotype on frontal lobe function and risk for schizophrenia. Proc Natl Acad Sci U S A. 2001;98(12):6917–6922. doi: 10.1073/pnas.111134598. [DOI] [PMC free article] [PubMed] [Google Scholar]
- 44.Wassink TH, Nelson JJ, Crowe RR, Andreasen NC. Heritability of BDNF alleles and their effect on brain morphology in schizophrenia. Am J Med Genet. 1999;88(6):724–728. doi: 10.1002/(sici)1096-8628(19991215)88:6<724::aid-ajmg25>3.0.co;2-7. [DOI] [PubMed] [Google Scholar]
- 45.Filipek PA, Richelme C, Kennedy DN, Caviness VS., Jr The young adult human brain: an MRI-based morphometric analysis. Cereb Cortex. 1994;4(4):344–360. doi: 10.1093/cercor/4.4.344. [DOI] [PubMed] [Google Scholar]
- 46.Makris N, Worth AJ, Sorensen AG, Papadimitriou GM, Wu O, Reese TG, Wedeen VJ, Davis TL, Stakes JW, Caviness VS, Kaplan E, Rosen BR, Pandya DN, Kennedy DN. Morphometry of in vivo human white matter association pathways with diffusion-weighted magnetic resonance imaging. Ann Neurol. 1997;42(6):951–962. doi: 10.1002/ana.410420617. [DOI] [PubMed] [Google Scholar]
- 47.Breiter HC, Gollub RL, Weisskoff RM, Kennedy DN, Makris N, Berke JD, Goodman JM, Kantor HL, Gastfriend DR, Riorden JP, Mathew RT, Rosen BR, Hyman SE. Acute effects of cocaine on human brain activity and emotion. Neuron. 1997;19(3):591–611. doi: 10.1016/s0896-6273(00)80374-8. [DOI] [PubMed] [Google Scholar]
- 48.Caviness VS, Jr, Kennedy DN, Richelme C, Rademacher J, Filipek PA. The human brain age 7–11 years: a volumetric analysis based on magnetic resonance images. Cereb Cortex. 1996;6(5):726–736. doi: 10.1093/cercor/6.5.726. [DOI] [PubMed] [Google Scholar]
- 49.Makris N, Meyer JW, Bates JF, Yeterian EH, Kennedy DN, Caviness VS. MRI-Based topographic parcellation of human cerebral white matter and nuclei II: rationale and applications with systematics of cerebral connectivity. Neuroimage. 1999;9(1):18–45. doi: 10.1006/nimg.1998.0384. [DOI] [PubMed] [Google Scholar]
- 50.Makris N, Gasic GP, Seidman LJ, Goldstein JM, Gastfriend DR, Elman I, Albaugh MD, Hodge SM, Ziegler DA, Sheahan FS, Caviness VS, Jr, Tsuang MT, Kennedy DN, Hyman SE, Rosen BR, Breiter HC. Decreased absolute amygdala volume in cocaine addicts. Neuron. 2004;44(4):729–740. doi: 10.1016/j.neuron.2004.10.027. [DOI] [PubMed] [Google Scholar]
- 51.Wright CI, Fischer H, Whalen PJ, McInerney SC, Shin LM, Rauch SL. Differential prefrontal cortex and amygdala habituation to repeatedly presented emotional stimuli. Neuroreport. 2001;12(2):379–383. doi: 10.1097/00001756-200102120-00039. [DOI] [PubMed] [Google Scholar]
- 52.Britton JC, Taylor SF, Sudheimer KD, Liberzon I. Facial expressions and complex IAPS pictures: common and differential networks. Neuroimage. 2006;31(2):906–919. doi: 10.1016/j.neuroimage.2005.12.050. [DOI] [PubMed] [Google Scholar]
- 53.Grosbras MH, Paus T. Brain networks involved in viewing angry hands or faces. Cereb Cortex. 2006;16(8):1087–1096. doi: 10.1093/cercor/bhj050. [DOI] [PubMed] [Google Scholar]
- 54.Ploghaus A, Tracey I, Gati JS, Clare S, Menon RS, Matthews PM, Rawlins JN. Dissociating pain from its anticipation in the human brain. Science. 1999;284 (5422):1979–1981. doi: 10.1126/science.284.5422.1979. [DOI] [PubMed] [Google Scholar]
- 55.Rauch SL, Savage CR, Alpert NM, Fischman AJ, Jenike MA. The functional neuroanatomy of anxiety: a study of three disorders using positron emission tomography and symptom provocation. Biol Psychiatry. 1997;42(6):446–452. doi: 10.1016/S0006-3223(97)00145-5. [DOI] [PubMed] [Google Scholar]
- 56.Lorberbaum JP, Kose S, Johnson MR, Arana GW, Sullivan LK, Hamner MB, Ballenger JC, Lydiard RB, Brodrick PS, Bohning DE, George MS. Neural correlates of speech anticipatory anxiety in generalized social phobia. Neuroreport. 2004;15(18):2701–2705. [PubMed] [Google Scholar]
- 57.Stein DJ, Arya M, Pietrini P, Rapoport JL, Swedo SE. Neurocircuitry of disgust and anxiety in obsessive-compulsive disorder: a positron emission tomography study. Metab Brain Dis. 2006;21(2–3):267–277. doi: 10.1007/s11011-006-9021-6. [DOI] [PubMed] [Google Scholar]
- 58.Knutson B, Rick S, Wimmer GE, Prelec D, Loewenstein G. Neural predictors of purchases. Neuron. 2007;53(1):147–156. doi: 10.1016/j.neuron.2006.11.010. [DOI] [PMC free article] [PubMed] [Google Scholar]
- 59.Kuhnen CM, Knutson B. The neural basis of financial risk taking. Neuron. 2005;47(5):763–770. doi: 10.1016/j.neuron.2005.08.008. [DOI] [PubMed] [Google Scholar]
- 60.Pliakas AM, Carlson RR, Neve RL, Konradi C, Nestler EJ, Carlezon WA., Jr Altered responsiveness to cocaine and increased immobility in the forced swim test associated with elevated cAMP response element-binding protein expression in nucleus accumbens. J Neurosci. 2001;21(18):7397–7403. doi: 10.1523/JNEUROSCI.21-18-07397.2001. [DOI] [PMC free article] [PubMed] [Google Scholar]
- 61.Chartoff EH, Papadopoulou M, Konradi C, Carlezon WA., Jr Dopamine-dependent increases in phosphorylation of cAMP response element binding protein (CREB) during precipitated morphine withdrawal in primary cultures of rat striatum. J Neurochem. 2003;87(1):107–118. doi: 10.1046/j.1471-4159.2003.01992.x. [DOI] [PMC free article] [PubMed] [Google Scholar]
- 62.Chartoff EH, Mague SD, Barhight MF, Smith AM, Carlezon WA., Jr Behavioral and molecular effects of dopamine D1 receptor stimulation during naloxone-precipitated morphine withdrawal. J Neurosci. 2006;26(24):6450–6457. doi: 10.1523/JNEUROSCI.0491-06.2006. [DOI] [PMC free article] [PubMed] [Google Scholar]
- 63.Glimcher PW, Dorris MC, Bayer HM. Physiological utility theory and the neuroeconomics of choice. Games Econ Behav. 2005;52(2):213–256. doi: 10.1016/j.geb.2004.06.011. [DOI] [PMC free article] [PubMed] [Google Scholar]
- 64.Glimcher PW, Rustichini A. Neuroeconomics: the consilience of brain and decision. Science. 2004;306(5695):447–452. doi: 10.1126/science.1102566. [DOI] [PubMed] [Google Scholar]
- 65.Coven E, Ni Y, Widnell KL, Chen J, Walker WH, Habener JF, Nestler EJ. Cell type-specific regulation of CREB gene expression: mutational analysis of CREB promoter activity. J Neurochem. 1998;71(5):1865–1874. doi: 10.1046/j.1471-4159.1998.71051865.x. [DOI] [PubMed] [Google Scholar]
- 66.Wu J, Xie X. Comparative sequence analysis reveals an intricate network among REST, CREB and miRNA in mediating neuronal gene expression. Genome Biol. 2006;7(9):R85. doi: 10.1186/gb-2006-7-9-r85. [DOI] [PMC free article] [PubMed] [Google Scholar]
- 67.The International HapMap Consortium. The International HapMap Project. Nature. 2003;426(6968):789–796. doi: 10.1038/nature02168. [DOI] [PubMed] [Google Scholar]
- 68.Stranger BE, Forrest MS, Dunning M, Ingle CE, Beazley C, Thorne N, Redon R, Bird CP, de Grassi A, Lee C, Tyler-Smith C, Carter N, Scherer SW, Tavaré S, Deloukas P, Hurles ME, Dermitzakis ET. Relative impact of nucleotide and copy number variation on gene expression phenotypes. Science. 2007;315(5813):848–853. doi: 10.1126/science.1136678. [DOI] [PMC free article] [PubMed] [Google Scholar]
- 69.Kimchi-Sarfaty C, Oh JM, Kim IW, Sauna ZE, Calcagno AM, Ambudkar SV, Gottesman MMA. “Silent” polymorphism in the MDR1 gene changes substrate specificity. Science. 2007;315(5811):525–528. doi: 10.1126/science.1135308. [DOI] [PubMed] [Google Scholar]